

Market Data

June 12, 2015
Shipments and Supply of Sheet Products through April 2015
Written by Peter Wright
This report compares domestic mill shipments and total supply to the market to enable a side by side comparison and the degree to which imports have absorbed demand. Sources are the American Iron and Steel Institute and the Department of Commerce with analysis by SMU.
Table 1 shows both supply and mill shipments of sheet products (shipments includes exports) side by side as a three month average for the periods February through April for both 2014 and 2015.
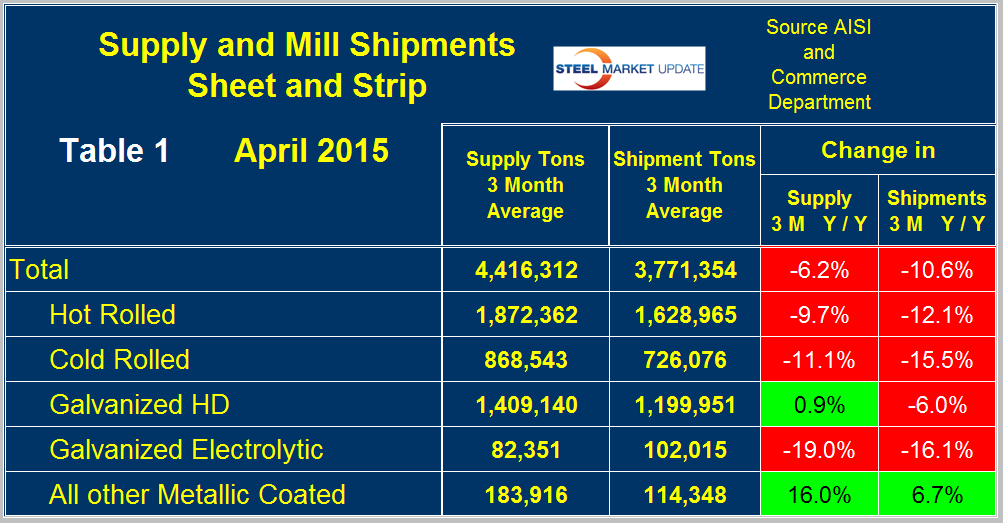
Comparing these two periods total supply to the market was down by 6.2 percent but shipments were down by 10.6 percent. In other words, imports took share from the domestic mills. Table 1 breaks down the total into the individual sheet products. Supply of hot and cold rolled was down by 9.7 percent and 11.1 percent respectively year over year and US mill shipments were down by 10.6 percent and 12.1 percent respectively. HDG eked out a small gain in supply but shipments were down by 6 percent. Electro galvanized which enjoys a trade surplus had a greater decline in supply than it did in shipments. Other metallic coated products (mainly Galvalume) continued to buck the trend and enjoyed a 16.0 percent increase in supply and a 6.7 percent increase in shipments. A review of supply and shipments separately for individual sheet products is given below.
Apparent Supply is a proxy for market demand and is defined as domestic mill shipments to domestic locations plus imports. In the three months through April 2015 average monthly supply of sheet and strip was 4,416,312 tons, down by 8.2 percent from the previous three month period, November through January, down by 6.2 percent from the same period last year and down by 3.2 percent YTD compared to the first four months of 2014. Table 2 shows the change in supply by product on the same basis through April.
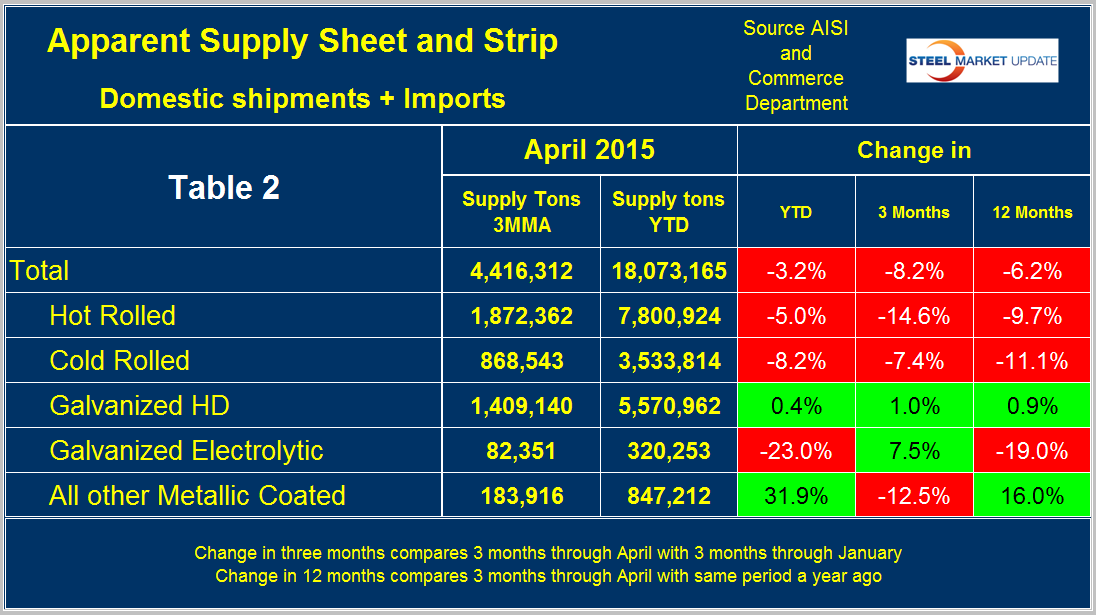
There is a big difference between products. Hot and cold rolled followed the overall trend but coated products did not. HDG strengthened slightly in all three time comparisons. The results for EG look strange and we had to make a double take to understand it. YTD was down by 23 percent and in 3 months was up by 7.5 percent. This is because the YTD result is year over year and the 3 month result compares three months through April with 3 months through January. Results for other metallic coated look strange in the opposite direction but the explanation is the same. YTD growth year/year is strong at 31.9 percent but that has faded in the last three months compared to the period November through January.
Figure 1 shows the long term supply picture for the three major sheet and strip products, HR, CR and HDG since January 2006.
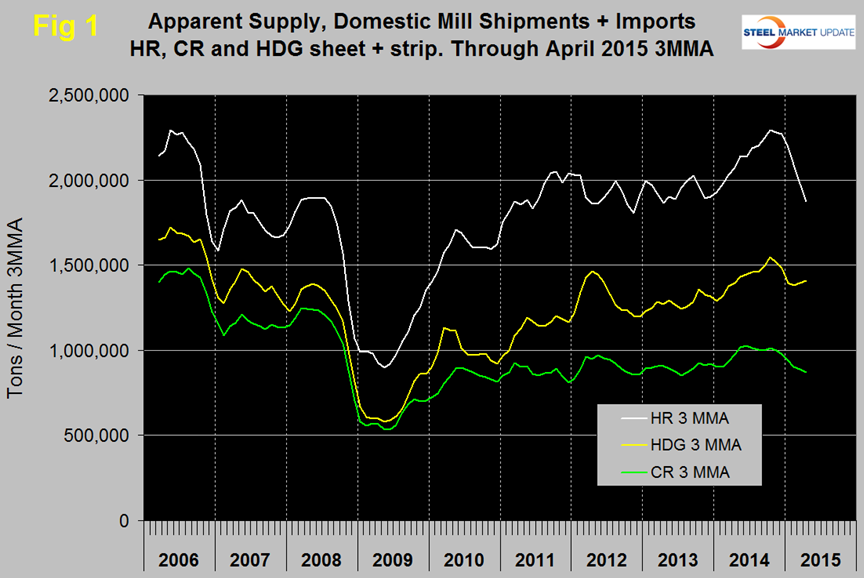
Hot rolled and cold rolled have both declined each month this year but hot dipped galvanized has strengthened for the last three months. In Q4 2014 all three were in higher demand than at any time since the recession, that is no longer the case. Hot band was range bound for 2 ½ years until April 2014 when it broke out and advanced through October followed by a small decline in November and December and a more rapid decline this year. Cold rolled supply fell below a million tons to 977,452 tons in December (3MMA) after being above that threshold for six of the previous seven months and continued to decline in January through April. Prior to this recent past the last time cold rolled exceeded a million tons was in October 2008 as we prepared to go over the cliff. Hot dipped galvanized had a strong bump in H1 2012, declined in H2 2012 and steadily improved for 22 months with a small decline in November and December, a more rapid decline in January then a pickup in the last three months.
Figure 2 shows import market share of sheet products and includes long products for comparison.
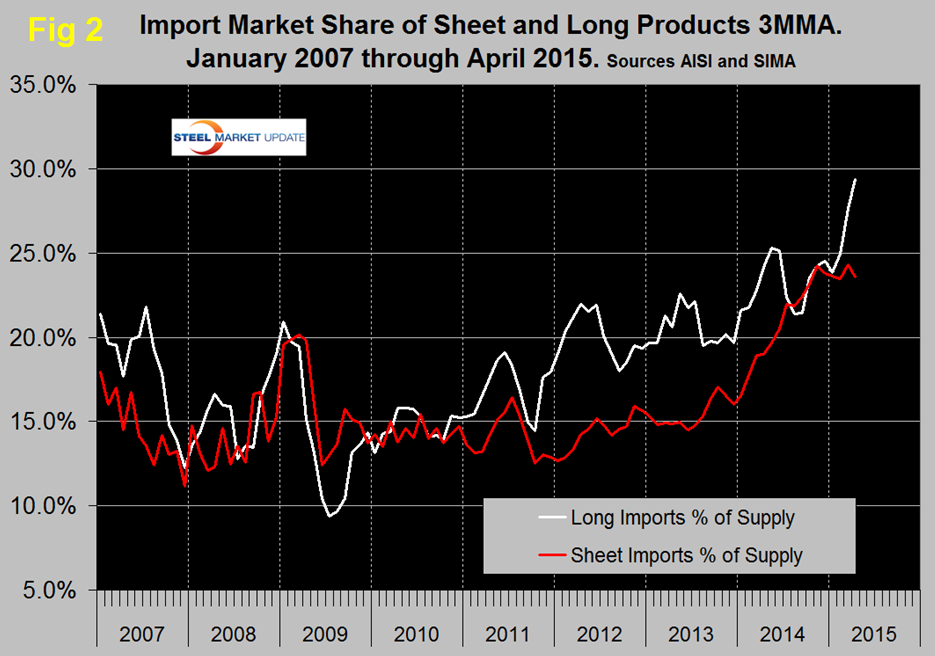
Based on a 3MMA the import market share of sheet products declined in April to 23.6 percent, down from 24.3 percent in March. The months March and November had the highest import market share since the beginning of the recovery.
Mill Shipments: Table 3 shows that total shipments of sheet and strip products including hot rolled, cold rolled and all coated products were down by 8.3 percent YTD year over year and down by 7.2 percent in 3 months through April compared to 3 months through January.
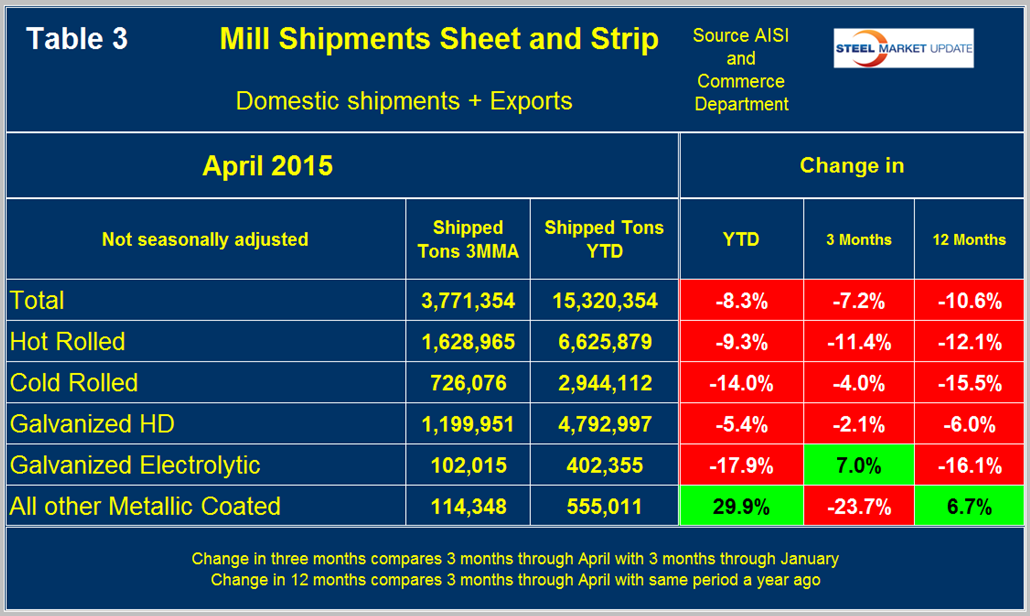
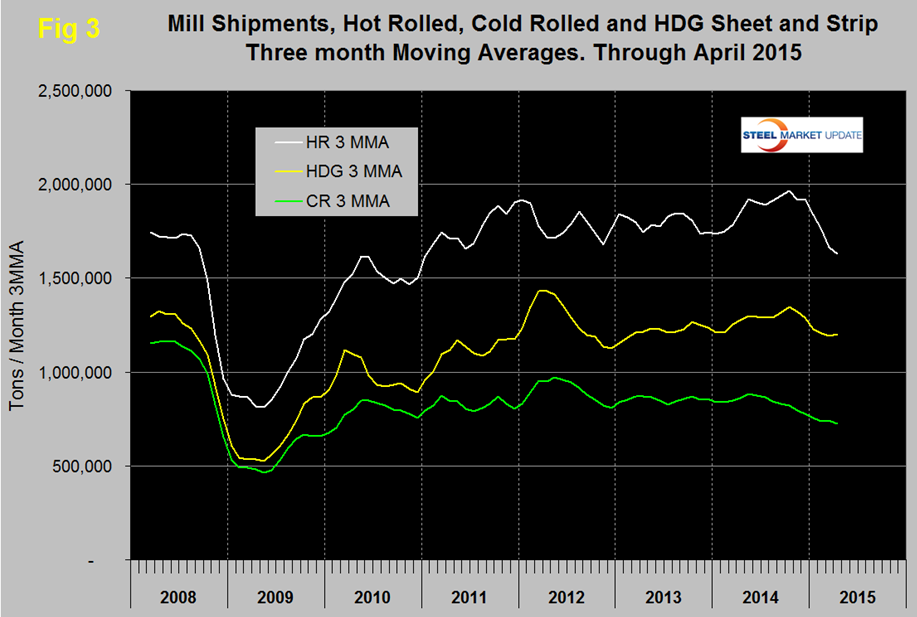
Three months through April year over year was down by 10.6 percent. HR, CR and HDG were all down in all three time comparisons. EG and Galvalume showed the same pattern as described above for supply and for the same reasons. Figure 3 looks similar to Figure 1 though the declines for HR and CR are not as extreme. HDG improved slightly in April after five months of decline.
SMU Comment: Import market share is still exceptionally high, longs being even worse than sheet products. Year over year mill shipments are declining faster than apparent supply a differential that is driven directly by import market share.


