Prices

June 11, 2015
Hot Rolled Futures: Foreign Territory
Written by Andre Marshall
The following article on the hot rolled coil (HRC), busheling scrap (BUS), iron ore and financial futures markets was written by Andre Marshall, CEO of Crunch Risk LLC and our Managing Price Risk I & II instructor. Here is how Andre saw trading over the past week:
Financial Markets:
We continue to be the best of the lot from a current economic and sentiment standpoint, despite disappointing trailing GDP levels. We are last 2107 on the June S&P future after having tested recent lows of 2070.75 on June 9th. We are likely headed to 2145 zone and this will be a stop on our way to the 2275 area mentioned before. Our printing press is still healthy, at least in terms of attitude, and the Fed is under pressure from the likes of the IMF and EU central bank to not raise rates until well into 2016. Frankly with the dollar strength such an issue, I’ve never believed the Fed could raise in the foreseeable future, and if they do it, it will be only to have the ability to adjust back down when we go screeching into another recession.
In commodities it’s a bit of a mixed bag. In Crude we are sideways still hovering either side of $60/bbl for some time now, actually since early May. Generally this is a bullish formation, albeit, we have a few lower lows here of late. Time will tell. We are last $60.61/bbl on the July contract. In Copper, we are seeing warning signs as the market has broken support and probably headed to test old lows. We are last $2.6725/lb on the July. As we see in ferrous as well it’s a mixed bag. With US stable, US scrap up, Iron Ore up, Chinese steel down, and Europe and Europe under pressure again.
Steel:
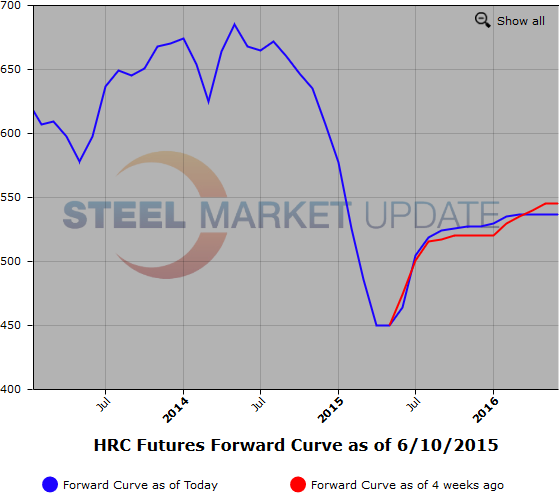
A very quiet week in steel futures with 205 lots or 4100 ST trading. With everyone headed to the steel conference or in the steel conference, it’s not really very surprising. That said things have quieted down. Even though we have steep contangos, it appears the market is a bit tapped out to be able to take advantage. Sellers are wary of all the various potential bullish factors in the market, while buyers are reticent to pay any steeper a contango than already paying. We are last $510-515 zone Q3, $520-527 zone Q4, $525-530 zone Q1 and $535-540 zone Q2/Q4 2016. The CRU meanwhile represents a static market despite recent trade case filings on Galv products. We are last $456/ST down $1/ST from last week or essentially in hold mode.
Meanwhile the conference generated a strange mix of moods. Very foreign territory, I think, for all concerned. The overall mood was pretty bearish still, while the prognostications of the future were of “protectionism”, which should be bullish. I think the crowd heard the message, but are so scarred from the past events that they just don’t know what to do with the information. So, “do nothing” is the conclusion. As I have said before, the market is way too bearish, and plenty of folks are going to get caught scrambling at some point here. Clearly the drivers of this attitude are also shaped by worse credit, limited or no cash, and fear of worse conditions (really?). Gives opportunities to those who have any of those items licked.
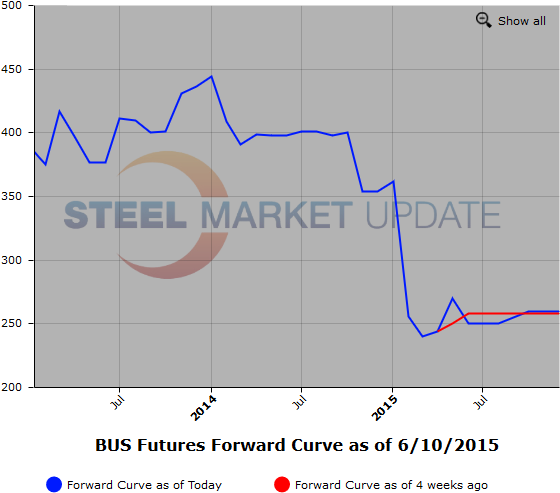
Below are two graphics of the HRC and BUS Futures Forward Curve. The interactive capabilities of the graphs can only be used in Steel Market Update website here. If you have any issues logging in or navigating the website please contact us at info@steelmarketupdate.com or (800) 432 3475.
Iron Ore:
Here it looks strong in Iron Ore. In the last two days we have rallied $3/-4MT on the curve depending on the month. The index today is $64.43/MT which is up from $60-62 range last week. The port stocks have gotten quite lean as the mills inventories have depleted and they have had to move to replenish. The back end of the curve has also moved up in tandem which spells a less bearish future undertone to this market. Maybe we have indeed rounded the corner. Let’s put July either side of $62.65/MT, Q3 either side of $60.50/MT, Q4 either side of $55.85/MT and Calendar ’16 either side of $51.40/MT.
Scrap:
Well a mixed story here too, we are up $20-25/T depending on grade and location. Market sentiment appears to be that this may be overdone while others feel it will sustain and even go higher in July onward as leads times creep out and the lack of obsolete really pinches. Meanwhile CFR Turkey is under pressure as that market, which had led the rally suffers from lack of real demand in MENA zone and continues to suffer under the wall of bilet coming in from China. We are last $281/MT on the CR index.


