Market Data

May 18, 2015
May Distributor Apparent Excess Rises to 692,000 Tons
Written by John Packard
Last month Steel Market Update (SMU) forecast flat shipments for the month of April. We believed at that time that the U.S. flat rolled steel service centers would ship 108,600 tons per day or total flat rolled shipments of 2,389,200.
According to the Metal Service Center Institute (MSCI), which released shipment and inventory data for April this past week it was not to be as they reported distributors shipping 2,266,100 tons at an average of 103,000 tons per day.
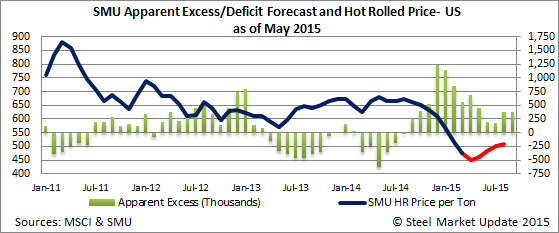
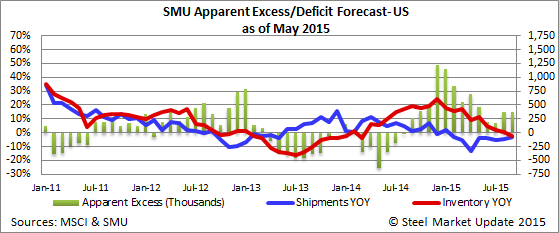
Regarding flat rolled steel service center inventories, SMU thought we would see a reduction in the excess by 200,000 tons. We actually saw the excess grow (based on our calculations) to 692,000 tons.
To put this into historical perspective, the 5,817,500 tons of flat rolled inventories being held by the domestic service centers are 654,500 tons above the historical average for the month of April (1987-2014).
The only thing we did get right was the direction of prices which we had projected would begin to move higher.
What went wrong?
The month of April had 22 shipping days as did the previous month of March. We knew shipments would be below last year levels due to the nature of the market that existed in April 2014 (coming off extended production problems at the domestic steel mills and a stronger energy market). We thought the pace of demand would keep shipments in line with March 2015 levels at 108,600 tons. But, we were wrong.
Demand levels have slipped, based on MSCI data, and we have spoken to a number of service centers who confirmed that their April was disappointing. However, we are still hearing that most distributors with whom we are speaking have improving order books for the month of May.
Are the April numbers a sign of what is to come or, just a blip on the radar screen?
The monthly shipping average (post 1987) for the month of April is 2,186,000 tons and the 2,266,100 tons shipped in April 2015 was just above that average.
Inventories did drop for the month, by 56,800 tons. A far cry from what we had forecast. In prior months we had been building in excess material from foreign steel arriving at the docks. We did not do this for April and we believe this is where we made an error.
We believed the service centers would bring in approximately 96,000 tons per day of flat rolled and, in fact, according to MSCI the number was actually 100,423 tons per day. We were surprised in earlier months by the low receipt rate as we knew the foreign tonnage had to be entered onto the books eventually. We believe that the variance is due to the high rates of imports being received into inventory.
May Forecast & Beyond
Before we make our forecast let’s first take a look at the historical trends to see what May, June, July, August & September.
We decided to use Peter Wright’s analysis (see other article in this newsletter) and to use the average daily shipping rate for the year’s 2012, 2013 & 2014 in our new forecast. The following are the averages for each month during that 3 year time period:
May = 113,000 tons per day
June = 110,000 tons per day
July = 103,000 tons per day
Aug = 107,000 tons per day
Sept = 109,000 tons per day
The month of April ended with 5,817,500 tons of flat rolled steel inventories at the service centers.
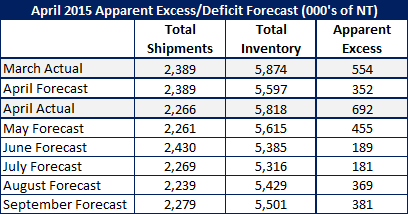
May forecast is for is for 2,261,000 tons of shipments for the month.
May forecast for inventory to end the month at 5,615,000 tons.
May forecast is for the apparent excess to be reduced to 455,000 tons.
The forecast for the balance of the months are shown in the table below. It is our opinion that having apparent excess inventories of less than 250,000 tons is a positive for the steel industry.


