Market Data

May 11, 2015
Currency Update for Steel Trading Nations
Written by Peter Wright
The monthly value of the Federal Reserve Broad Index of the US $ against our major trading partners is reported about one month in arrears. In one month through about April 12th this index weakened by 1.9 percent which was a sharp reversal from the previous seven month trend.
![]()
The monthly BI is a “Real” inflation adjusted index.
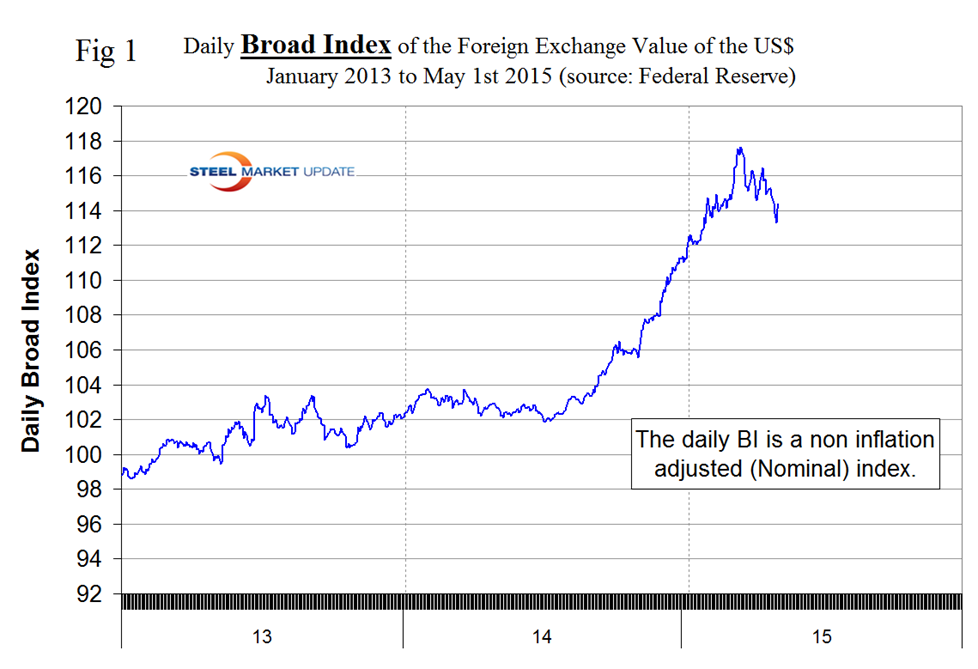
The Fed also reports a daily nominal (non-inflation adjusted) index, the latest data for which is May 1st. On March 13th the daily index peaked at 117.92, the highest value since May 13th 2004. We have shortened the time axis of Figure 1 to show more clearly the latest changes. After March 13th the nominal daily index declined to 113.31 on April 29th and recovered to 114.39 on May 1st. Overall the daily index has strengthened by 11.7 percent in 12 months, by 0.3 in 3 months, has weakened by 0.3 percent in 1 month and weakened again by 0.2 percent in 7 days.
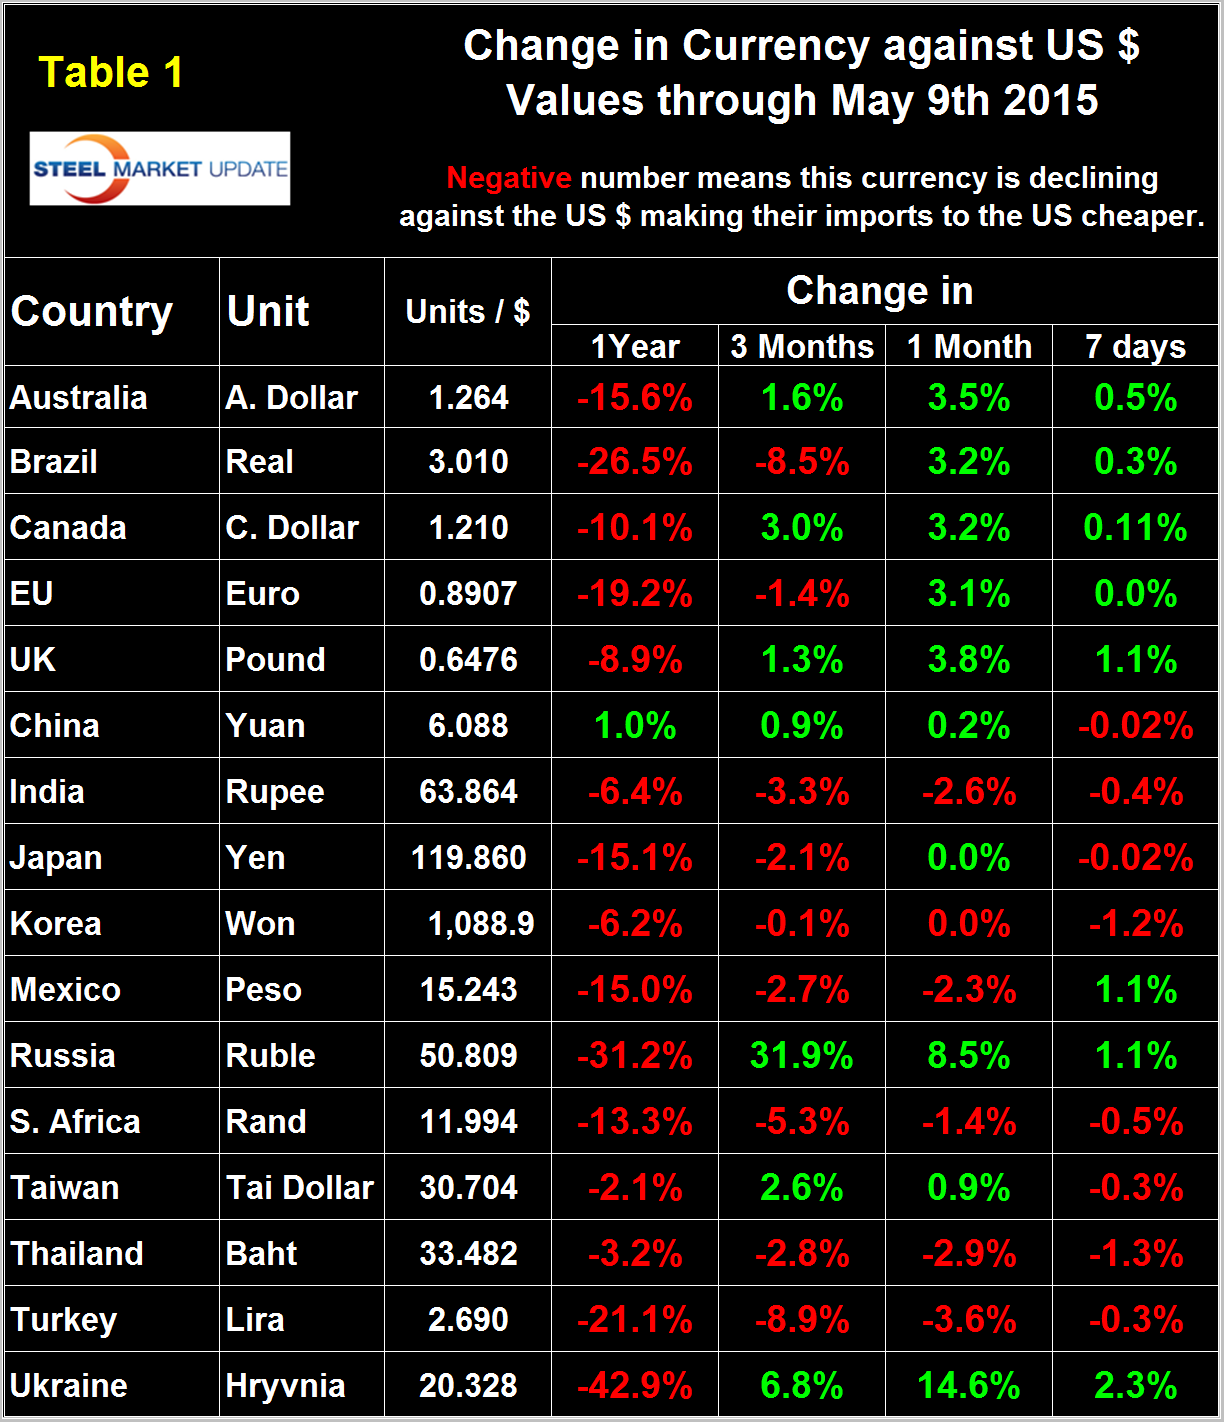
It does not necessarily follow that the currencies of the steel trading nations follow the Broad Index. Our data for the individual nations is 7 days more current than the daily BI which means that comparing the two is not quite apples and apples especially at times of volatility or direction reversal as we see today. Table 1 shows the number of currency units of steel trading nations that it takes to buy one US dollar and the change in one year, three months, one month and seven days. The table is color coded to indicate strengthening of the dollar in red and weakening in green. We regard strengthening of the US Dollar as negative and weakening as positive because the effect on net imports.
In 2014, the total U.S. trade volume was 25 percent of GDP therefore currency swings can have a huge effects on the rest of the economy and of the steel industry in particular. An explanation of the source data is given at the end of this piece. Our last publication of currency data was April 17th and since then the wave of green in Table 1 has backed off somewhat. On February 14th, only 3 of the 16 currencies listed were green in the one month column. On March 23rd this had risen to 4 and on April 17th to 15 meaning that the dollar had weakened against all but one of the steel trading currencies. In this latest analysis the number of greens has fallen to 10 in the one month column and fell again to 8 in the seven day column. Therefore we can see that the currencies of the steel trading nations followed the trend of the daily Broad Index in April but since then the dollar has strengthened slightly against half of the steel trading nation’s currencies.
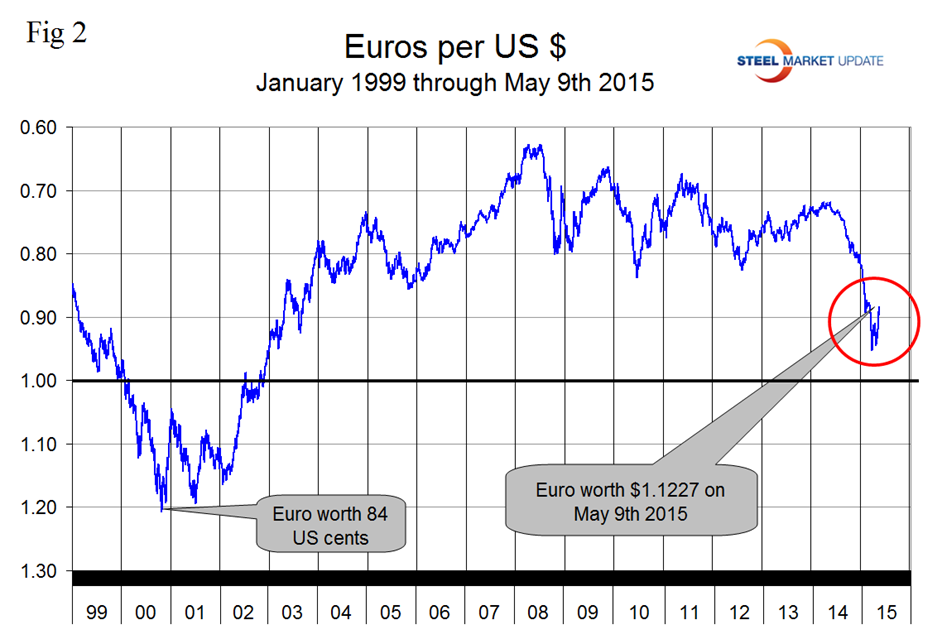
At SMU we continue to regard the saga of the Euro as having the most significant future impact on the US steel industry. On September 6th last year the Euro broke through the 1.3 US $/Euro level for the first time since July 11th 2013, on January 6th it broke through 1.20 and through 1.10 on March 7th. The Euro stayed below 1.10 until April 30th and has since strengthened to 1.1227 (Figure 2).
A devalued Euro means that US exports will be more expensive in Europe and European imports will be cheaper here. This is particularly true for steel trade. In addition European scrap will be more attractive to Turkish buyers than supplies from the US which will put downward pressure on domestic scrap prices. We don’t believe the Euro zone can exist indefinitely in its present form considering the trade imbalances between the north and south. The Greek situation has again gone critical.
Armada Executive Intelligence had the following to say on May 6th: “European negotiators have put themselves in a position they can’t walk away from. Their final position demands a full payment of debts. There are still many who assert that everything must be tried to keep Greece in the Eurozone and that a forced dissolution would be catastrophic for the Greeks, Europe and likely the entire financial world. The worry is that the whole notion of the Eurozone would fall apart and in a matter of months more and more nations would choose to leave and the euro would be no more – replaced by the old welter of independent currencies in Europe. Some nations would likely win in this scenario but others would lose big and among those would be Germany as their Deutschemark would instantly become one of the strongest currencies in the world. That would devastate the export sector in Germany which is the part of their economy that accounts for the majority of growth. There are others who look at the current impasse and see no practical way to keep Greece in the Eurozone. It is apparent that Greek leaders think they would be better off going it alone and in some respects they may be correct. If they pull out they will be in a position to default on the heavy debts they owe and they will call this “restructuring”. Some of the creditors will have no choice but to take the deal offered and others will fight Greece every step of the way. It will look a lot like the default that Argentina went through a few years ago and that country continues to pay a heavy price for that move. The reintroduction of the drachma will mean that Greece will have one of the weakest currencies in the world. This will be good for the export sector but here is the catch – Greece has very little to export. The country has no real manufacturing sector and relies on agriculture shipments and tourism. These will both benefit from the weak drachma but neither will pull in the kind of money needed to address the needs of the country. The fact is that Greece needs a major overhaul of its economy and it needs loans to give it time to accomplish that overhaul. The impact on Europe will be bad either way but it can be argued that twisting itself in knots to accommodate the Greeks will be worse than cutting ties. The immediate impact will be psychological and the markets will be in turmoil for weeks and maybe longer. That could be enough to drop Europe back into a recession and that triggers all kinds of reactions as the nations of the EU are even less prepared for a recession than they were in 2008. In time the dust settles and the region grasps what Greece really meant to the union and the fact is that Greece has been a drain instead of an asset from the very start. The real threat has always been that other nations would follow suit and leave but once Spain, Portugal and Italy see what happens to Greece it is likely they will lose their enthusiasm for the move. In the end it is likely that Greece suffers far more than Europe as a whole and that brings up a whole new set of political fears.”
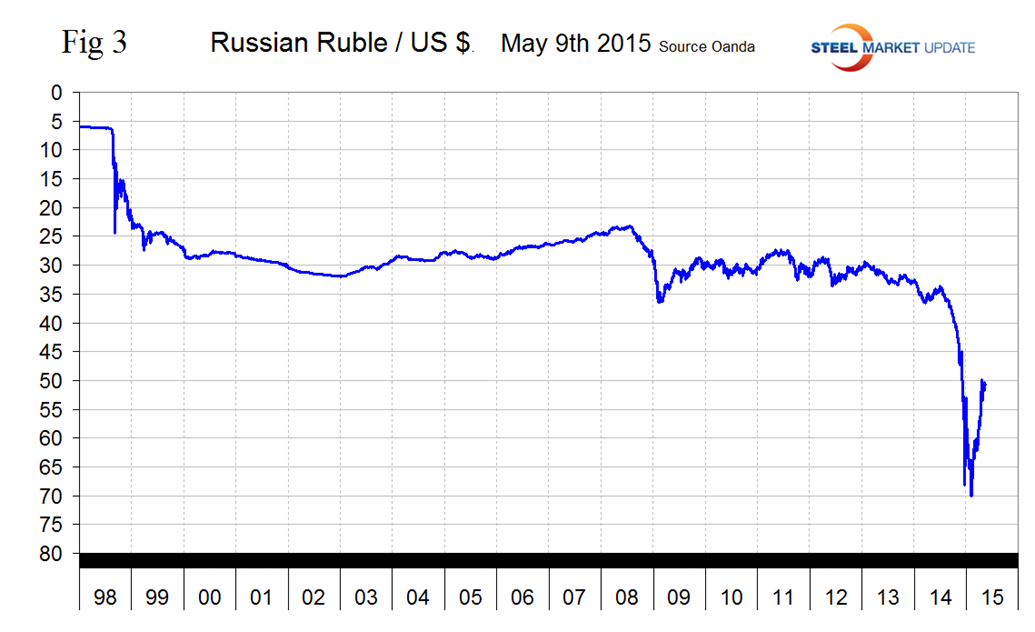
The Russian Ruble strengthened to 50 to the dollar on April 16th and has since maintained that level. The Ruble had declined to slightly less than 70 to the US $ on February 1st (Figure 3). As it stands now the Ruble has declined by 31.2 percent against the dollar in 12 months but in the last three months has recovered by 31.9 percent.
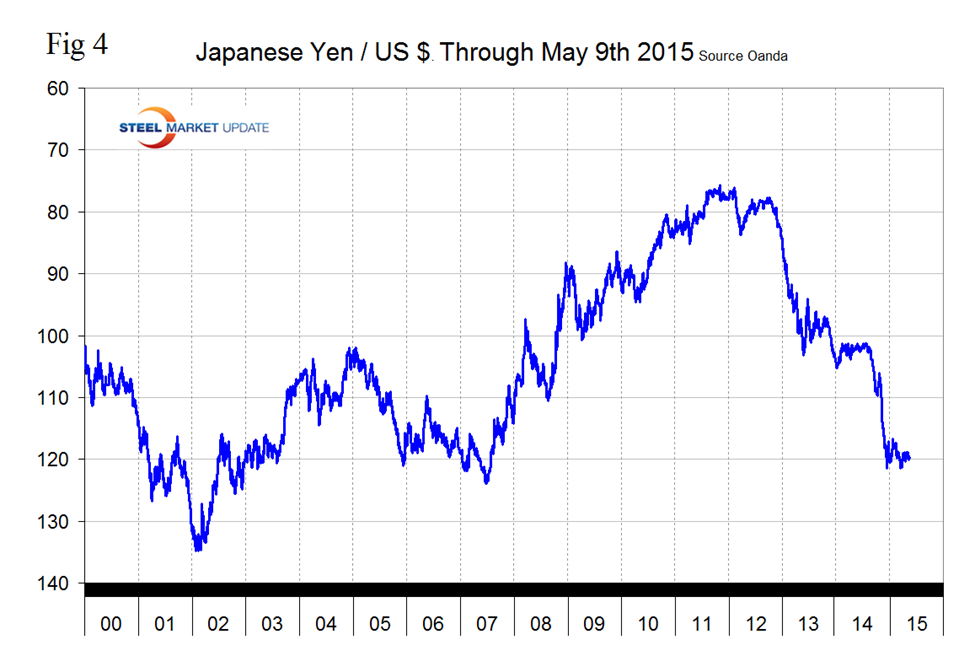
The Japanese Yen broke through the 120 level on December 6th and has been trading sideways ever since closing at 119.86 on May 9th (Figure 4).
It looks as though central bank intervention has had some success in breaking the Yen’s fall. Depreciation against the dollar has been 15.1 percent in 12 months and by 2.1 percent in three months. In the last month and 7 days there has been no change in the value of the Yen. The Bank of Japan remains on its path of loose monitory policy in hopes of spurring increased economic activity. In April, BOJ officials held the benchmark lending rate at 0 percent, and remained steadfast in their commitment to increase the monetary base at an annual rate of about 90 trillion yen. Since 2010, benchmark rates have been held at 0 percent. Policymakers continue to refuse to react to falling inflation as they blame temporary issues, such as weak energy prices, as being the main culprit.
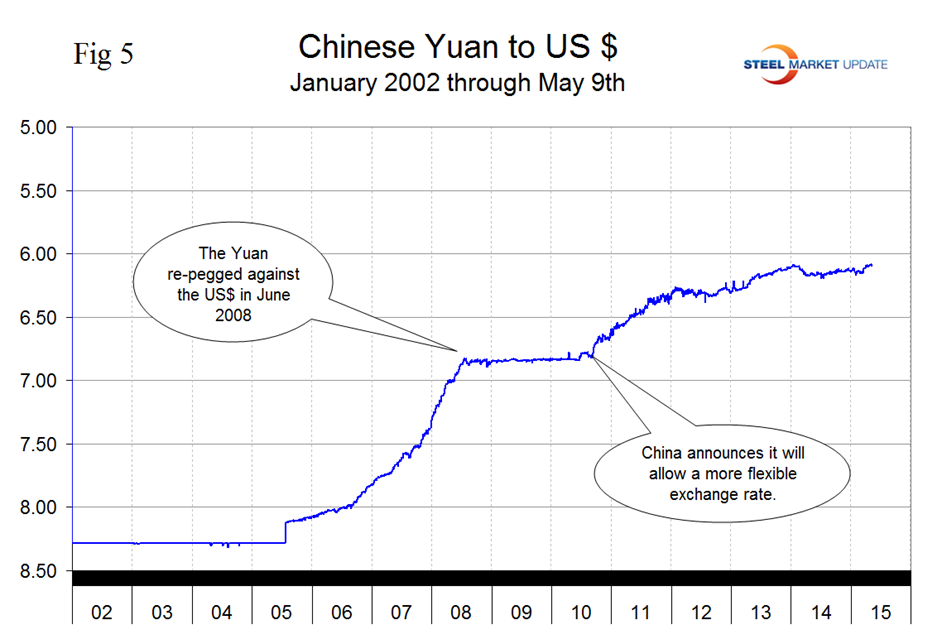
The Chinese Yuan closed at 6.088 on May 9th and has been strengthening slightly since the beginning of April (Figure 5).
We haven’t seen anything in the press to suggest that China is relaxing its dollar peg. Whenever the exchange rate fluctuates too much, the central bank of China intervenes in the markets to bring the rate back to where it wants it to be. Managing the exchange rate this way has helped China to compete in global export markets and accumulate trillions of dollars’ worth of foreign exchange reserves. As China’s economy has grown the PBOC has allowed the Yuan to appreciate by 25 percent over the past 10 years, giving up some of its competitive advantage. As a result and also because of lackluster international demand, exports growth has slowed. China’s exports have also taken a hit because its two main competitor economies (the Eurozone and Japan) have aggressively devalued their currencies against the dollar. The yuan being pegged to the dollar automatically went up against the euro and the yen.
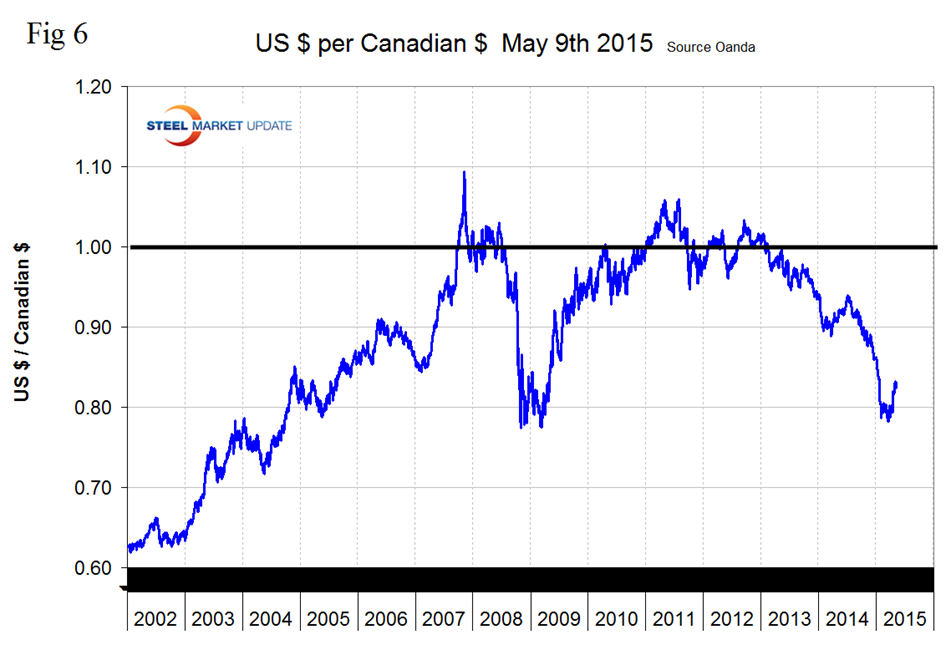
After trading in the mid to low 90 cent region for most of 2014 the Canadian dollar crashed through 80 cents on January 29th 2015, stabilized until April 16th and has since risen to 82.64 US cents on May 9th. The Loonie was down by 10.1 percent in the last year but up by 3.2 percent in the last month. Strengthening continued through the last 7 days (Figure 6).
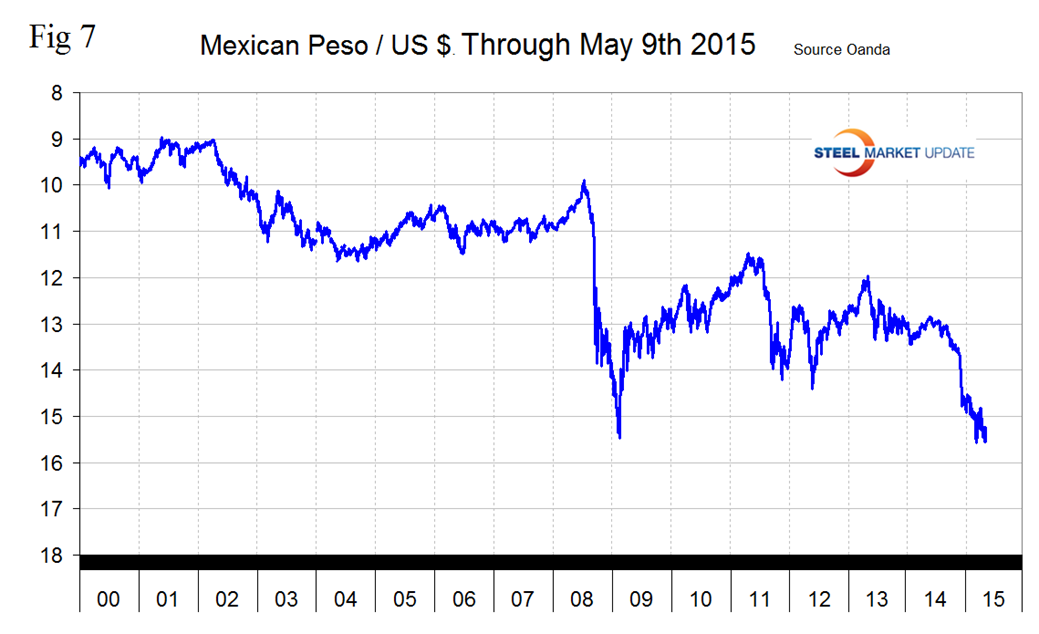
The Mexican Peso broke through 15 to the US Dollar on February 12th, bottomed out at 15.5786 on March 12th and has since been trading in a range as high as 14.82 ever since. On May 9th the peso was down by 15.0 percent in 12 months and 2.3 in one month but was up by 1.1 percent in 7 days (Figure 7). The Peso is weaker than at any time since early 2009 which has severe implications for the distribution of manufacturing within NAFTA.
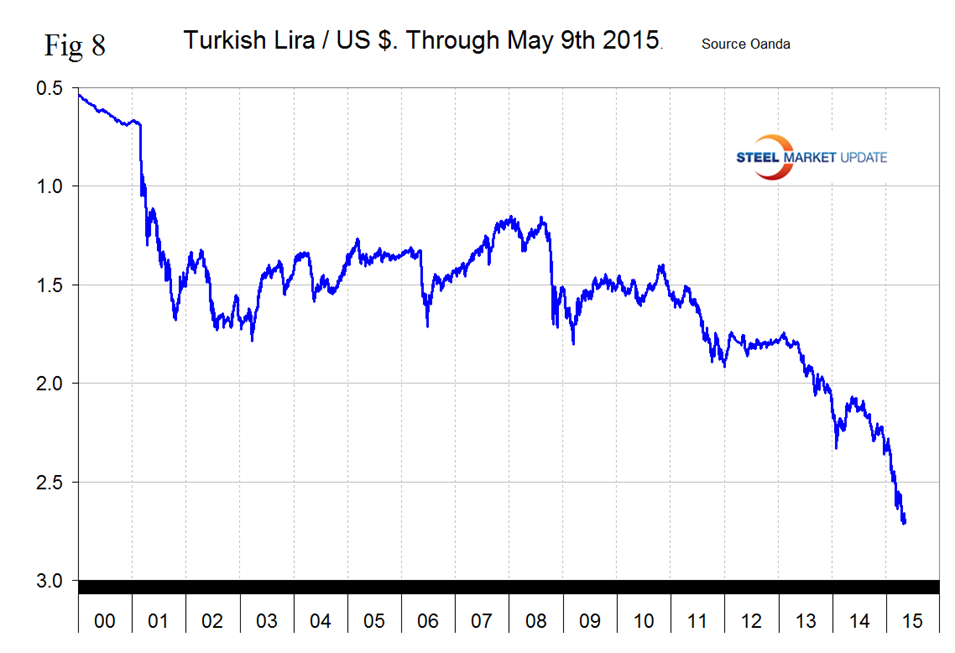
The Turkish Lira broke through 2.4 to the dollar on January 30th, through 2.5 on February 28th, through 2.6 on March 14th and closed at 2.6895 on May 9th. The Lira has declined by 21.1 percent in the last year and by 3.6 percent in the last month (Figure 8).
The decline has been remorseless since November last year. The US position as a scrap supplier to Turkey has deteriorated strongly against the Eurozone and the United Kingdom as the Dollar has strengthened against the Euro and the Pound. Market Watch observed in early May that, “The Turkish lira is falling as manufacturing activity declines, weighing on economic growth, which is leading to policy easing. Turkey’s exports are dropping at the steepest rate in six years. Inflationary pressures are also weighed on manufacturers, with input prices rising at the fastest rate since March 2014. The latest PMI data signal an entrenched downturn in the Turkish manufacturing sector. Turkish goods producers face the unenviable combination of falling demand and rising inflation.”
SMU Comment: There has been a respite in the dollar’s climb in the last month after it became apparent that the FOMC probably won’t raise interest rates in June. However the US economy is currently the strongest of the developed nations and an interest rate increase before the end of the year is probable assuming the economy stays on track. Therefore the probable future trend is not good for US steel producer competitiveness and will continue to attract imports and suppress both exports and raw materials prices. If instability in the Euro gets worse and the currency union were to unravel then countries like Italy and Spain would experience a huge, (50 percent) currency devaluation overnight. Since these countries have sizable steel industries the implications are obvious. In this analysis we report on the currencies that we think have the most immediate significance, but all 16 steel trading nation graphs are available on request if any reader has a special interest that we haven’t covered.
Explanation of Data Sources: The broad index is published by the Federal Reserve on both a daily and monthly basis. It is a weighted average of the foreign exchange values of the U.S. dollar against the currencies of a large group of major U.S. trading partners. The index weights, which change over time, are derived from U.S. export shares and from U.S. and foreign import shares. The data are noon buying rates in New York for cable transfers payable in the listed currencies. At SMU we use the historical exchange rates published in the Oanda Forex trading platform to track the currency value of the US $ against that of sixteen steel trading nations. Oanda operates within the guidelines of six major regulatory authorities around the world and provides access to over 70 currency pairs. Approximately $4 trillion US $ are traded every day on foreign exchange markets.


