Market Data

April 23, 2015
Oil & Gas Markets & Their Impact on Steel
Written by Peter Wright
The energy markets, especially oil and natural gas, are major users of flat rolled steel and plate products. As oil prices have fallen the production of pipe & tube and related products for the energy segment of the economy have fallen significantly. This has had a major impact on hot rolled coil production and pricing.
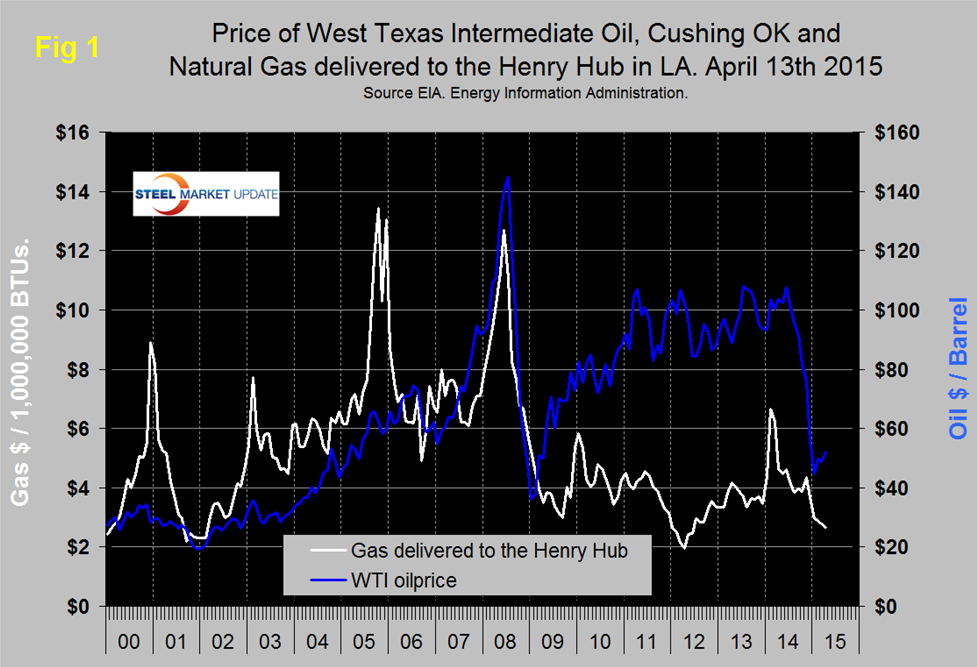
Figure 1 shows historical gas and oil prices since January 2000. The daily spot price of West Texas Intermediate fell below $100 per barrel in August and by January 23rd was down to $44.80. By April 13th, the latest daily figure available from the Energy Information Administration (EIA) the price of WTI had recovered to $51.95. Brent closed at $57.14 on the same day. Natural gas delivered to the Henry Hub in Louisiana fell below $4.00 / MM BTUs in August, there was an uptick in November but since then the price has declined every month and reached $2.67 on the 10th of April.
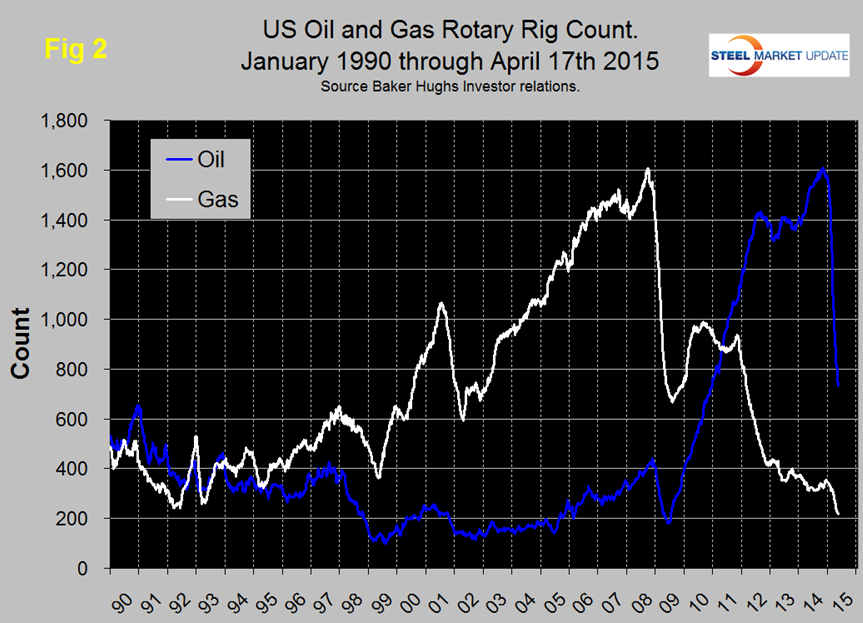
Gas and oil prices are reflected in the drill rig count. Figure 2 shows the Baker Hughes North American Rotary Rig Count which is a weekly census of the number of drilling rigs actively exploring for or developing oil or natural gas in the United States and Canada. Rigs are considered active from the time they break ground until the time they reach their target depth and may be establishing a new well or sidetracking an existing one. The Baker Hughes Rotary Rig count includes only those rigs that are significant consumers of oilfield services and supplies. Figure 2 shows that the oil rig count which had been trending flat for almost two years, accelerate in 2014 until October 10th when it reached 1,609 and has since responded to the collapsing oil price by declining to 734. Through April 17th there was no slowdown in the rate of decline of oil rigs. The gas rig count has fallen by 99 from this time last year and now stands at 217 which is the lowest level since our earliest data of January 1990.
Earlier this month Stratfor made the following observations about Iran and the global energy markets: “The likelihood of the United States and Iran reaching a deal this summer means that additional barrels of Iranian oil eventually will make their way to the market, further depressing the price of oil, as well as the Russian ruble. To be clear, Iranian oil is not going to flood the market instantaneously with the signing of a deal. Iran is believed to have as much as 35 million barrels of crude in storage that it could offload quickly once export sanctions are terminated by the Europeans and eased by the United States via presidential waiver. But Iran will face complications in trying to bring its mature fields back online. Enhanced recovery techniques to revive mothballed fields take money and infrastructure, which is difficult to apply when oil prices are hovering around $50 per barrel. Under current conditions, Iran can bring some 400,000-500,000 barrels per day back online over the course of a year, but this will be a gradual process as Iran vies for foreign investment in its dilapidated energy sector The rehabilitation of Iran’s energy sector, however gradual a process that may be, will complicate Russia’s uphill battle in trying to maintain its energy leverage over Europe. Russia is a critical supplier of energy to Europe, currently providing about 29 percent and 37 percent of Europe’s natural gas and oil needs, respectively. An additional 50 billion cubic meters of natural gas available for export from the United States within the next five years will not be able to compete with Russia on price due to the low operational and transport costs of Russian natural gas. Even so, the United States will still be creating more supply in the natural gas market overall to give Europe the option of paying more for its energy security should the political considerations outweigh the economic cost. The Baltic states are already working toward this option, with Lithuania taking the lead in creating a mini-liquefied natural gas hub for the region to try to reduce, if not eliminate, Baltic dependence on Russia. This year, Poland is debuting its own LNG facility, and the Sabine Pass terminal in Louisiana is scheduled to bring the first LNG exports from the Lower 48 to market, with shipments already contracted for Asia.”
The total number of operating rigs is now 954 a decrease of 115 in the last month. Land rigs decreased by 111 to 921 and off shore by 4 to 33. On a regional basis the big three states for operating rigs are Texas, Oklahoma and North Dakota. Texas at 411 on April 17th was down by 53 in the last month and by 54 percent since September 26th. On the same basis Oklahoma at 118 was down 18 and 45 percent and North Dakota at 83, down 15 and 56 percent.
The Energy Information Administration released its Annual Energy Outlook forecast through 2040 on April 14th, some of its major conclusions were:
Growth in U.S. energy production—led by crude oil and natural gas—and only modest growth in demand reduces U.S. reliance on imported energy supplies. Energy imports and exports come into balance in the United States starting in 2028 in the AEO2015 Reference case and in 2019 in the High Oil Price and High Oil and Gas Resource cases. Natural gas is the dominant U.S. energy export, while liquid fuels continue to be imported.
Through 2020, strong growth in domestic crude oil production from tight formations leads to a decline in net petroleum imports and growth in net petroleum product exports in all AEO2015 cases. In the High Oil and Gas Resource case, increased crude production before 2020 results in increased processed condensate exports. Slowing growth in domestic production after 2020 is offset by increased vehicle fuel economy standards that limit growth in domestic demand. The net import share of crude oil and petroleum products supplied falls from 33 percent of total supply in 2013 to 17 percent of total supply in 2040 in the Reference case. The United States becomes a net exporter of petroleum and other liquids after 2020 in the High Oil Price and High Oil and Gas Resource cases because of greater U.S. crude oil production.
The United States transitions from being a modest net importer of natural gas to a net exporter by 2017. U.S. export growth continues after 2017, with net exports in 2040 ranging from 3.0 trillion cubic feet (Tcf) in the Low Oil Price case to 13.1 Tcf in the High Oil and Gas Resource case.
Growth in crude oil and dry natural gas production varies significantly across oil and natural gas supply regions and cases, forcing shifts in crude oil and natural gas flows between U.S. regions, and requiring investment in or realignment of pipelines and other midstream infrastructure. U.S. energy consumption grows at a modest rate over the AEO2015 projection period, averaging 0.3 percent per year from 2013 through 2040 in the Reference case. A marginal decrease in transportation sector energy consumption contrasts with growth in most other sectors. Declines in energy consumption tend to result from the adoption of more energy-efficient technologies and existing policies that promote increased energy efficiency.
Growth in production of dry natural gas and natural gas plant liquids (NGPL) contributes to the expansion of several manufacturing industries (such as bulk chemicals and primary metals) and the increased use of NGPL feedstocks in place of petroleum-based naphtha feedstocks.
Rising long-term natural gas prices, the high capital costs of new coal and nuclear generation capacity, state-level policies, and cost reductions for renewable generation in a market characterized by relatively slow electricity demand growth favor increased use of renewables.
Rising costs for electric power generation, transmission, and distribution, coupled with relatively slow growth of electricity demand, produce an 18 percent increase in the average retail price of electricity over the period from 2013 to 2040 in the AEO2015 Reference case. The AEO2015 cases do not include the proposed Clean Power Plan.
Improved efficiency in the end-use sectors and a shift away from more carbon-intensive fuels help to stabilize U.S. energy related carbon dioxide (CO2) emissions, which remain below the 2005 level through 2040.
SMU’s view is that the changes presently taking place in the global energy markets could change overnight if Saudi Arabia is drawn into an active conflict with Iran over the situation in Yemen, or if OPEC decides to cut production. In the meantime steel demand will be negatively impacted as is already the case for OCTGs. The decline in global oil prices has reduced the incentive to invest in non-traditional wells (horizontal) which have a much shorter production life cycle than vertical wells. Consequently this sector will begin to dry up within a couple of years which will close the supply/demand imbalance in the US and to a lesser extent globally.


