Market Data

April 19, 2015
Currency Update for Steel Trading Nations
Written by Peter Wright
The monthly value of the Federal Reserve Broad Index of the US dollar against our major trading partners is reported about one month in arrears. Through early March this index continued to strengthen and reached 94.686, after breaking 90 in December for the first time since July 2009.
![]()
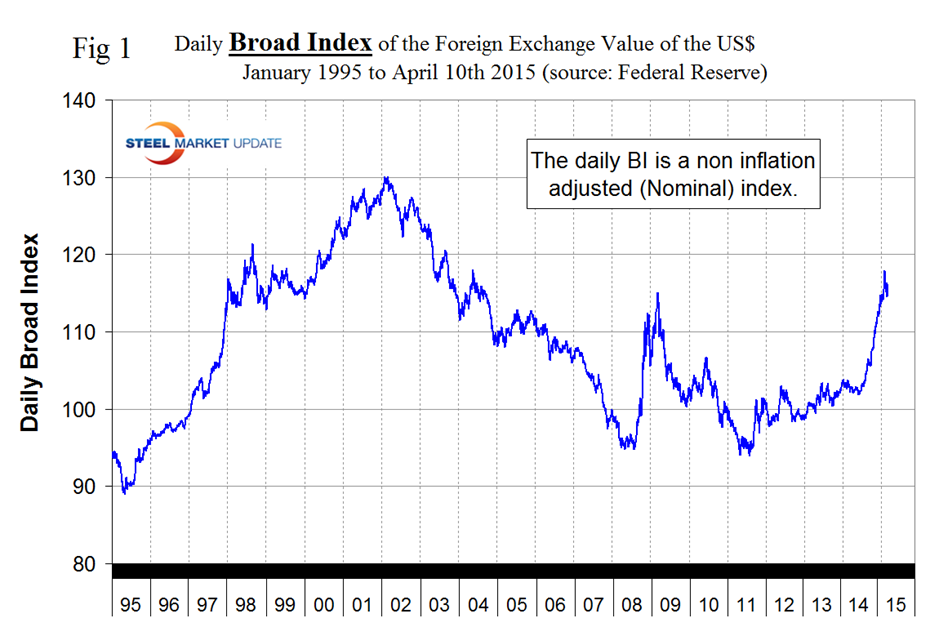
The monthly BI is a “Real” inflation adjusted index. The Fed also reports a daily nominal (non-inflation adjusted) index, the latest data for which is April 10th. On March 13th the daily index peaked at 117.92, the highest value since May 13th 2004. Figure 1 shows that the nominal daily index had fallen to 116.15 on April 10th. Overall the daily index has strengthened by 12.9 percent in 12 months, by 2.8 percent in 3 months, has weakened by 0.9 percent in 1 month and recovered by 1.3 percent in 7 days.
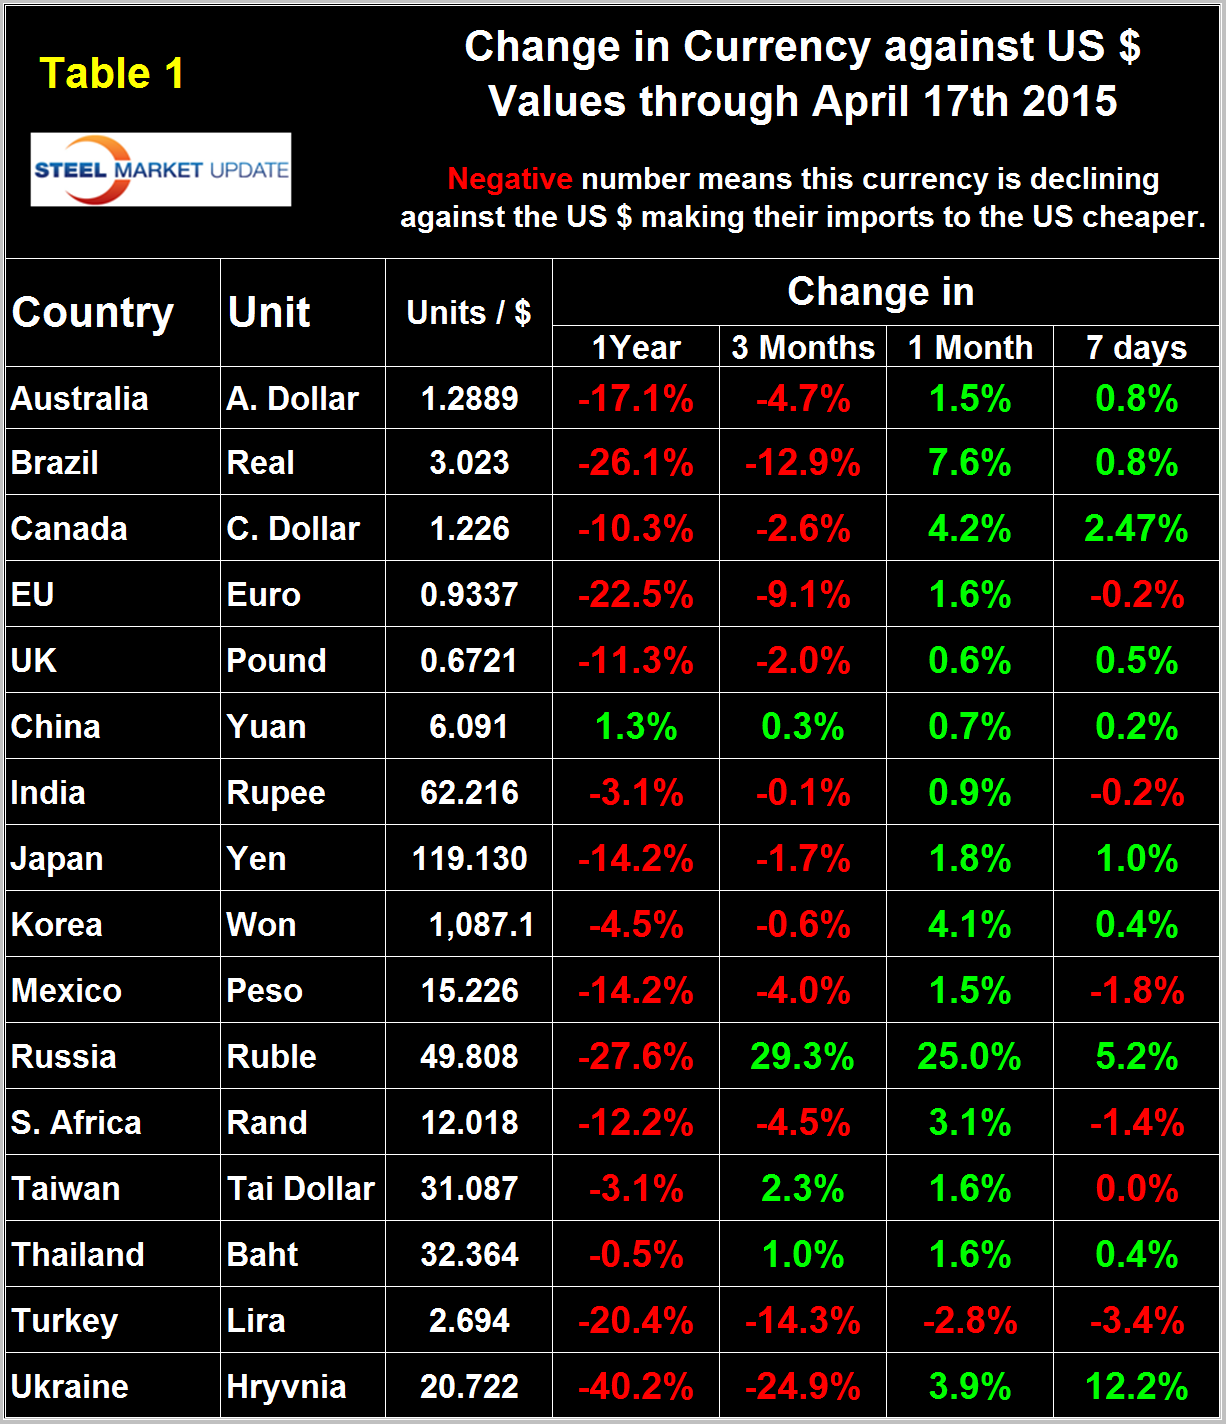
It does not necessarily follow that the currencies of the steel trading nations follow the Broad Index. Our data for the individual nations is 7 days more current than the daily BI and indicates a continuing weakening in the 7 days from the 10th to the 17th. Table 1 shows the number of currency units of steel trading nations that it takes to buy one US dollar and the change in one year, three months, one month and seven days. Negative values for change indicate that the dollar is strengthening against a particular currency. An explanation of the source data is given at the end of this piece.
Our last publication of currency data was March 23rd and since then the wave of green in Table 1 has continued to move to the left. On February 14th, 13 of the 16 currencies listed were red in both the seven day and one month columns. On March 23rd 15 were green in the seven day column and 4 in the one month column. In this latest update 15 are green in the one month column and 10 in the seven day column. Therefore we can see that the currencies of the steel trading nations have been strengthening against the dollar for over a month. The only currency to decline against the dollar in the last month was the Turkish Lira and that decline accelerated in the last seven days. Table 1 is color coded to indicate strengthening of the dollar in red and weakening in green. We regard strengthening of the US Dollar as negative and weakening as positive because the effect on net imports. In 2014, the total U.S. trade volume was 25 percent of GDP therefore currency swings can have a huge effects on the rest of the economy.
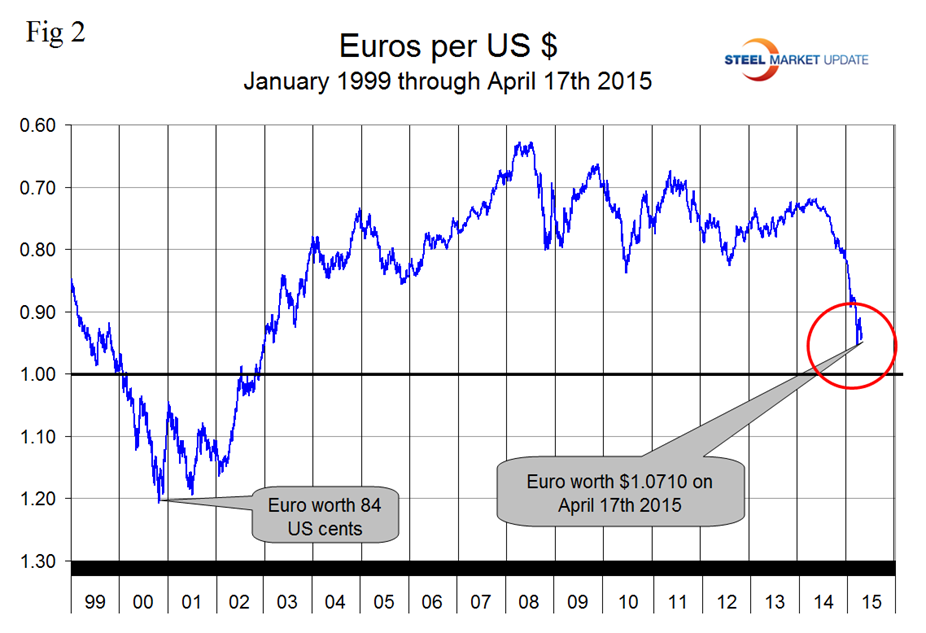
At SMU we continue to regard the saga of the Euro as having the most significant future impact on the US steel industry. On September 6th last year the Euro broke through the 1.3 US $/Euro level for the first time since July 11th 2013, on January 6th it broke through 1.20 and through 1.10 on March 7th. Since then the Euro has stayed below 1.10 and closed at 1.071 on April 17th (Figure 2).
A devalued Euro means that US exports will be more expensive in Europe and European imports will be cheaper here. This is particularly true for steel trade. In addition European scrap will be more attractive to Turkish buyers than supplies from the US which will put downward pressure on domestic scrap prices. We don’t believe the Euro zone can exist indefinitely in its present form considering the trade imbalances between the north and south. German unit labor costs are the lowest in Europe, 50 percent of Germany’s GDP is export oriented and German goods flood the rest of Europe. Under normal circumstances countries like Spain or Italy for example would simply de-value their currencies and the trade imbalances would be corrected. The common currency prevents such a measure. It seems to us that if the Euro is to survive, the only long term solution is the creation of a United States of Europe with common fiscal and monetary policies between members as we have in the US. The likelihood of this happening is extremely remote. If member countries exit the Euro, again to use Italy and Spain ass examples, their currencies would devalue by at least 50 percent overnight. Since these countries have sizeable steel industries the implications are obvious. Armada described the Greek situation very well on April 1st; The EU and the IMF are trying to strike a deal with Athens. They want a deal. But, as we heard today in an interview with Warren Buffet, you can’t “vote your way to prosperity”. That’s an interesting concept because that’s what the people of Greece thought they were doing. They put a liberal government in place that would reverse the actions of the previous administration. The new Syriza Party hiked the country’s minimum wage, increased debt relief for impoverished people (which wiped out private banks holding that debt), cut taxes, and increased government spending. All at a time when the country is broke and owes foreign debt holders a tremendous amount of money. Imagine this: voters were outraged that the country would pay its creditors before trying to spend their way to economic growth through entitlement handouts. Officials still cannot reach a deal because the Syriza Government would have to reverse everything it has done since it took office at the beginning of the year – and break its campaign promises. But, they are asking neighbors for the impossible. This would be the same as a relative of yours living in a million dollar house to ask you for money to pay their mortgage before they get foreclosed on, only to take that money and go on a clothing shopping spree. Then next month, they come back again and have to borrow money because now they are two months behind. When does it stop? That’s what creditors across Europe are asking.
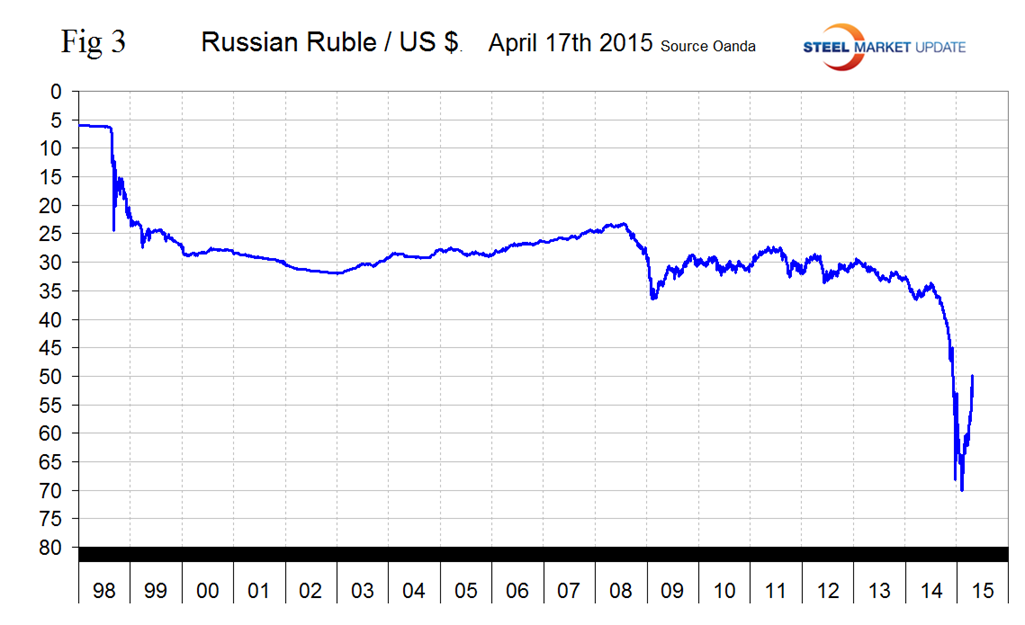
The surprise in our last update was that the Russian Ruble which had declined to slightly less than 70 to the US $ on February 1st had bounced back to 59.27 in March 23rd. The recovery has maintained its momentum through the 17th when for the first time since November 30th last year a dollar could be exchanged for less than 50 rubles (Figure 3). As it stands now the Ruble has declined by 27.6 percent against the dollar in 12 months but in the last three months has recovered by 29.3 percent.
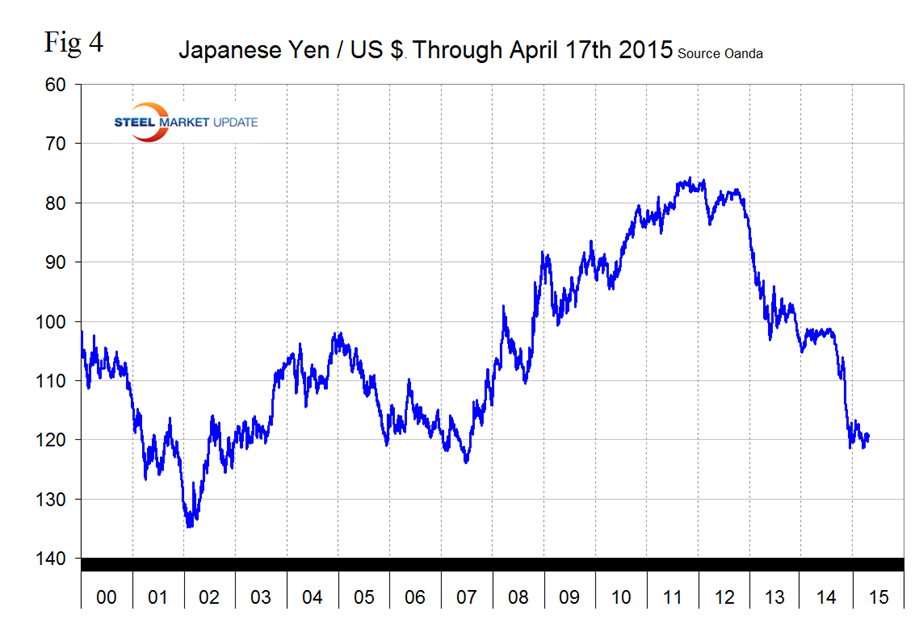
The Japanese Yen broke through the 120 level on December 6th and has been trading sideways ever since closing at 119.13 on April 17th (Figure 4).
It looks as though central bank intervention has had some success in breaking the Yen’s fall. Depreciation against the dollar has been 14.2 percent in 12 months and by 1.7 percent in three months. In the last month the Yen has strengthened by 1.8 percent and by 1.0 percent in seven days. The Bank of Japan remains on its path of loose monitory policy in hopes of spurring increased economic activity. In April, BOJ officials held the benchmark lending rate at 0 percent, and remained steadfast in their commitment to increase the monetary base at an annual rate of about 90 trillion yen. Since 2010, benchmark rates have been held at 0 percent. Policymakers continue to refuse to react to falling inflation as they blame temporary issues, such as weak energy prices, as being the main culprit.
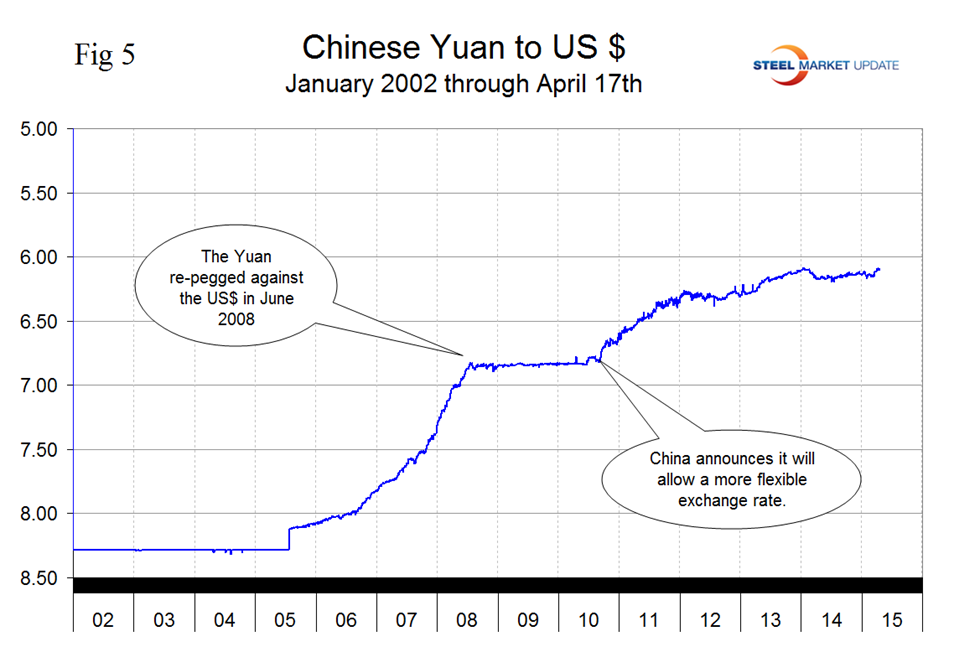
The Chinese Yuan closed at 6.0906 on April 17th with very little change in over a year (Figure 5).
Since the financial crisis of 2008, China has been pursuing a policy of internationalization of its currency. One of the most important milestones for the Yuan’s ascent onto the world stage is its potential in January 2016 to be included in the IMF’s Special Drawing Rights, a basket of reserve currencies. Upon its inclusion, every IMF member country’s central bank will be required to purchase yuan to hold in reserve. This could result in a surge in demand for China’s currency. The increasing use of Chinese yuan in global trade doesn’t mean it will displace the dollar as the world’s reserve currency. Central banks are extremely conservative investors. They want to preserve value and be able to sell their assets rapidly in case of an emergency. The investment opportunities in China are often risky, illiquid, or both and don’t qualify as central bank investments. In addition, world-class financial markets rely on a set of domestic institutions independent of regime meddling, and investors demand the rule of law. Because of U.S. military and economic strength, central banks are generally happy investing in U.S which is still eons ahead of the People’s Republic of China when it comes to independent regulation, a court system with integrity, and transparency.
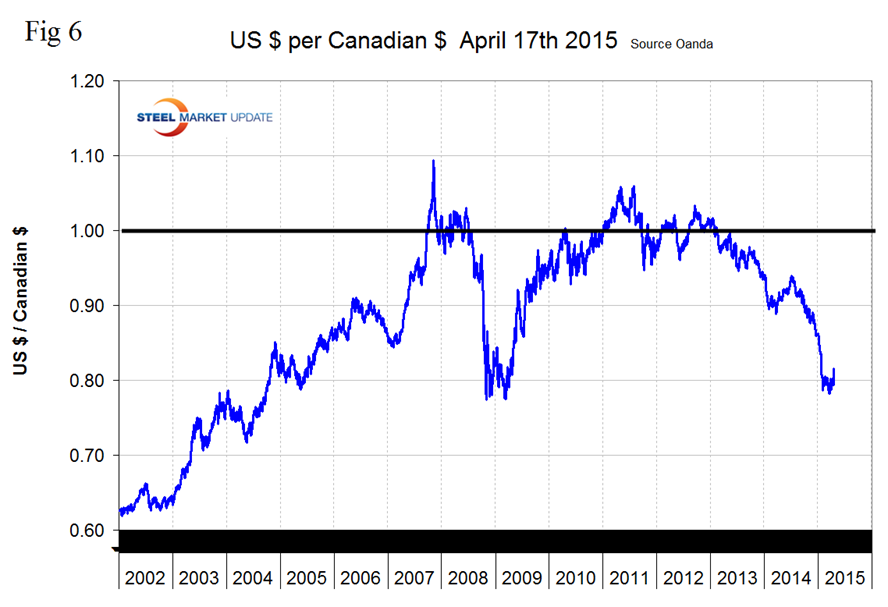
After trading in the mid to low 90 cent region for most of last year the Canadian dollar crashed through 80 cents on January 29th then stabilized and after being below 80 cents for most of the time since then had recovered to 0.8158 on the 17th. The Loonie was up by 2.5 percent in the last 7 days and by 4.2 percent in the last month, but is still down by 2.6 percent in the last three months and by 10.3 percent in 12 months (Figure 6).
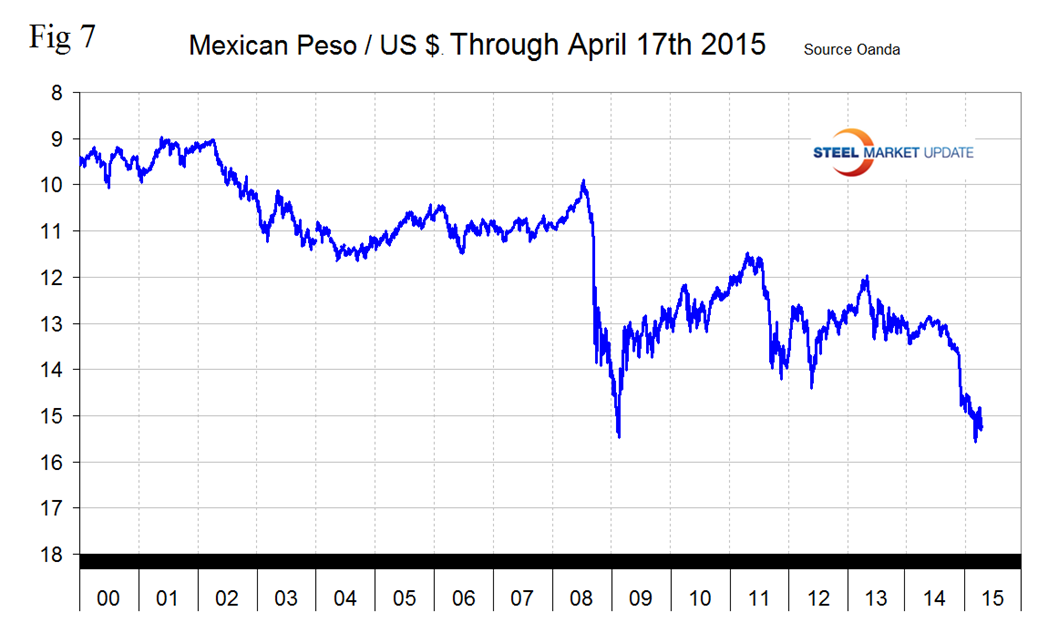
The Mexican Peso broke through 15 to the US Dollar on February 12th, bottomed out at 15.5786 on March 12th then recovered along with the rest closing at 15.2262 on the 17th. The peso was down by 14.2 percent in 12 months and 4.0 percent in three months. It recovered by 1.5 percent in the last month but gave that back in the last seven days (Figure 7). The Peso is weaker than at any time since early 2009 which has severe implications for the distribution of manufacturing within NAFTA.
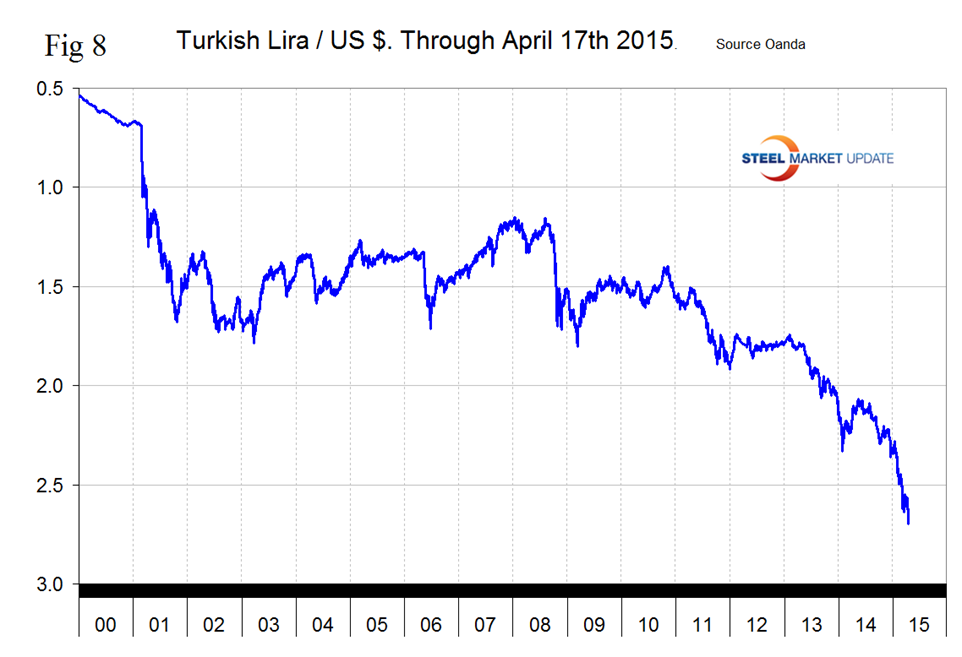
The Turkish Lira broke through 2.4 to the dollar on January 30th, through 2.5 on February 28th, through 2.6 on March 14th and closed at 2.6944 on April 17th. The Lira has declined by 20.4 percent in the last year and by 14.3 percent in the last 3 months, (Figure 8).
The decline is accelerating. The US position as a scrap supplier to Turkey has deteriorated strongly against the Eurozone and the United Kingdom as the Dollar has strengthened against the Euro and the Pound. Interest rates have greatly fluctuated in Turkey over the last year to initially deter capital outflows by raising rates, then cutting throughout the year to spur economic growth. This led to wide consumer price swings and declining consumption which weighed on economic activity as a whole. With Turkish policymakers still in a bind, it is likely the lira continues to decline against the U.S. dollar in coming months.
SMU Comment: There has been a respite in the dollar’s climb in the last month after it became apparent that the FOMC probably won’t raise interest rates in June. Nevertheless longer term trends are not good for US steel producer competitiveness and will continue to attract imports and suppress both exports and raw materials prices. In this analysis we report on the currencies that we think have the most immediate significance, but all 16 steel trading nation graphs are available on request if any reader has a special interest that we haven’t covered.
Explanation of Data Sources: The broad index is published by the Federal Reserve on both a daily and monthly basis. It is a weighted average of the foreign exchange values of the U.S. dollar against the currencies of a large group of major U.S. trading partners. The index weights, which change over time, are derived from U.S. export shares and from U.S. and foreign import shares. The data are noon buying rates in New York for cable transfers payable in the listed currencies. At SMU we use the historical exchange rates published in the Oanda Forex trading platform to track the currency value of the US $ against that of sixteen steel trading nations. Oanda operates within the guidelines of six major regulatory authorities around the world and provides access to over 70 currency pairs. Approximately $4 trillion US $ are traded every day on foreign exchange markets.


