Market Data

March 29, 2015
Gross Domestic Product for Q4 2014, Third Estimate
Written by Peter Wright
The Bureau of Economic Analysis (BEA) released the third estimate of Q4 2014 Annual Revision of the National Income and Product Accounts on Friday.
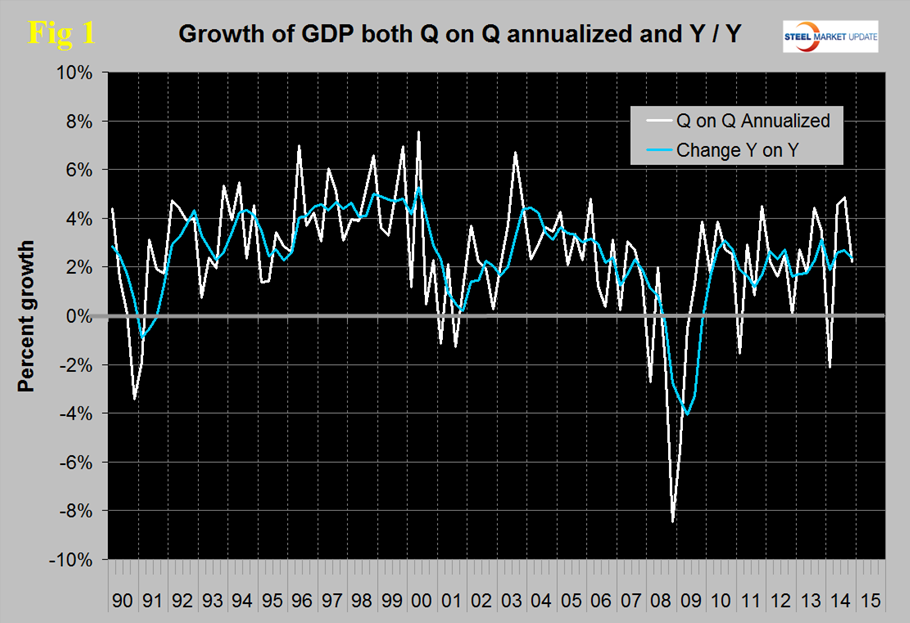
The annualized growth rate in the third estimate of 4th quarter GDP was unchanged from the second estimate which was 2.2 percent but down from the first estimate which was 2.64 percent. Growth in the Q4 was down from almost 5.0 percent in Q3 and from 4.59 in Q2. GDP is measured and reported in chained 2009 dollars and in Q4 was estimated to be $16.295 trillion. The calculation is slightly misleading because it takes the Q over Q growth and multiplies by 4 to get an annualized rate. This makes the high quarters higher and the low quarters lower. Figure 1 clearly shows this effect. The blue line is the trailing 12 months growth and the white line is the headline quarterly result.
On a year over year basis GDP was 2.38 percent higher in the 4th quarter than it was in Q4 2013 and that result is in line with performance since Mid-2010. Q1 of 2104 had negative 2.21 percent growth due to the appalling winter in the North East US and the 2nd and 3rd quarter results which were very strong were likely playing catch-up. The fact that Q4 was close to the year as a whole tends to support that view.
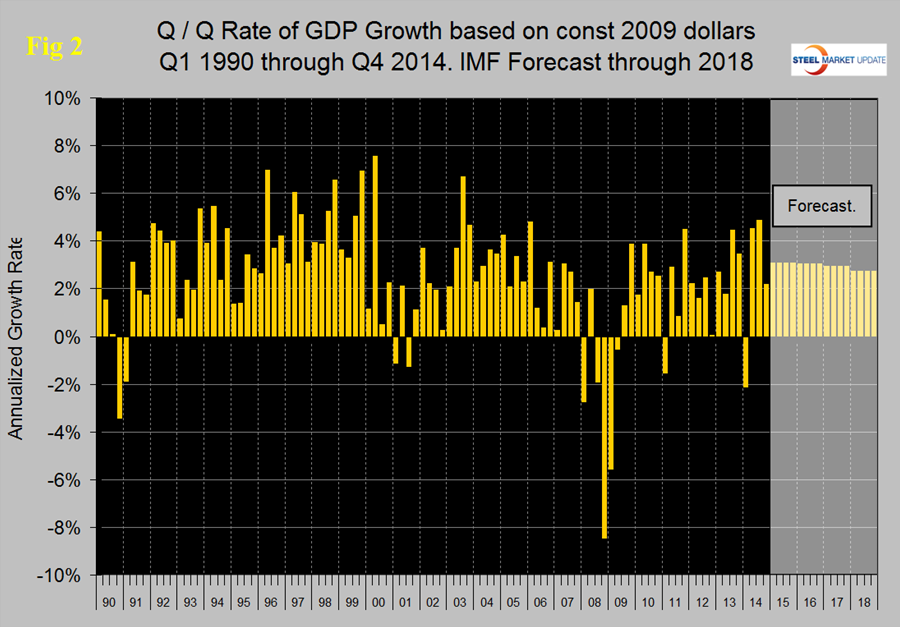
Figure 2 shows the headline quarterly results since 1990 and the latest IMF forecast through 2018. Taking 2014 as a whole makes the IMF forecast look reasonable with a quarterly growth rate of 3.09 percent forecast for 2015.
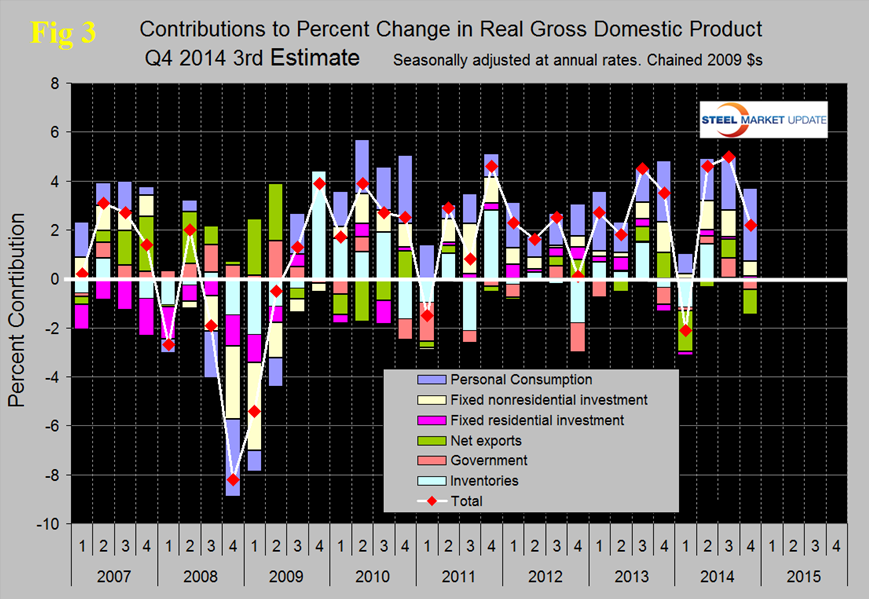
Figure 3 shows the change in the major sub-components of GDP. Comparing Q4 with Q3 there were major changes in the sub-components.
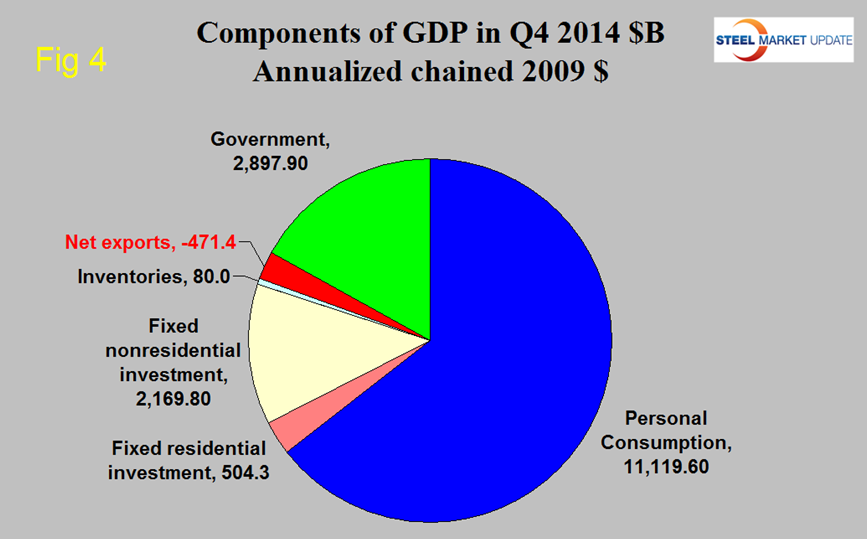
Personal consumption contributed 2.98 percent to the growth meaning that all other major components were slightly negative in total. Personal consumption includes goods and services, the goods portion of which includes both durable and non-durables. Presumably personal consumption is being driven by low gas prices. Net exports were the major negative and contributed – 1.03 percent to the total. This negative contribution can be expected to worsen as the US dollar strengthens. Government expenditures also yielded a negative growth of – 0.35 percent. The contribution of fixed residential investment was almost unchanged at 0.12 percent but the contribution of nonresidential construction declined from 1.1 percent in Q3 to 0.6 percent in Q4. In the 4th Q personal consumption accounted for 68.24 percent of total economic activity, up from 67.87 percent in Q3. Inventories which had contributed only 0.03 percent in Q3 contributed 0.1 percent in Q4. Increasing inventories make a positive contribution to GDP and over the long run inventory changes are a wash and simply move growth from one period to another. Figure 4 shows the breakdown of the $16 trillion economy.
This writer has most often been impressed by the quality of US Government economic statistics considering what a gigantic and complex task the economists undertake every month. Moves are afoot to continue to refine their product.
Washington March 4th — U.S. Secretary of Commerce Penny Pritzker today announced the members of the new Commerce Data Advisory Council (CDAC), who include 19 of the best and brightest private and public sector thought leaders on data management and dissemination in the United States. The Council will help guide the Commerce Department’s data revolution, which aims to foster innovation, help create jobs, and drive better decision-making throughout our economy and society. Commerce Department data inform decisions that help make government smarter, keep businesses more competitive and better inform citizens about their own communities – with the potential to guide up to $3.3 trillion in investments in the United States each year.
The official press release from the BEA reads as follows:
Real gross domestic product — the value of the production of goods and services in the United States, adjusted for price changes — increased at an annual rate of 2.2 percent in the fourth quarter of 2014, according to the “third” estimate released by the Bureau of Economic Analysis. In the third quarter, real GDP increased 5.0 percent.
The GDP estimate released today is based on more complete source data than were available for the “second” estimate issued last month. In the second estimate, the increase in real GDP was also 2.2 percent. While increases in exports and in personal consumption expenditures (PCE) were larger than previously estimated and the change in private inventories was smaller, GDP growth is unrevised, and the general picture of the economy for the fourth quarter remains the same
The increase in real GDP in the fourth quarter reflected positive contributions from PCE, nonresidential fixed investment, exports, state and local government spending, and residential fixed investment that were partly offset by negative contributions from federal government spending and private inventory investment. Imports, which are a subtraction in the calculation of GDP, increased.
The deceleration in real GDP growth in the fourth quarter primarily reflected an upturn in imports, a downturn in federal government spending, a deceleration in nonresidential fixed investment, and a larger decrease in private inventory investment that were partly offset by accelerations in PCE and in state and local government spending.
Real personal consumption expenditures increased 4.4 percent in the fourth quarter, compared with an increase of 3.2 percent in the third. Durable goods increased 6.2 percent, compared with an increase of 9.2 percent. Nondurable goods increased 4.1 percent, compared with an increase of 2.5 percent. Services increased 4.3 percent, compared with an increase of 2.5 percent.
Real nonresidential fixed investment increased 4.7 percent in the fourth quarter, compared with an increase of 8.9 percent in the third. Investment in nonresidential structures increased 5.9 percent, compared with an increase of 4.8 percent. Investment in equipment increased 0.6 percent, compared with an increase of 11.0 percent. Investment in intellectual property products increased 10.3 percent, compared with an increase of 8.8 percent. Real residential fixed investment increased 3.8 percent, compared with an increase of 3.2 percent.
Real exports of goods and services increased 4.5 percent in the fourth quarter, the same increase as in the third quarter. Real imports of goods and services increased 10.4 percent, in contrast to a decrease of 0.9 percent.
Real federal government consumption expenditures and gross investment decreased 7.3 percent in the fourth quarter, in contrast to an increase of 9.9 percent in the third. National defense decreased 12.2 percent, in contrast to an increase of 16.0 percent. Non-defense increased 1.5 percent, compared with an increase of 0.4 percent. Real state and local government consumption expenditures and gross investment increased 1.6 percent, compared with an increase of 1.1 percent.
The change in real private inventories subtracted 0.10 percentage point from the fourth-quarter change in real GDP after subtracting 0.03 percentage point from the third-quarter change. Private businesses increased inventories $80.0 billion in the fourth quarter, following increases of $82.2 billion in the third quarter and $84.8 billion in the second.
Real final sales of domestic product — GDP less change in private inventories — increased 2.3 percent in the fourth quarter, compared with an increase of 5.0 percent in the third.
SMU Comment: We have reported frequently in the past on the relationship between GDP and steel consumption. Steel growth follows economic growth but is very much more volatile. In addition over the long run about a 2.5 percent growth of GDP is necessary to get any growth in steel consumption. Based on the trailing 12 month growth of GDP which in Q4 was 2.38 percent we can expect steel consumption to be fairly stable in H1 2015. The IMF forecast for 2015 at 3.09 percent growth if accurate suggests a moderate increase in steel demand.


