Market Data

March 23, 2015
The Chicago Federal Reserve National Activity Index and Steel Supply
Written by Peter Wright
The following is the Chicago Federal Reserve statement followed by our own graphical analysis. The CFNAI is an excellent reality check for much of the economic analysis that we routinely provide at Steel Market Update. An explanation of the index is provided at the end of this piece.
This is normally an article reserved for our Premium level members but, we have chosen to share it with all of our readers. If you would like to learn more about Premium level membership please contact us at: info@SteelMarketUpdate.com.
![]() Index shows economic growth slowed again in February
Index shows economic growth slowed again in February
The Chicago Fed National Activity Index (CFNAI) edged lower to –0.11 in February from –0.10 in January. Two of the four broad categories of indicators that make up the index decreased from January, and two of the four categories made negative contributions to the index in February.
The index’s three-month moving average, CFNAI-MA3, declined to –0.08 in February from +0.26 in January. February’s CFNAI-MA3 suggests that growth in national economic activity was slightly below its historical trend. The economic growth reflected in this level of the CFNAI-MA3 suggests subdued inflationary pressure from economic activity over the coming year.
The CFNAI Diffusion Index, which is also a three-month moving average, decreased to a neutral reading in February from +0.10 in January. Forty-eight of the 85 individual indicators made positive contributions to the CFNAI in February, while 37 made negative contributions. Forty-six indicators improved from January to February, while 39 indicators deteriorated. Of the indicators that improved, ten made negative contributions.
Production-related indicators made a contribution of –0.07 to the CFNAI in February, up from –0.20 in January. Industrial production increased 0.1 percent in February after declining 0.3 percent in the previous month, and manufacturing production decreased 0.2 percent in February after declining 0.3 percent in January. The contribution of the sales, orders, and inventories category to the CFNAI ticked up to +0.02 in February from +0.01 in January.
Employment-related indicators contributed +0.11 to the CFNAI in February, down slightly from +0.16 in January. The unemployment rate decreased to 5.5 percent in February. However, civilian employment increased by 96,000 in February, following a gain of 759,000 in January; and average weekly initial unemployment insurance claims increased more in February than in the previous month.
The contribution of the personal consumption and housing category to the CFNAI decreased to –0.17 in February from –0.07 in January. Housing starts declined to 897,000 annualized units in February from 1,081,000 in the previous month. However, housing permits edged up to 1,092,000 annualized units in February from 1,060,000 in January.
The CFNAI was constructed using data available as of March 19, 2015. At that time, February data for 51 of the 85 indicators had been published. For all missing data, estimates were used in constructing the index. The January monthly index was revised to –0.10 from an initial estimate of +0.13. Revisions to the monthly index can be attributed to two main factors: revisions in previously published data and differences between the estimates of previously unavailable data and subsequently published data. The revision to the January monthly index was due primarily to the former.
Figure 1 shows our analysis of the 3MMA of the CFNAI through February. There has been an erratic though sustained improvement since mid-2012, this latest dip may be one of several since then.
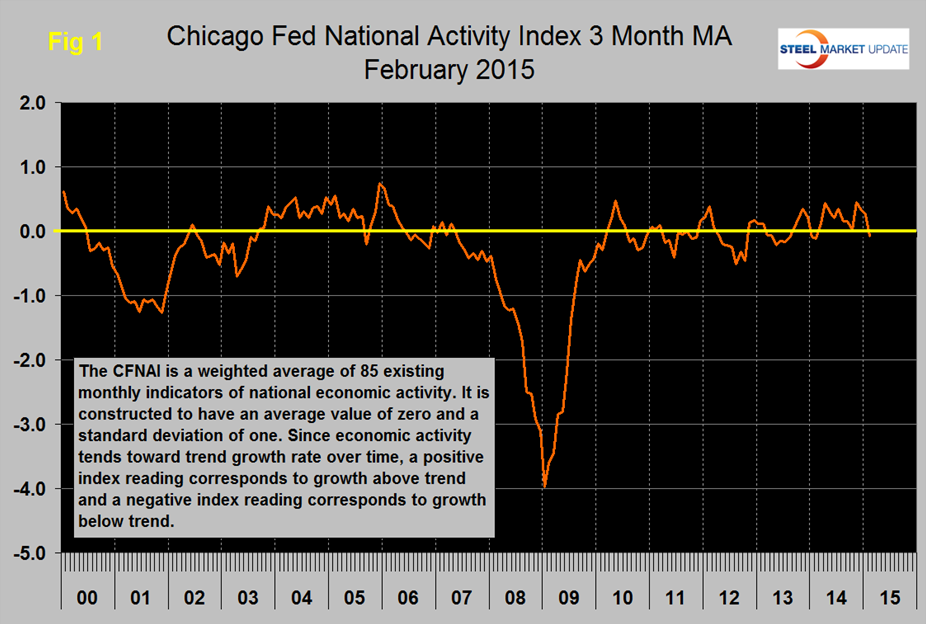
By this measure the economy is expanding at very slightly less than its historical trend which is represented by the zero line (see explanation below). The February result was negative 0.11 with a 3MMA of negative 0.08. Figure 2 shows the trends of the four main sub-components. The sub-component “Production and Income” gained strongly in November but gave up all of that gain and then some in the subsequent three months. Personal consumption and housing continue to be a drag.
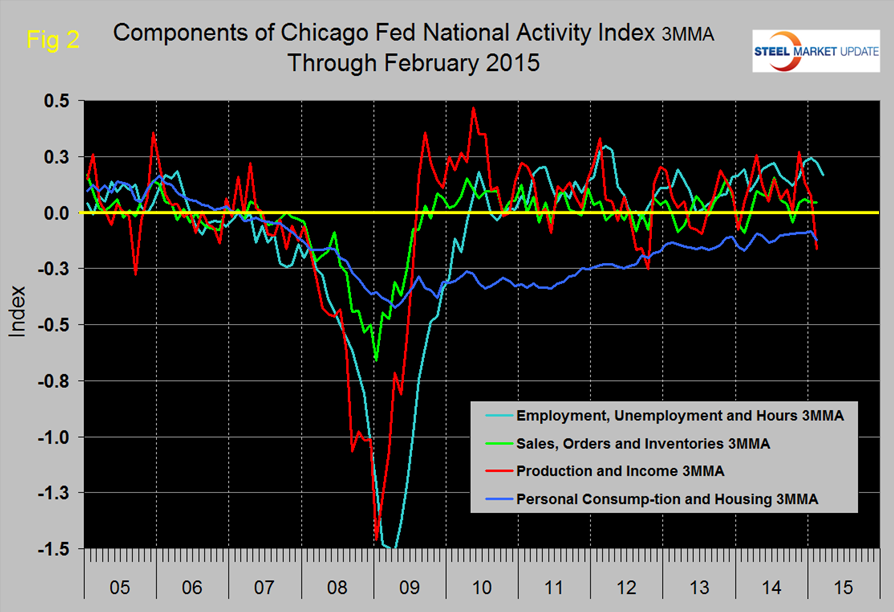
Figure 3 shows that the CFNAI has historically been a reasonably accurate leading indicator of steel demand (apparent supply) with a lead time of about six months.
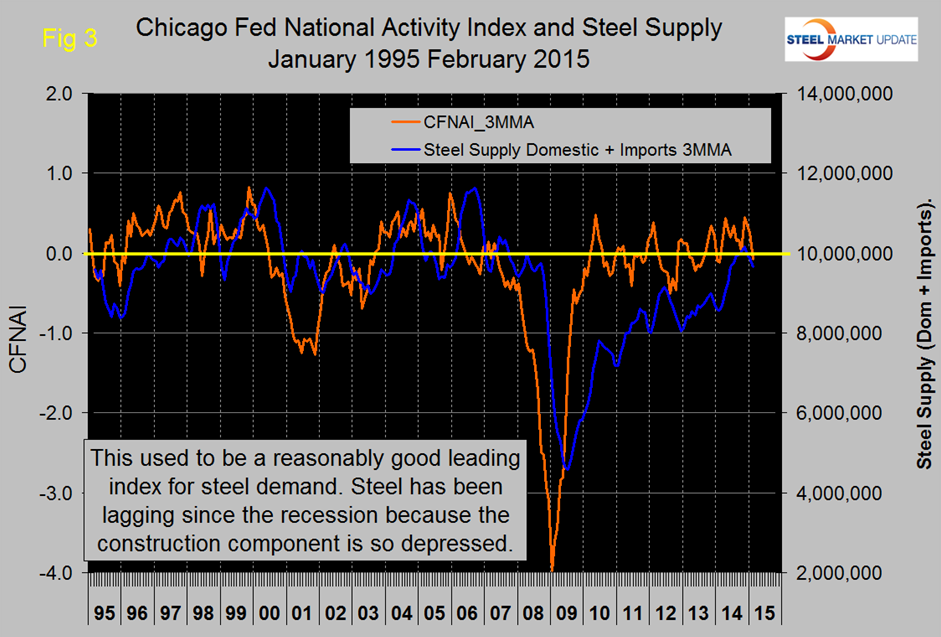
SMU monitors several benchmark indicators to evaluate whether steel consumption is where it should be based on historical patterns. This is the first of those benchmarks to suggest that steel has closed the gap that developed after the recession. We believe this delayed response to be a measure of the extent to which construction has been a drag on steel demand. The bad news as we have reported elsewhere is that imports have taken most or all of that improvement.
Explanation: The index is a weighted average of 85 indicators of national economic activity drawn from four broad categories of data: 1) production and income; 2) employment, unemployment, and hours; 3) personal consumption and housing; and 4) sales, orders, and inventories. A zero value for the index indicates that the national economy is expanding at its historical trend rate of growth; negative values indicate below-average growth; and positive values indicate above-average growth. When the CFNAI-MA3 (three month moving average) value moves below –0.70 following a period of economic expansion, there is an increasing likelihood that a recession has begun. Conversely, when the CFNAI-MA3 value moves above –0.70 following a period of economic contraction, there is an increasing likelihood that a recession has ended. When the CFNAI-MA3 value moves above /+0.70 more than two years into an economic expansion, there is an increasing likelihood that a period of sustained increasing inflation has begun.