Prices

March 17, 2015
March Steel Imports Trending Toward 3.8 to 4.0 Million Tons
Written by John Packard
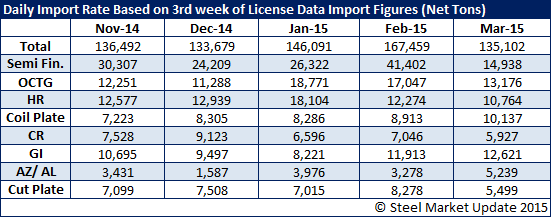
Every week the US Department of Commerce (US DOC) releases steel import license data for those months that have not had Preliminary Census or Final Census data announced. The latest license data was released this afternoon (Tuesday) covering the month of March through today (March 17, 2015). Steel Market Update (SMU) takes the license data and then compares it against what we have been seeing in prior months based on data from approximately the 17th of the month (3rd week of license data). From there we can build a trend analysis to project what we think imports for the total month of March will look like and, more importantly, if they are breaking the trend we have been seeing for imports over the past few months (which is close to 4 million net tons per month – a very high amount).
SMU Note: Please be advised that the US DOC releases the data in metric tons. Steel Market Update converts all of the data into net tons (2,000 pounds per 1 net ton).
Below is a table where we compare March 2015 against November, December, January and February. March is, at the moment, following similar levels as seen in November and December and is below January and February daily license tonnage requests. We are seeing a big drop in semi-finished (which is understandable with the weakening domestic mill order books) but higher levels in galvanized and Galvalume (coated steels).
With March being a 22 day month we are not yet seeing a break in the trend which has been building since last summer (2014). At the moment we believe March imports will come in around the February level of 3.8 million tons or, about the 12 month moving average. However, if the license requests continue at the current rate the data suggests March could be another 4 million net ton import month. In the table below we continue to see big numbers on OCTG (oil country tubular goods) which is amazing considering that market has collapsed over the past few months.
Coiled plate imports have also jumped and at the moment the data is trending (or suggesting) we could see coiled plate above 300,000 net tons instead of the more “normal” low 200,000 ton level.
Cold rolled is trending lower while galvanized and Galvalume are moving higher (as mentioned above).
Steel Market Update will continue to probe these numbers further and next week when the new license data is released we will concentrate on who the culprit (countries) are responsible for the increasing coated numbers.
A note to our Premium level members: We have published the most recent Imports by Product, Port and Country data in our website.


