Prices

March 12, 2015
Net Imports of Sheet Products through January 2015
Written by Peter Wright
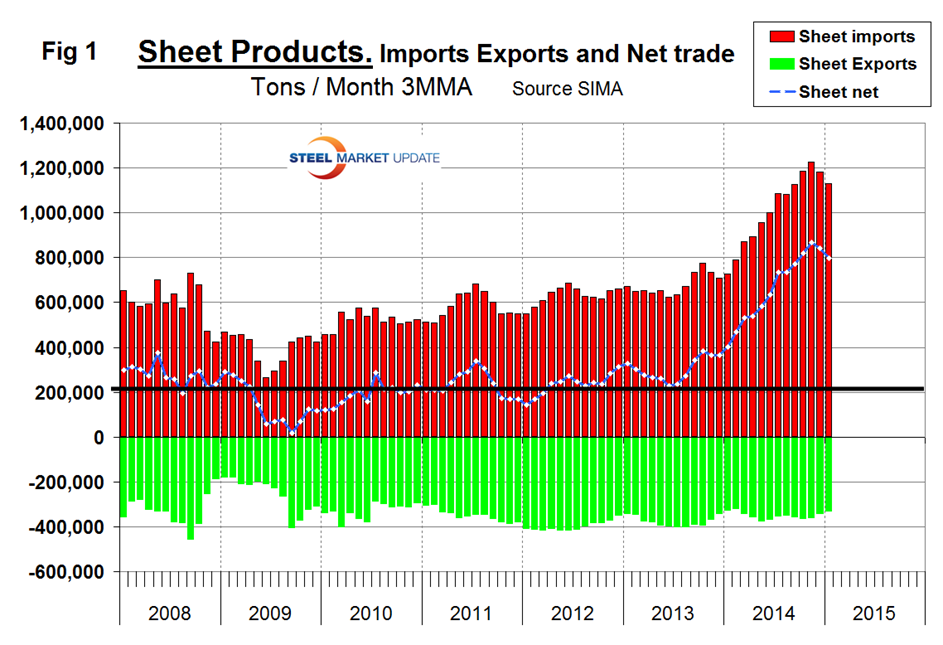
Net imports equals imports minus exports. We regard this as an important look at the overall trade picture and its effect on demand at the mill level. Figure 1 shows that net sheet product imports on a three month moving average (3MMA) basis in January were almost double that which existed before the recession.
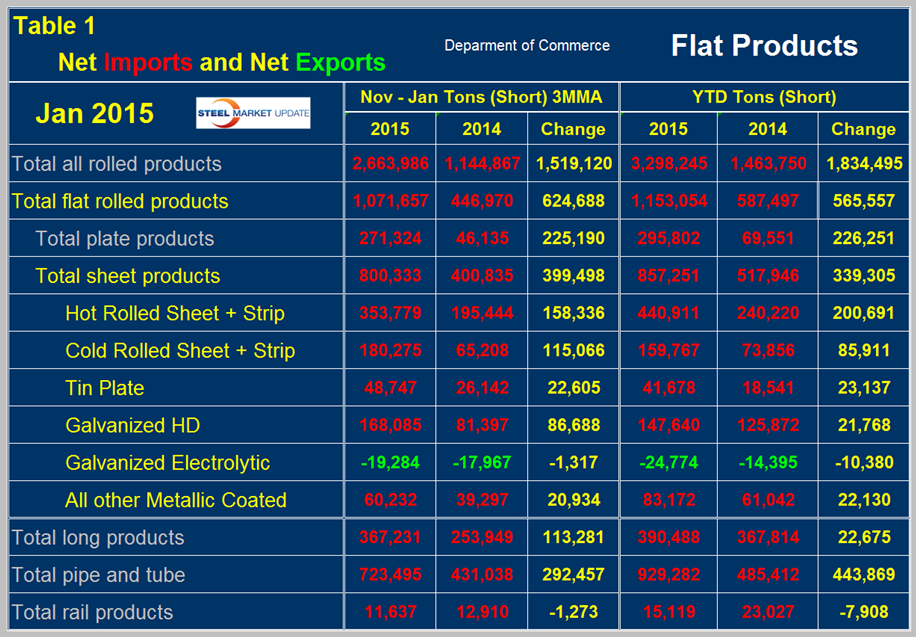
The deterioration in net was almost entirely an import effect, exports have been fairly consistent though drifting down slightly since Q2 2012. Table 1 shows net imports by product.
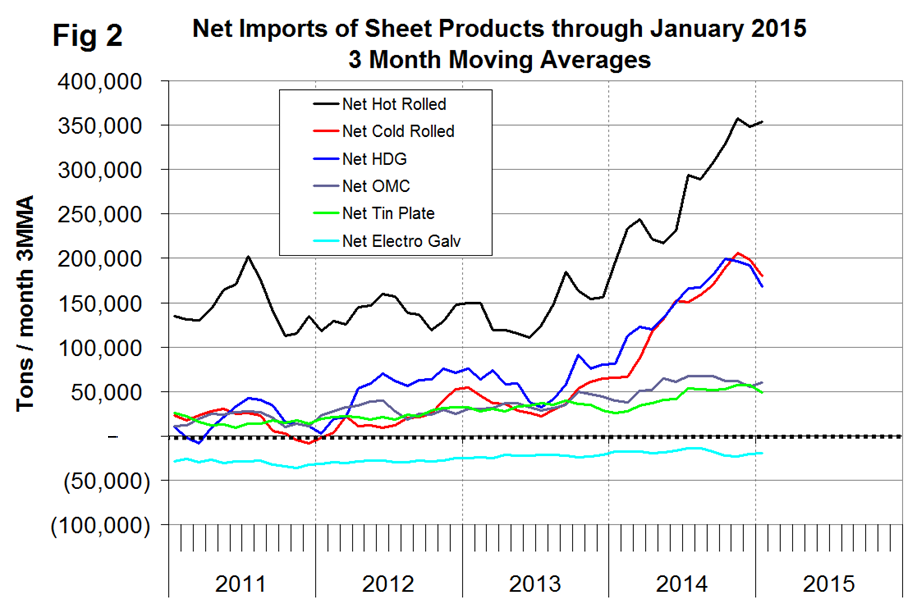
Year to date through January (one month only), total net flat rolled imports were 1,153,054 tons, of which 857,251 tons were sheet products. On a three month moving average basis, (3MMA), November through January net sheet imports increased by 399,498 tons year over year. The 3MMA of net imports increased on all products except electro-galvanized and rail which were down slightly. Electro-galvanized was the only product to have a trade surplus in 2013 and 2014 and this continued into 2015. In Table 1 negative net imports, (which means a trade surplus) are shown in green. Figure 2 shows the trend of monthly net sheet product imports since January 2011 on a 3MMA basis. Cold rolled and HDG have both decreased in the last two months but hot band after declining in December picked back up in January. The trade surplus of electro-galvanized has been steadily increasing for over three years.
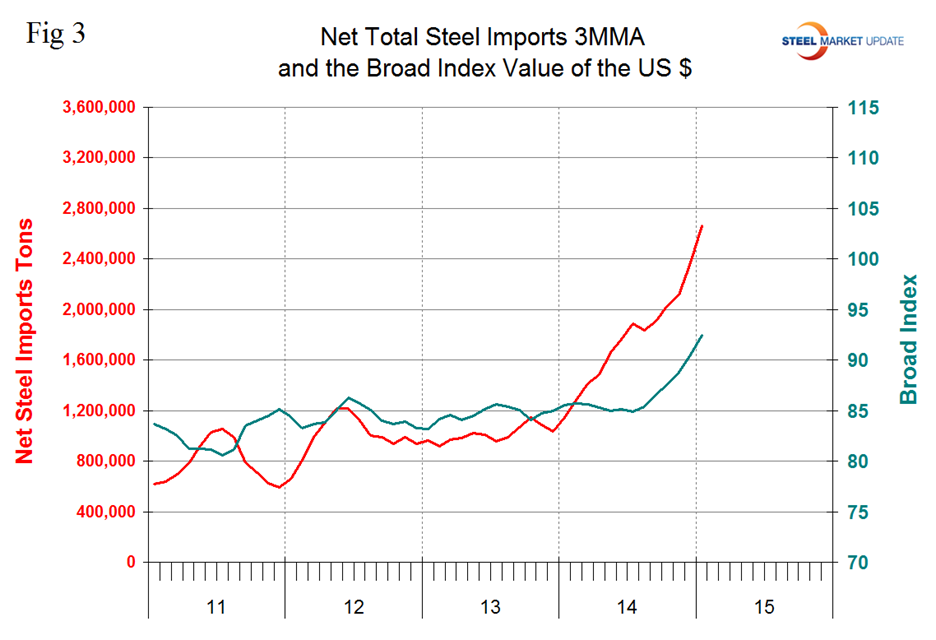
We believe there are two main drivers of the increase in net steel imports. The trade weighted value of the US $ is strengthening which makes our exports less attractive to foreign buyers and makes the US domestic market more attractive to foreign sellers. Figure 3 shows the relationship between net imports and the value of the $ since January 2011.
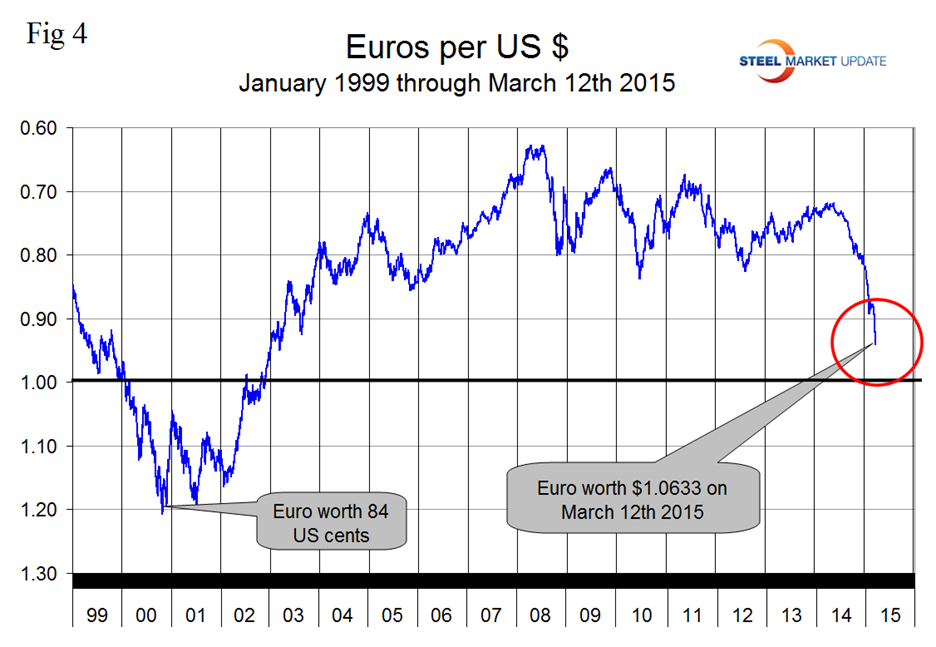
The strengthening of the dollar is not expected to slow in the immediate future and in fact will probably accelerate as more nations ease monetary policy and the Fed raises interest rates later in 2015. Of particular concern is the decline of the Euro vs the US $ (Figure 4).
The accelerating decline is a result of the ECB’s quantitative easing program of bond purchases that began on Monday. Parity in the very near future now looks like a probability. The second reason is that steel demand in the US is strong at the same time as global demand growth has flattened. The global economy was recently described by Larry Somers as flying on one engine, that being the US. This is exactly what happened in the late 1990s after the Far Eastern currency crash which was followed by a decline in the Euro to below parity with the US dollar. In the period November 2014 through January 2015, the growth of global steel production was only 0.2 percent year over year. As global steel capacity has increased, capacity utilization has decreased and now stands at 72.9 percent. Declining steel demand abroad, strong demand in the US and a skyrocketing US dollar is not a pretty picture for the US steel industry for at least the balance of 2015.


