Market Data

March 10, 2015
Shipments and Supply of Sheet Products through January 2015
Written by Peter Wright
The following article is usually available to our Premium level members only. This report compares domestic mill shipments and total supply to the market in one single report to enable a side by side comparison and the degree to which imports have absorbed demand. Sources are the American Iron and Steel Institute and the Department of Commerce with analysis by SMU. Table 1 shows both supply and mill shipments (shipments includes exports) side by side as a three month average for the periods November 2014 through January 2015 and November 2013 through January 2014.
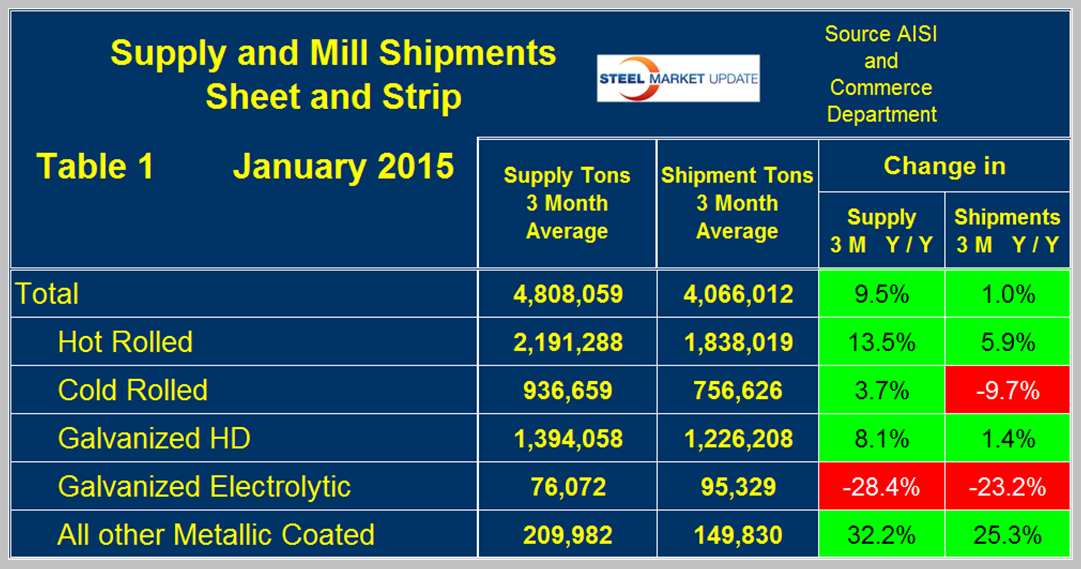
Comparing these two year over year periods total supply to the market was up by 9.5 percent as mill shipments were up by only 1.0 percent. In other words, imports took the majority of the market expansion. This situation was particularly acute for cold rolled where supply up by 3.7 percent but mill shipments were down by 9.7 percent. February licenses showed that imports declined by 13.4 percent from January but the 3MMA was up by 41.7 percent year over year. For hot band, supply was up by 13.5 percent as shipments increased by 5.9 percent. At first glance the numbers for electro-galvanized look strange with supply being less than shipments. This is because EG still has a positive trade balance where exports exceed imports. Both supply and shipments of EG are down significantly from the same period a year ago. Supply and shipments were up strongly for other metallic coated products, (mainly Galvalume) as domestic mill shipments increased by 25.3 percent and supply increased by 32.2 percent. Now we will review supply and shipments separately for individual sheet products.
Apparent Supply is a proxy for market demand and is defined as domestic mill shipments to domestic locations plus imports. In the three months November through January 2015 average monthly supply of sheet and strip was 4,808,059 tons, down by 6.2 percent from the previous three month period, August through October 2014 but up by 9.5 percent year over year. Table 2 shows the change in supply by product on the same basis plus YTD which at the moment only includes January. All individual products except Galvalume declined in three months through January compared to three months through October.
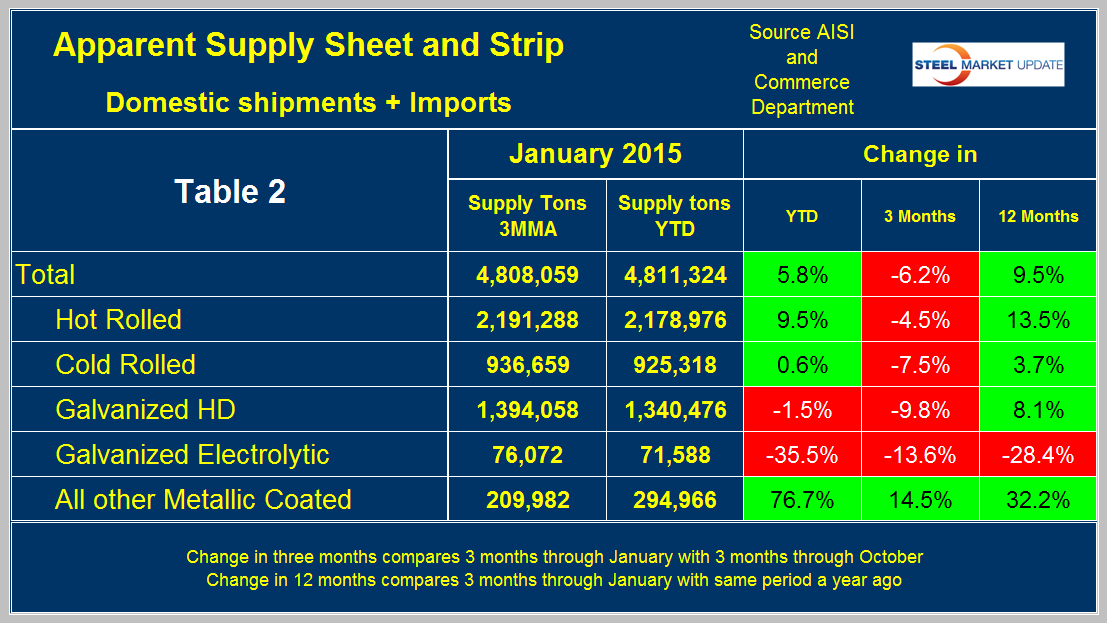
Figure 1 shows the long term supply picture for the three major sheet and strip products, HR, CR and HDG since January 2006. All three products declined in January after being in higher demand in late last year than at any time since the recession. Hot band was range bound for 2.5 years until April 2014 when it broke out and advanced through October followed by a small decline in November and December and a more rapid decline in January. Cold rolled supply fell below a million tons to 977,452 tons in December (3MMA) after being above that threshold for six of the previous seven months and continued to decline in January. Prior to this recent past the last time cold rolled exceeded a million tons was in October 2008 as we prepared to go over the cliff. Hot dipped galvanized had a strong bump in H1 2012, declined in H2 2012 and steadily improved for 22 months with a small decline in November and December and a more rapid decline in January. In three months through January the supply of HDG averaged 1,394,058 tons per month.
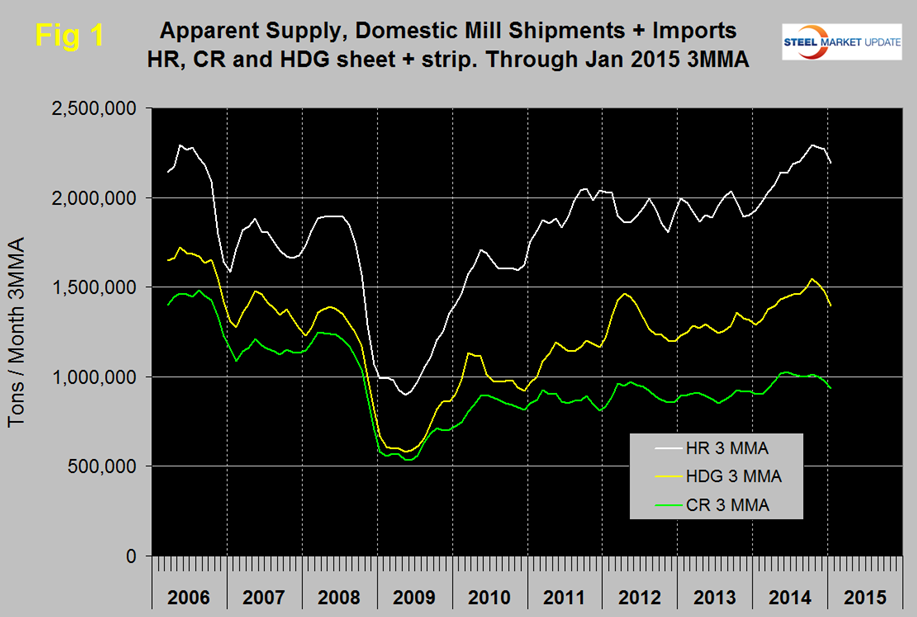
Figure 2 shows import market share of all steel products including semi-finished. There have been only three periods since 2003 when the domestic mills have commanded less than 70 percent of the market and of those three periods the current one is the most sustained.

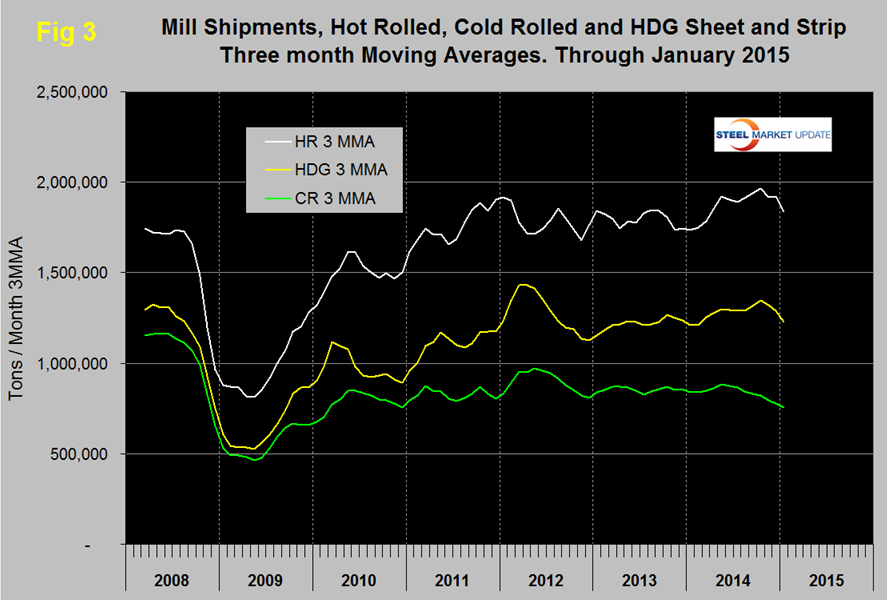
Mill Shipments: Table 3 shows that total shipments of sheet and strip products including hot rolled, cold rolled and all coated products were up by 1.0 percent in three months through January year over year but down by 6.9 percent comparing three months through January with three months through October.
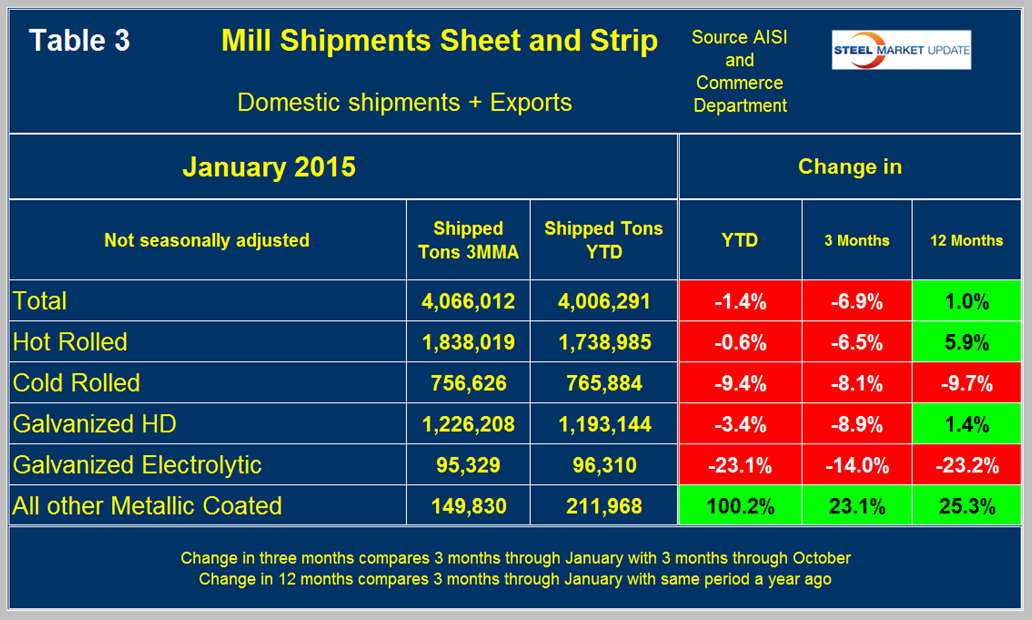
All products except Galvalume were down in the three month over three month comparison. Mill shipments of other metallic coated products (mainly Galvalume), had a huge surge in the single month of January with a simultaneous surge in imports. Figure 3 shows the shipment situation by product since January 2008. All three of the major product groups declined in December and January.