Market Data

March 2, 2015
Currency Update for Steel Trading Nations
Written by Peter Wright
The monthly value of the Federal Reserve Broad Index value of the US $ against our major trading partners has continued to strengthen and in January reached 92.44 after breaking 90 in December for the first time since July 2009. The monthly BI is a “Real” inflation adjusted index. The Fed also reports a daily nominal (non-inflation adjusted) index.
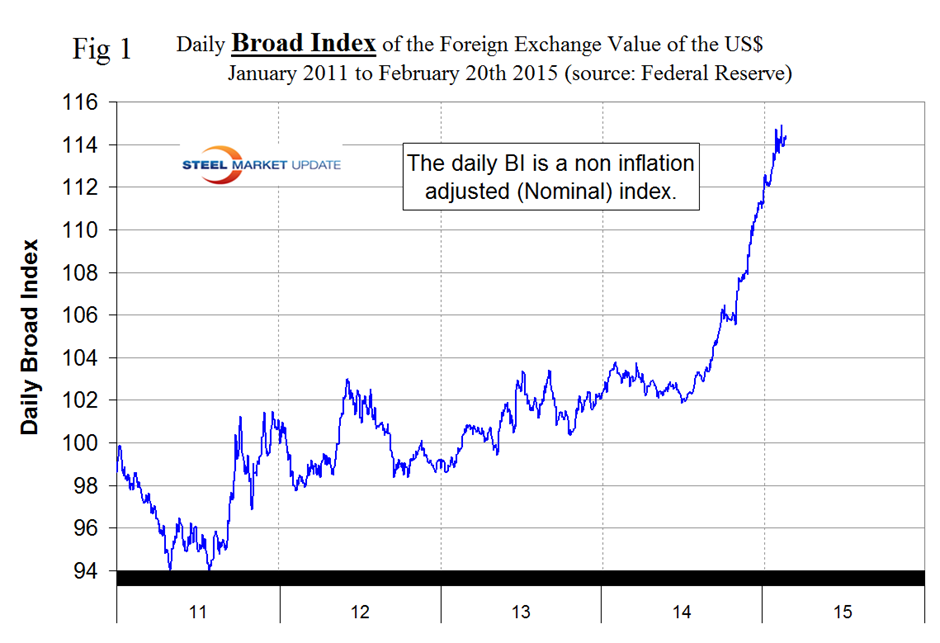
![]() On February 3rd 2014, the value for the daily index was 103.803, the index then weakened and briefly broke through 102 on July 1st, and by February 20th this year (the last date published by the Fed) had risen to 114.42. In the first 20 days of February the index was fluctuating in a fairly narrow range. Figure 1 shows the nominal daily index through February 20th. The dollar strengthened by 4.6 percent in 3 months, by 1.3 percent in 1 month and by 0.4 percent in 7 days, all through the 20th.
On February 3rd 2014, the value for the daily index was 103.803, the index then weakened and briefly broke through 102 on July 1st, and by February 20th this year (the last date published by the Fed) had risen to 114.42. In the first 20 days of February the index was fluctuating in a fairly narrow range. Figure 1 shows the nominal daily index through February 20th. The dollar strengthened by 4.6 percent in 3 months, by 1.3 percent in 1 month and by 0.4 percent in 7 days, all through the 20th.
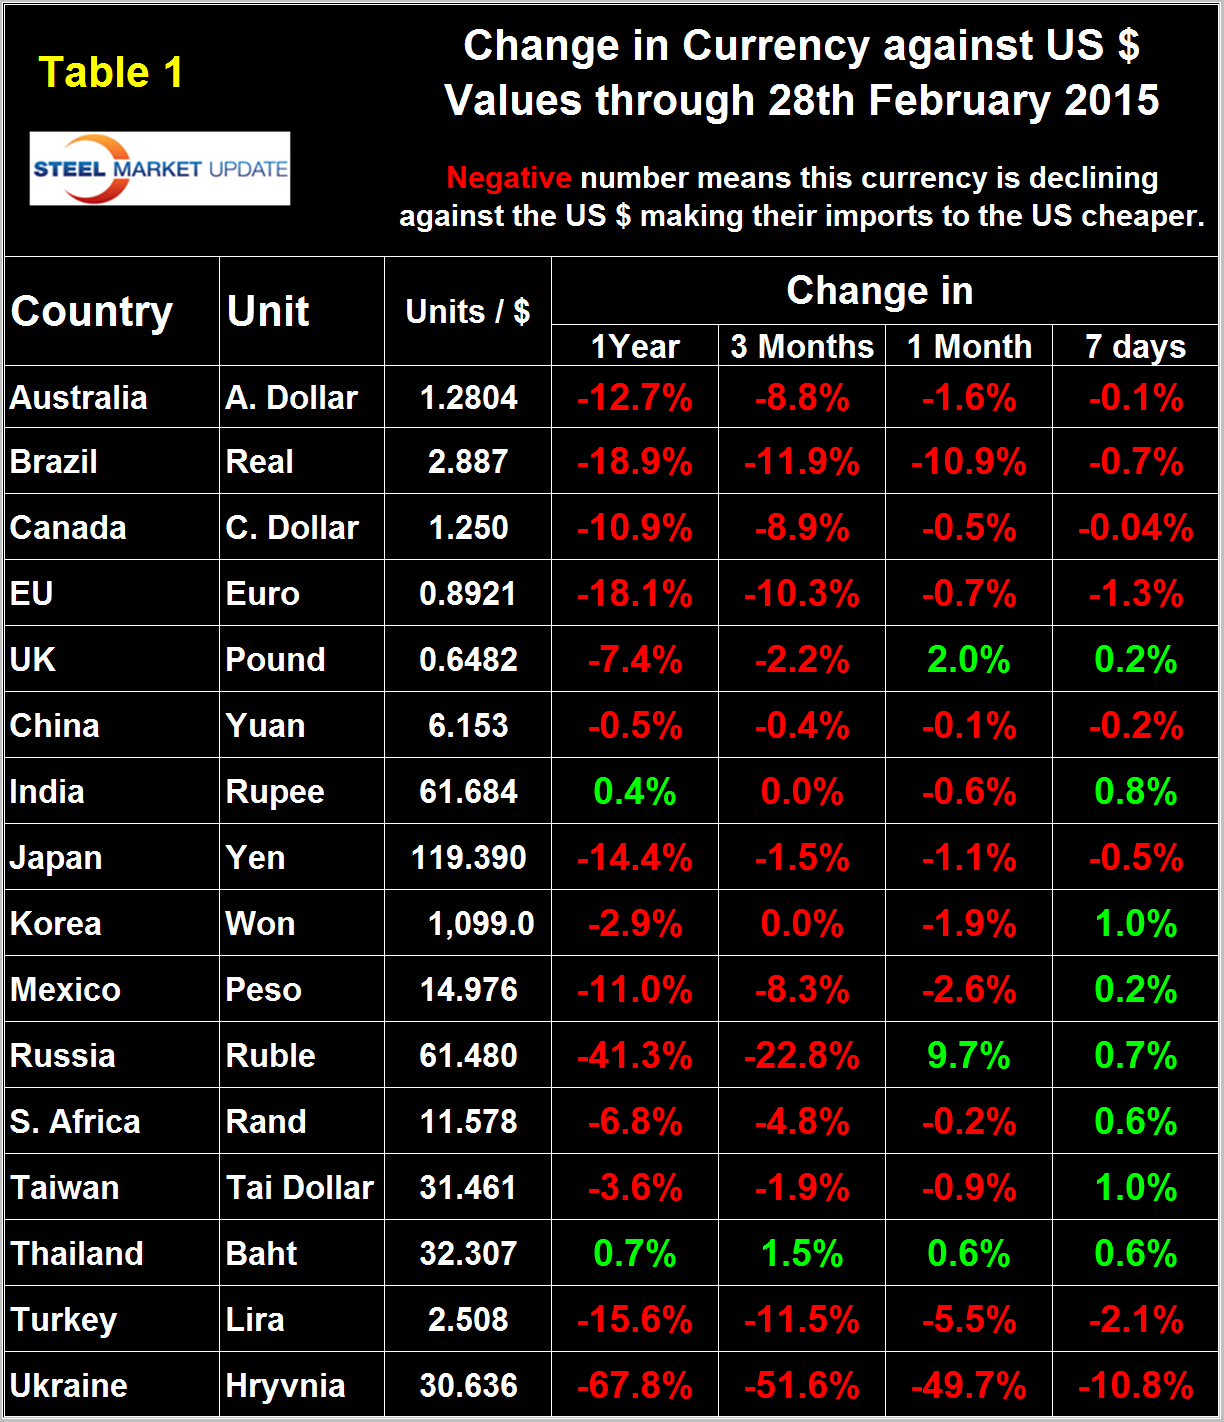
It does not necessarily follow that the currencies of the steel trading nations follow the Broad Index and in fact in the last seven days through February 28th the dollar has weakened against 8 of the 16 steel trading currencies that we routinely analyze at SMU. Table 1 shows the number of currency units of steel trading nations that it takes to buy one US dollar and the change in one year, three months, one month and seven days. Negative values for change indicate that the dollar is strengthening against a particular currency. An explanation of the source data is given at the end of this piece. In the last twelve months the dollar has strengthened against 14 of the 16 steel trading currencies and in the last three months has strengthened against 15 of them. In the last month the dollar has strengthened against 13. Table 1 is color coded to indicate strengthening of the dollar in red and weakening in green. We regard strengthening of the US Dollar as negative and weakening as positive because the effect on net imports.
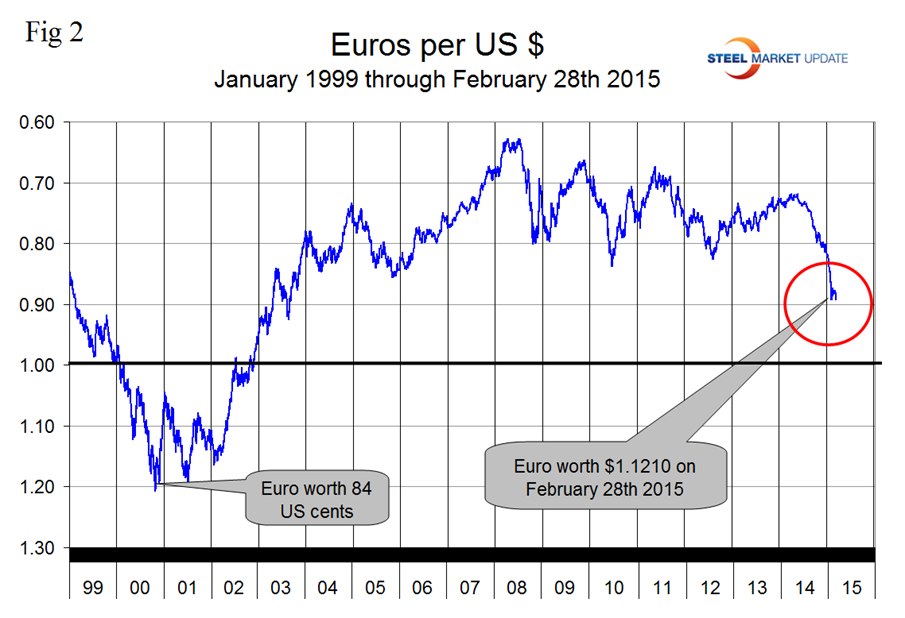
At SMU we continue to regard the saga of the Euro as having the most obvious and significant future impact on the US steel industry. On September 6th last year the Euro broke through the 1.3 US $ / Euro level for the first time since July 11th 2013 and by January 15th 2015 had depreciated to a value of 1.121 US dollars, its lowest value since May 1st 2003. Since then the Euro has oscillated with a high of 1.145 on February 5th only to settle back at 1.121 on February 28th (Figure 2). A devalued Euro means that US exports will be more expensive in Europe and European imports will be cheaper here. This is particularly true for steel trade. In addition European scrap will be more attractive to Turkish buyers than supplies from the US which will put downward pressure on domestic scrap prices.
From Stratfor February 24th: Germany has once again become the victim of its own power. As Europe’s largest creditor, it has considerable political leverage over debtor nations such as Greece. However, Germany is exporting more than half of its GDP, and most of those exports are consumed within Europe. Thus, the institutions Germany relies on to protect its export markets are the very institutions Berlin must battle to protect Germany’s national wealth.
From BBC World News Feb 27th. Eurozone finance ministers on Tuesday approved a set of reform proposals submitted by Greece. As the dominant economic power in the EU, Germany’s approval was regarded as crucial – and on Friday the majority of MPs granted it. German legislators felt they had no choice but to pass the vote, as a Eurozone breakup could prove even more expensive than the bailouts and potentially undermine the credibility of the euro. In the meantime Greece has to repay several billion euros in maturing debts, including about 2bn euros to the IMF in March, and 6.7bn in European Central Bank bonds maturing in July and August.
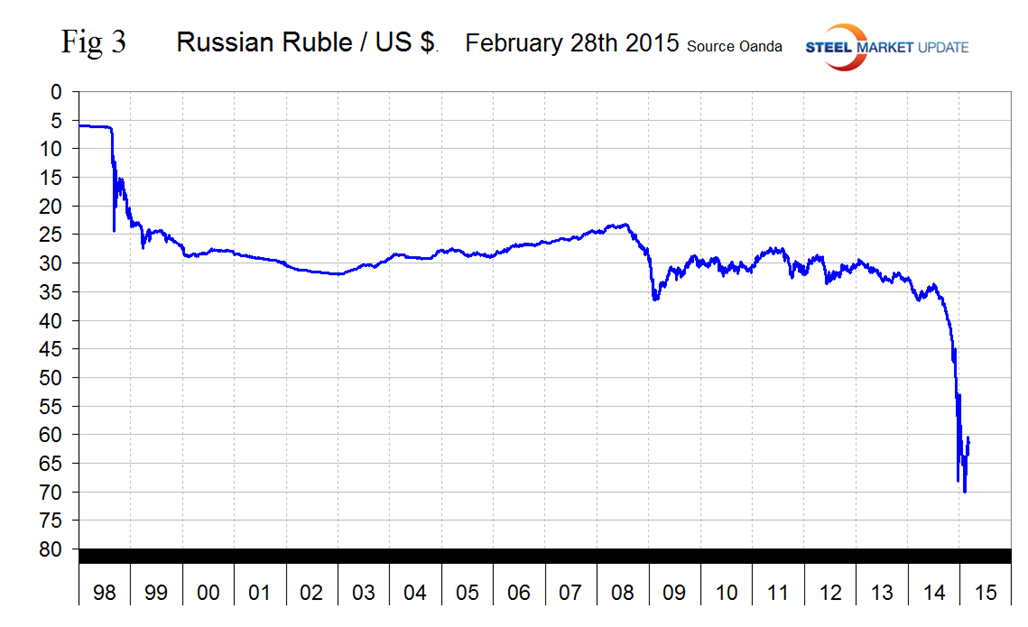
The Russian Ruble declined to slightly less than 70 to the US $ on February 1st but has since bounced back to 61.48 (Figure 3).
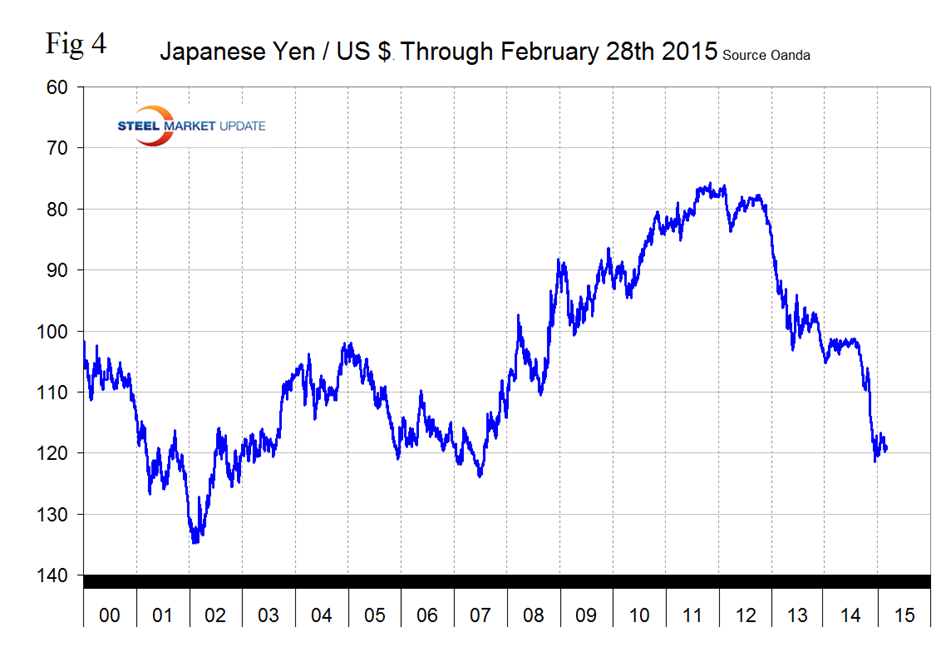
The Japanese Yen broke through the 120 level on December 6th before rallying slightly and has been flirting with that level ever since closing at 119.39 on February 28th (Figure 4). It looks as though central bank intervention has had some success in breaking the Yen’s fall. Depreciation against the dollar has been 14.4 percent in 12 months, 1.5 percent in 3 months and 1.1 percent the last thirty days.
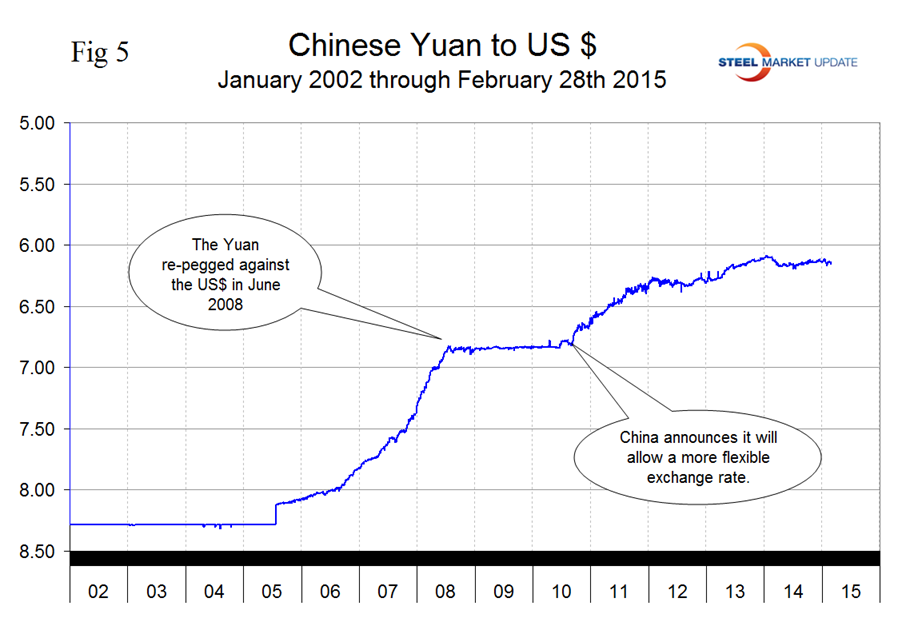
The Chinese Yuan closed at 6.1527 on February 28th with very little change in the last year (Figure 5).
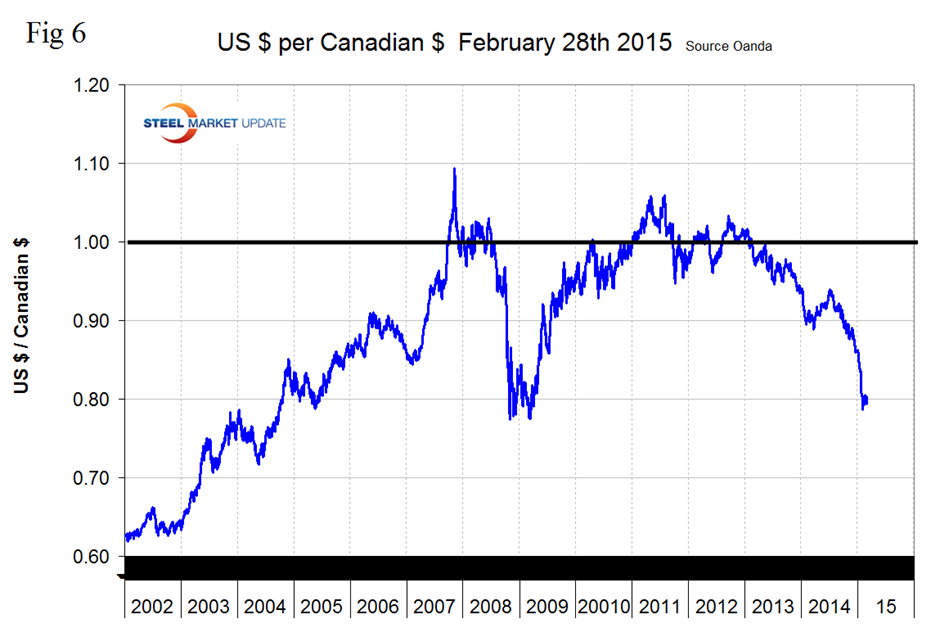
After trading in the mid to low 90 cent region for most of last year the Canadian dollar crashed through 80 cents on January 29th then stabilized and stood at 80.03 cents on February 28th. The decline had accelerated from the middle of last year through January. The Canadian $ has declined by 10.9 percent in the last twelve months, 8.9 percent in three months, 0.5 percent in one month and has been flat for the last seven days (Figure 6).
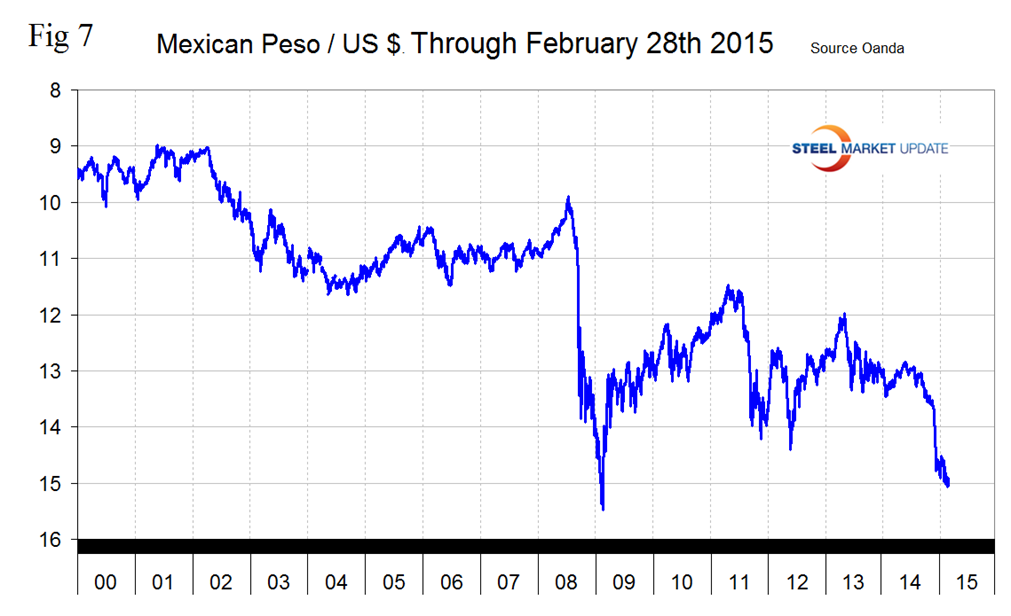
The Mexican Peso broke through 15 to the US Dollar on February 12th and has hovered around that value for the remainder of the month closing at 14.9761 on the 28th. The peso was down by 8.32 percent in 3 months, 2.6 percent in one month, and recovered by 0.2 percent in the last 7 days (Figure 7). The Peso is weaker than at any time since early 2009 which has severe implications for the distribution of manufacturing within NAFTA.
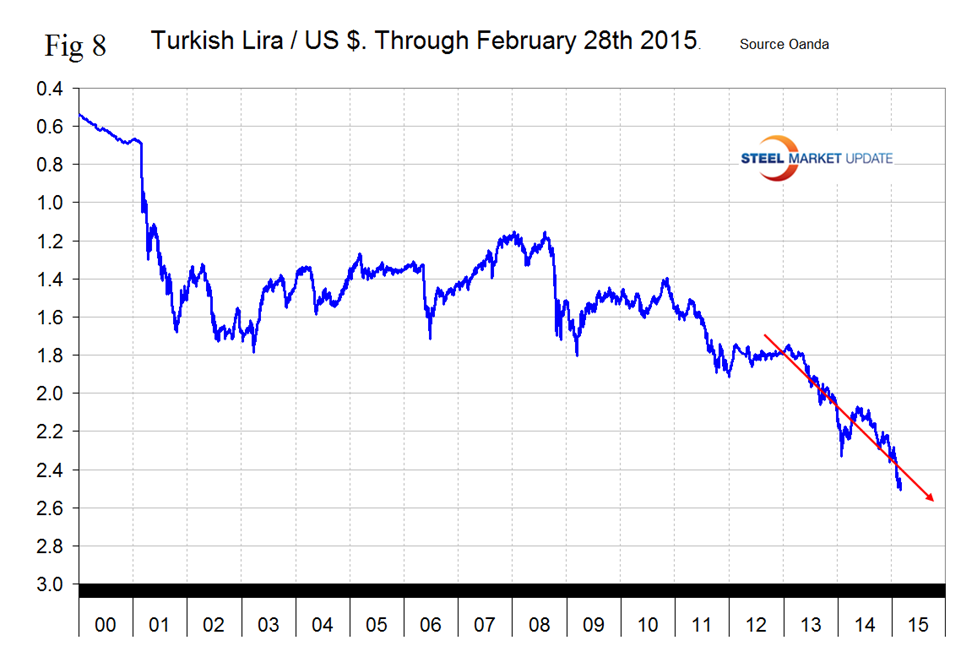
The Turkish Lira broke through 2.4 to the dollar on January 30th and through 2.5 for the first time today, (February 28th), another all-time low. The Lira has declined by 15.6 percent in the last year and by 2.1 percent in the last week (Figure 8). The US position as a scrap supplier to Turkey has deteriorated strongly as the Dollar has strengthened against the Lira by more than it has against the Euro or the British Pound.
SMU Comment: There was a slight relief in the last 7 days as the rise of the dollar slowed against a composite of the 16 steel trading currencies. Nevertheless longer term trends are not good for US steel producer competitiveness and will continue to attract imports and suppress both exports and raw materials prices. In this analysis we report on the currencies that we think have the most immediate significance, but all 16 steel trading nation graphs are available on request if any reader has a special interest that we haven’t covered.
Explanation of Data Sources: The Broad Index is published by the Federal Reserve on both a daily and monthly basis. It is a weighted average of the foreign exchange values of the U.S. dollar against the currencies of a large group of major U.S. trading partners. The index weights, which change over time, are derived from U.S. export shares and from U.S. and foreign import shares. The data are noon buying rates in New York for cable transfers payable in the listed currencies. At SMU we use the historical exchange rates published in the Oanda Forex trading platform to track the currency value of the US $ against that of sixteen steel trading nations. Oanda operates within the guidelines of six major regulatory authorities around the world and provides access to over 70 currency pairs. Approximately $4 trillion US $ are traded every day on foreign exchange markets.


