Prices

February 25, 2015
Global Steel Production and Capacity Utilization in January 2015
Written by Peter Wright
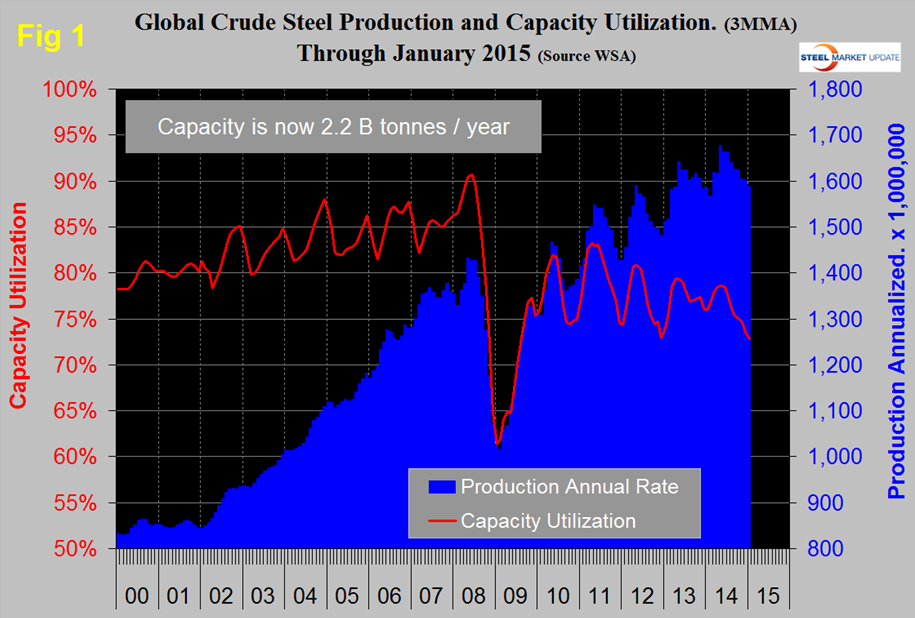
Global steel production in 2014 totaled 1.627 billion tonnes with a capacity of 2.2 billion tonnes which yields an average utilization for the year of 74 percent. China accounted for 51 percent of global production in 2014. Asia as a whole, including India, accounted for almost 70 percent of global production. Production in January on a tons per day basis was 4.294 million tonnes and has been declining for seven months since June. Total January production was 133.1 million tonnes.
If we look at the three month moving average and plot it over time we see that there has been a significant decline in the second half of the year since and including 2010 which sometimes extends into January and February (Figure 1).
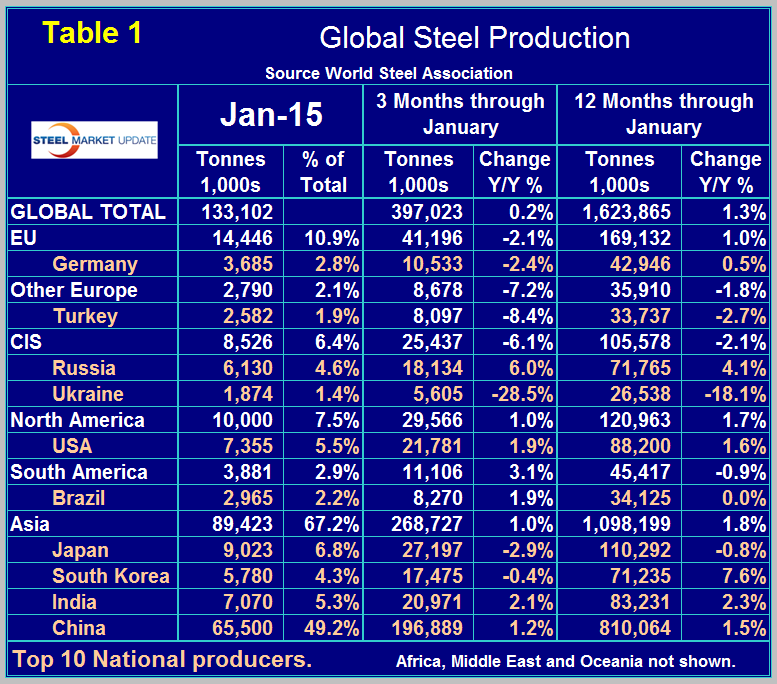
As production has increased each year since the recession, capacity utilization has decreased, the gap is widening. Much has been written about China’s desire to close up to 100 million tons of old environmentally unfriendly capacity and there was a recent report that 31 million tonnes had been closed. Table 1 shows global production broken down into regions and also the production of the top ten nations in the single month of January and their share of the global total. It also shows three months production through January and twelve months through January with year over year growth rates for each. Regions are shown in white font and individual nations in beige.
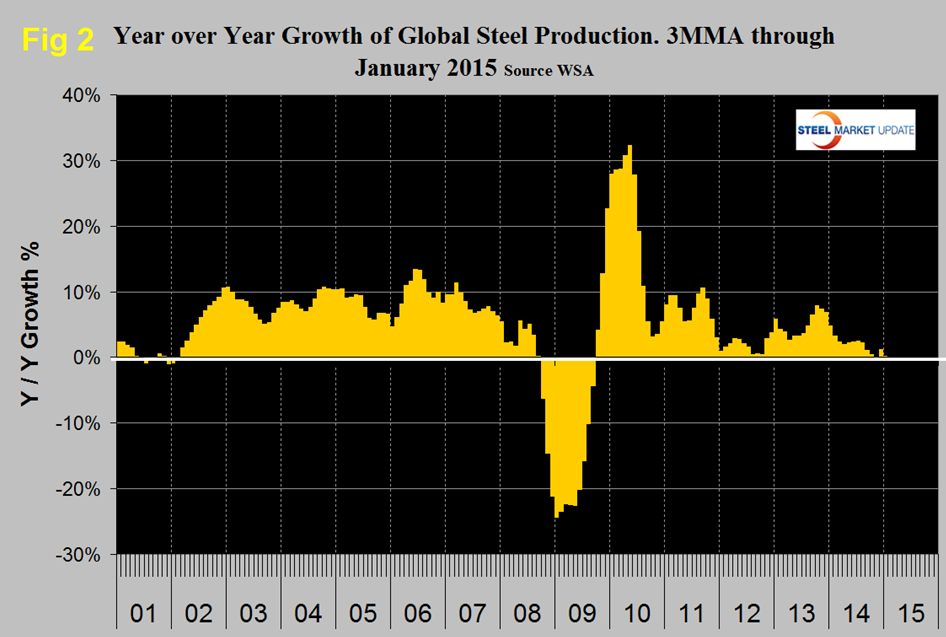
If the three month growth rate exceeds the twelve month we interpret this to be a sign of positive momentum and accelerating growth. The reverse is the case today. In three months through November y/y global growth declined to exactly zero, in three months through December it bounced back to 1.1 percent and in three months through January declined again to 0.2 percent. The growth rate in twelve months through January 2015 was 1.3 percent compared to all of 2013 which was up by 7.0 percent from 2012. In the three months through January there were significant differences in regional year over year growth. Europe and the CIS both contracted, North America eked out a 1.0 percent growth with the US achieving 1.9 percent, South America grew by 3.1 percent and Asia by 1.0 percent. South Korea which through the first ten months of 2014 had the fastest growth rate in the world contracted at a 0.4 percent rate in three months through January. China’s grew 1.2 percent in three months through January compared to 1.5 percent in twelve months suggesting a slight slowing. Japan had a negative 2.1 percent growth in Q4 and negative 2.9 percent in the last three months. The effect of the war in Ukraine is clear in the contraction of that country’s steel production. Figure 2 shows the 3MMA of the monthly year over year growth of global steel production which prior to December had been falling for six months.
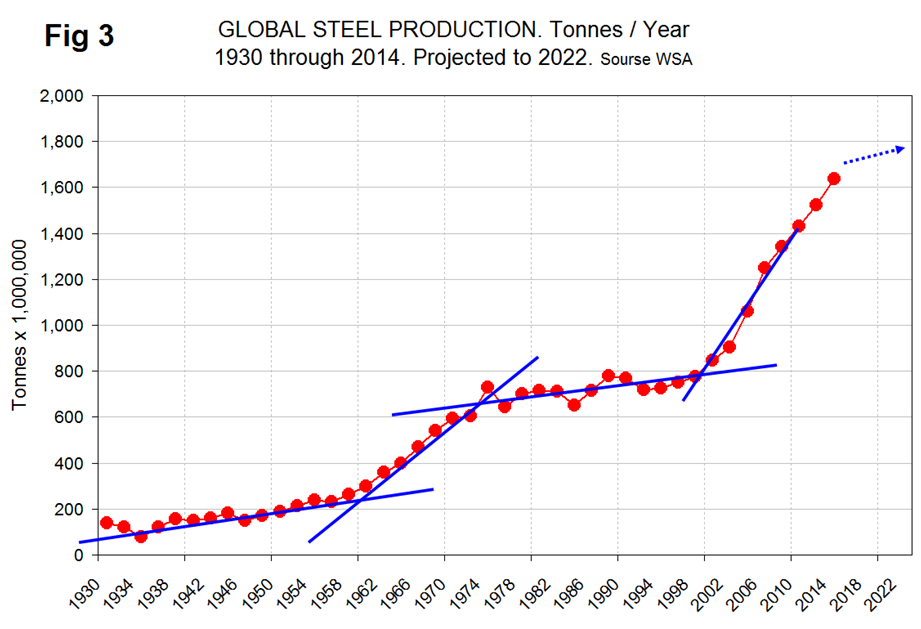
Growth in January was so low as not to make a blip on this chart. The recent decline in the price of oil, of iron ore and of the Baltic Index suggests that the global economy is weakening. Certainly there is a supply side to all three of those measures but it seems that demand is also down and suggests a further slowdown in global steel production in 2015. Since 1930 there have been four phases of growth in the global production of steel (Figure 3). It may be that we are now entering the 5th phase with slower growth for an extended period of time.
On February 3rd Sandy Lighthouse published the following macroeconomic view of the global economy which we think is credible and which has implications for the growth of global steel production in the next decade:
“The economies of all the nations of the world are more inter-linked than they have ever been before – nothing happens in isolation. First I will state my opinion of where we have been, then where we may be headed. For at least the last seventy years the US economy has been the big dog of the world’s economies. Whatever happened here pretty much dictated what happened in other modern western economies as well as third world economies. This is still true today. Demographic trends have been and will continue to be favorable for the US, largely because of immigration. There will be demographic bumps, such as the retirement of the baby boomers, but the longer trend is still positive.
While China has emerged as a major economic power, it is highly dependent on American markets to consume what it produces. China has a powerful economic pull over many countries that supply it raw materials. Demographic trends have been favorable for China up until now, but will start to deteriorate in several years. China has paid a huge environmental price for its industrialization. The US effectively exported the pollution costs of modern society to China, which is now at a breaking point.
Japan’s economy has been stagnant for the last thirty years, largely as a result of demographics, which will continue to deteriorate going forward.
Europe’s demographics have and will continue to dictate a stagnant economy. Socialist policy in Europe is also a major headwind for economic growth.
Third world economies are largely based on resource extraction and cheap labor. They are completely at the mercy of the US, Europe, and China.
Starting in about 1983, interest rates began a long term decline in the US (with the world as a whole following) that culminated in a massive worldwide credit bubble that popped in 2008. Also beginning in the early 1980s, the information age – tech revolution got under way, culminating in the invention and worldwide deployment of the internet. I believe the information age represents one of the last steps of the industrial revolution that began in the mid-1800s, and kicked into high gear with the advent of petroleum extraction and utilization.
The low hanging fruit of cheap resource extraction, rapid technological advancement, and worldwide population growth, has been picked. The going gets tougher from here. On top of that, we are in the midst of a worldwide credit contraction. The Fed’s quantitative easing programs had marginal benefit, being more effective psychologically than economically. The shale oil boom had much more to do with our recent economic recovery than monetary policy. The downside of artificially low interest rates is starting to manifest itself in asset bubbles that are popping.
Germany’s more conservative monetary policy has gotten a lot of bad press for stagnating the EU, but has been sounder long term policy than the US Fed’s. The EU’s problems are more based on fiscal policy and demographics, and won’t be solved by EU QE.
China’s period of rapid growth is ending. The structural problems of a command economy are starting to emerge.
Third world economies had their day in the sun with the influx of capital brought on by the commodity super-cycle, but are now in the throes of low commodity prices compounded by high debt levels.
So the crux of the matter is: can the US economy pick up enough steam to pull along the rest of the world? First off, low oil prices are absolutely a plus. Cheap energy spurred on the entire industrial revolution. Second, technological advancement looks iffy to me. Yes, things will move forward, but not at the rate they once did. And increasingly, technology will eliminate low knowledge jobs and continue to widen the wealth gap. While the NASDAQ used to thrive by disrupting legacy industry, it will become more a matter of cannibalizing itself. Third, employment as a percentage of working age population is still terrible, and hasn’t and won’t support wage growth. That pretty much dooms the housing market, formerly one of the main drivers of the US economy.
The Fed’s economic policies were never all that effective. Fiscal policy such as massive public infrastructure investment would be beneficial, but is unlikely in a grid-locked congress. Further asset bubbles caused by low interest rates will be a big problem going forward.
So the US economy looks sideways at best in the future to me. The worldwide economy looks poor, with populism, and social unrest being a major risk. Deflation looks like a real risk at home and abroad. Equities have milked the most that can be expected out of low interest rates. Earnings growth prospects look poor with a rising dollar and shaky economic prospects in the rest of the world. (Source World Steel Association)


