Analysis

February 24, 2015
US Vehicle Sales and NAFTA Vehicle Production Analysis for January 2015
Written by Peter Wright
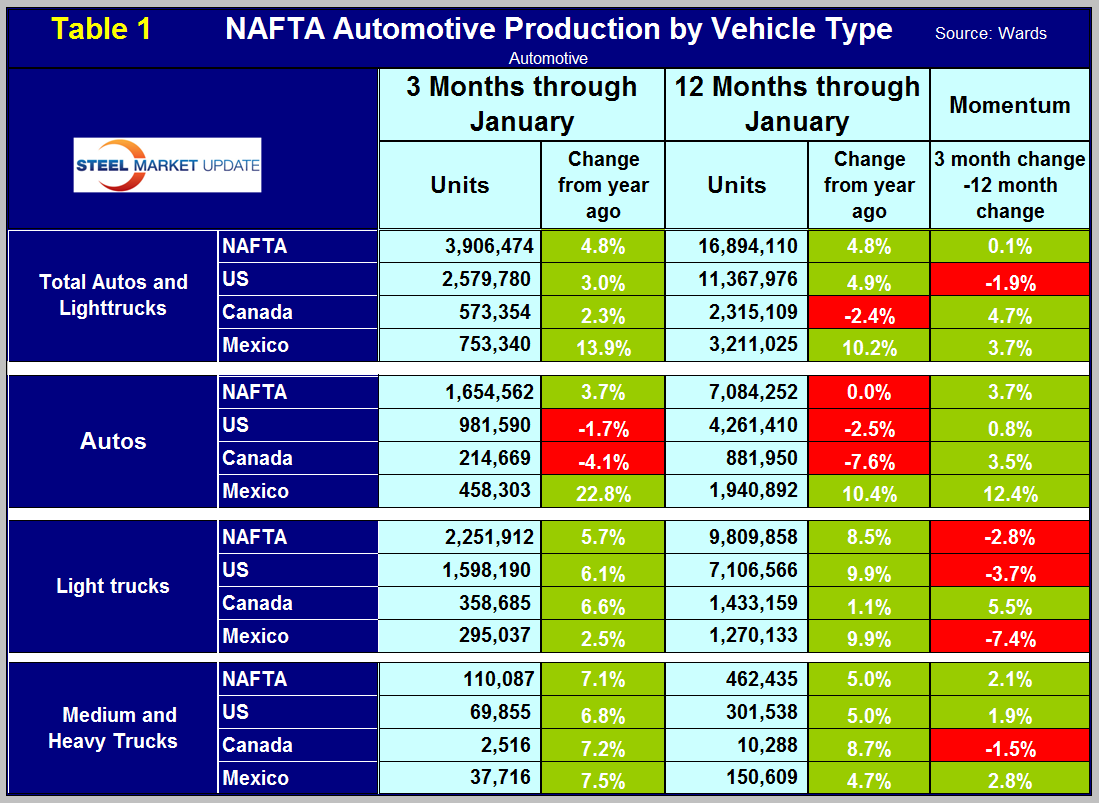
The vehicle sales year had a good start in January with 16.7 million units on a seasonally adjusted annualized basis. Light trucks are benefiting from lower gas prices and reached 55 percent of light vehicle sales, the highest since 2014. This is good for the US assembly plants because the US light truck production is much higher than autos, (see Table 1 below). Also auto imports are higher than light trucks so the increasing sales of light trucks benefits US assembly plants disproportionately. Import market share in January was 20.36 percent down from 21.3 percent in December.
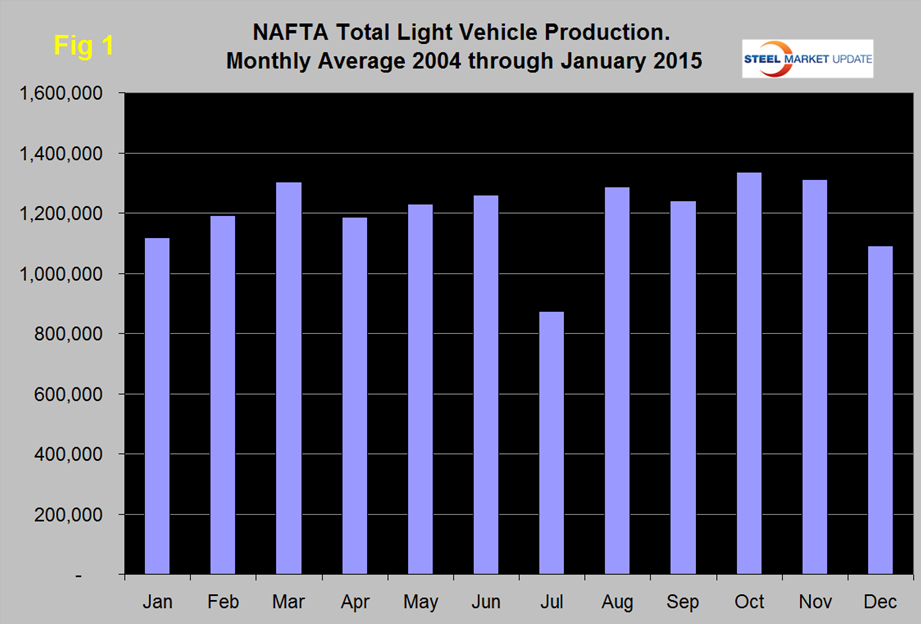
Total light vehicle production in NAFTA in January was at an annual rate of 15,920,000 units, up by 1.2 million from December or 8.1 percent. On average since 2004, January’s production has been 2.4 percent higher than December (Figure 1).
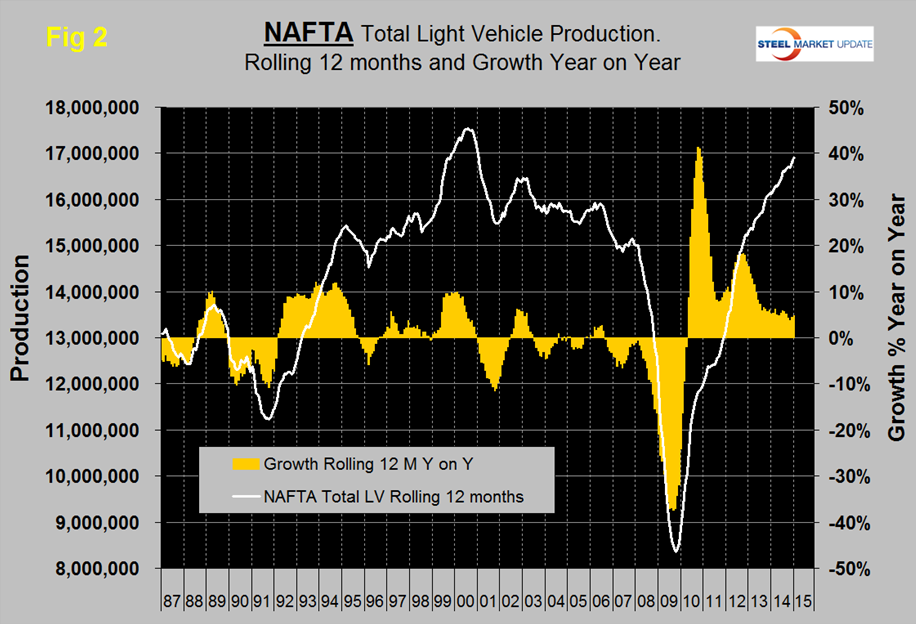
Note: these production numbers are not seasonally adjusted, the sales data reported above are seasonally adjusted. History predicts that production will increase in February and March before declining by 9 percent in April. On a rolling 12 months basis y/y light vehicle production in NAFTA increased by 4.8 percent through January, is now well above the pre-recession peak and is heading for the all-time high of mid-2000 (Figure 2).
On this basis, the US is up by 4.9 percent, Canada is down by 2.4 percent and Mexico is up by 10.2 percent (Table 1).
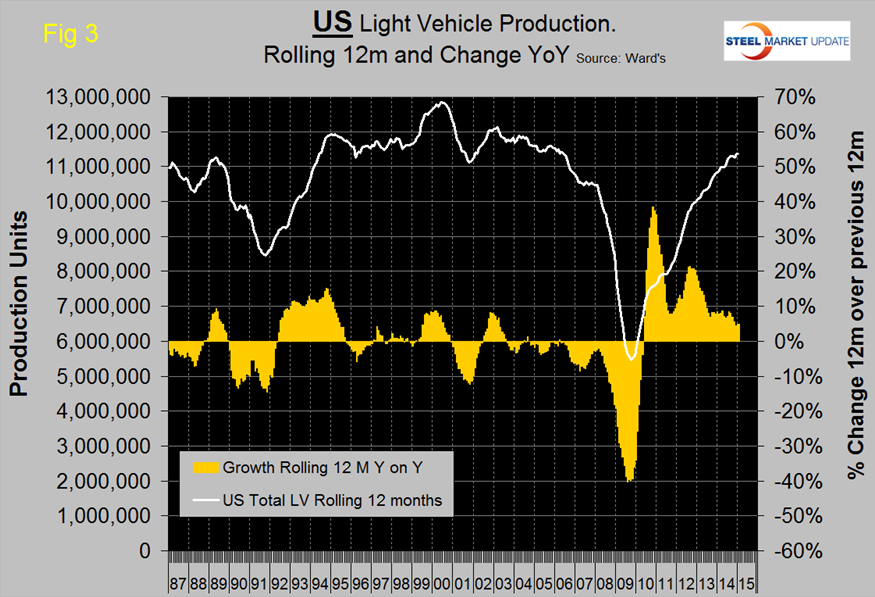
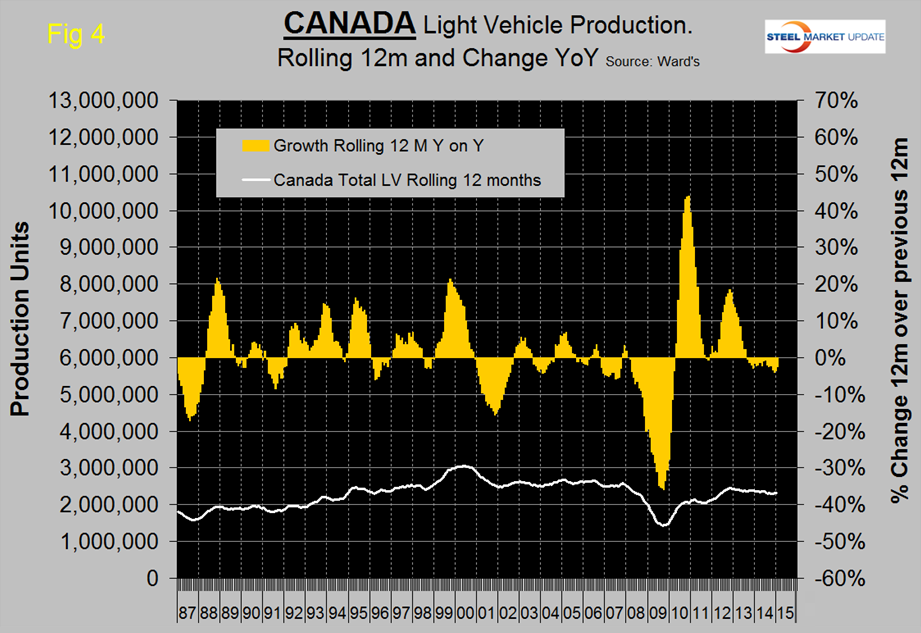
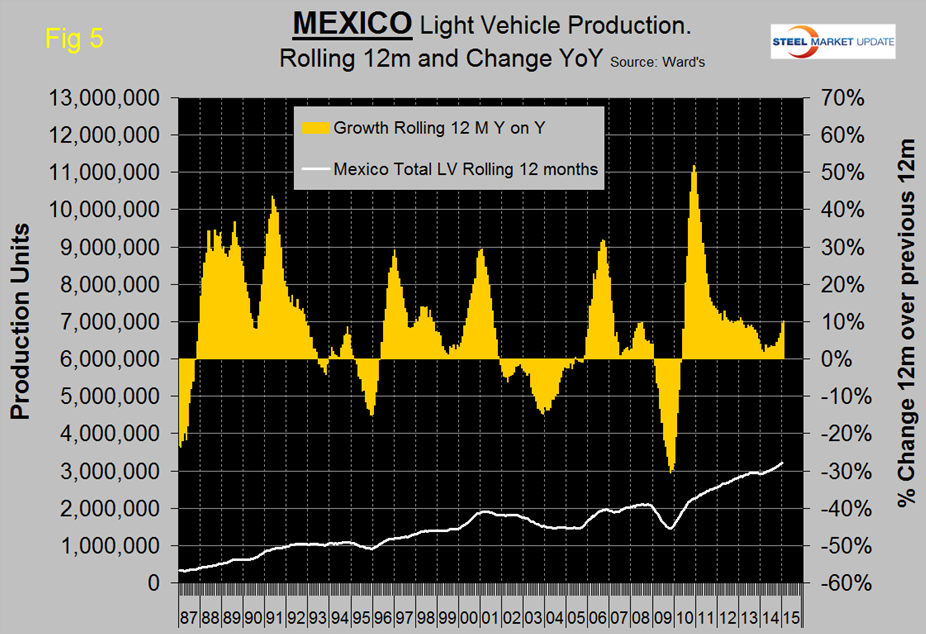
For NAFTA as a whole on a rolling 12 month basis year over year, light truck production was up by 8.5 percent and autos were unchanged. The following three graphs show the production and growth of light vehicles in the US, Canada and Mexico. (Figure 3, Figure 4, Figure 5).
Note that the scales are the same to give a quick visual appreciation of relative production and relative growth. In the last year growth has once again begun to favor Mexico over the US as Canada has contracted every month for a year and a half. In 12 months through January, US production was 11,368,000 units, Canadian production was 2,315,000 units and Mexican production was 3,211,000 units.
MAPI (the Manufacturers Alliance for Productivity and Innovation) made the following observation this week about manufacturing within NAFTA. Canada and Mexico deserve special attention in view of recent criticism in the United States about the regional free trade relationship. For manufacturers, the United States, in 2014, was in trade surplus with NAFTA partners by $17 billion, with the $63 billion surplus with Canada more than offsetting the $46 billion deficit with Mexico. Equally noteworthy is the aggregate size of trade within North America, and thus the mutual gains from trade by all parties. U.S. exports of manufactures of $421 billion in 2014 were two and a half times larger than exports to China, Japan, and South Korea combined, and triple U.S. exports to the four listed Europeans. In relative terms, the U.S. deficit with Mexico was a moderate 25 percent of exports to Mexico, while the deficit with China was an astounding 450 percent of U.S. exports to China. NAFTA is thus a success story for free trade in manufactures, although this has also resulted in a progressively deeper concentration of U.S. exports to North America, compared with exports to Asia or Europe.
We at SMU are wondering if the recent loss in value of the Peso is causing auto assemblers to move production to Mexico. We believe there is enough spare capacity both sides of the border for the automotive manufacturers to play this game. This isn’t happening in Canada, in spite of the depreciation of the Loonie, because (in our opinion) the labor relations situation in Canada is causing manufacturers in general to reduce their exposure. US Steel is a case in point.
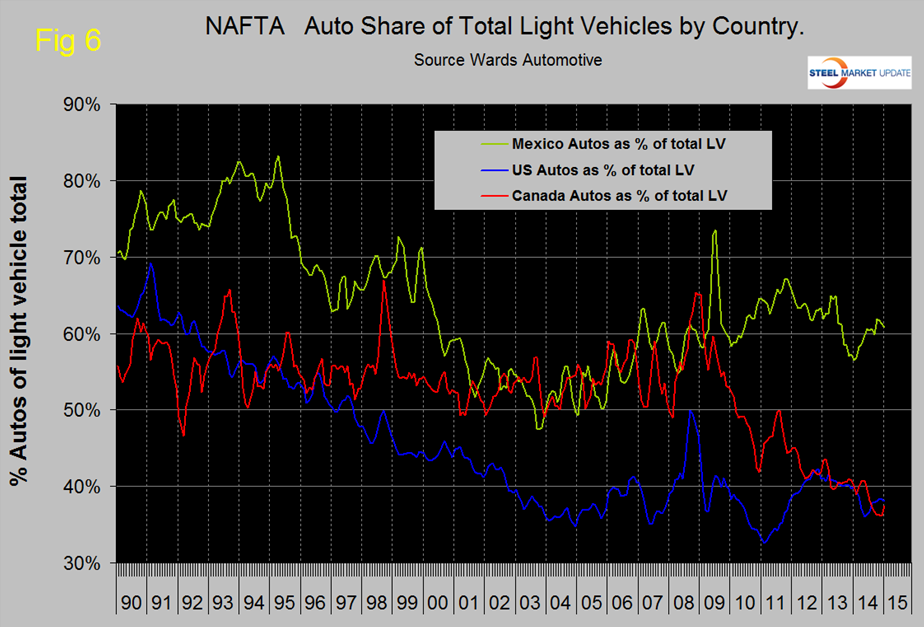
The mix of light vehicles is very different by country (Figure 6). The percentage of autos in the Mexican mix in the last three months was 60.8 percent but only 38.0 in the US and 37.4 percent in Canada.
Ward’s Automotive reported on Friday that total light vehicle inventories in the US increased by a whopping 20 days of sales in January to 81 days but this is still 9 days lower than January last year. Month over month FCA (Fiat Chrysler Automotive) was up by 29 days to 102, Ford by 15 days to 87 and GM by 24 to 94 days.
The SMU data file contains more detail than be shown here in this condensed report. Readers can obtain copies of additional time based performance results on request if they wish to dig deeper. Available are graphs of auto, light truck and medium and heavy truck production, growth rate and production share by country.


