Market Data

February 22, 2015
SMU Survey: Flat Rolled Steel Demand to Improve
Written by John Packard
Twice per month Steel Market Update conducts our flat rolled steel market analysis. We invite slightly more than 600 qualified companies to participate in our questionnaire which consist of questions about demand, inventories, foreign imports, pricing, sentiment, service center pricing and more. We have been compiling information since late 2008 (SMU began as an official company in August 2008) and much of that data is available to those who are Premium level members. We provide our Premium level members a Power Point presentation at the end of the week of each survey as part of their upgrade.
This past week was a typical one regarding both our response rate and the mix of companies participating. We found 44 percent of the respondents were manufacturing companies, 41 percent were service centers/wholesalers, 7 percent were trading companies, 5 percent steel mills and 3 percent were toll processors.
There are several key areas we probe in each and every survey. In this article we want to concentrate on flat rolled steel demand.
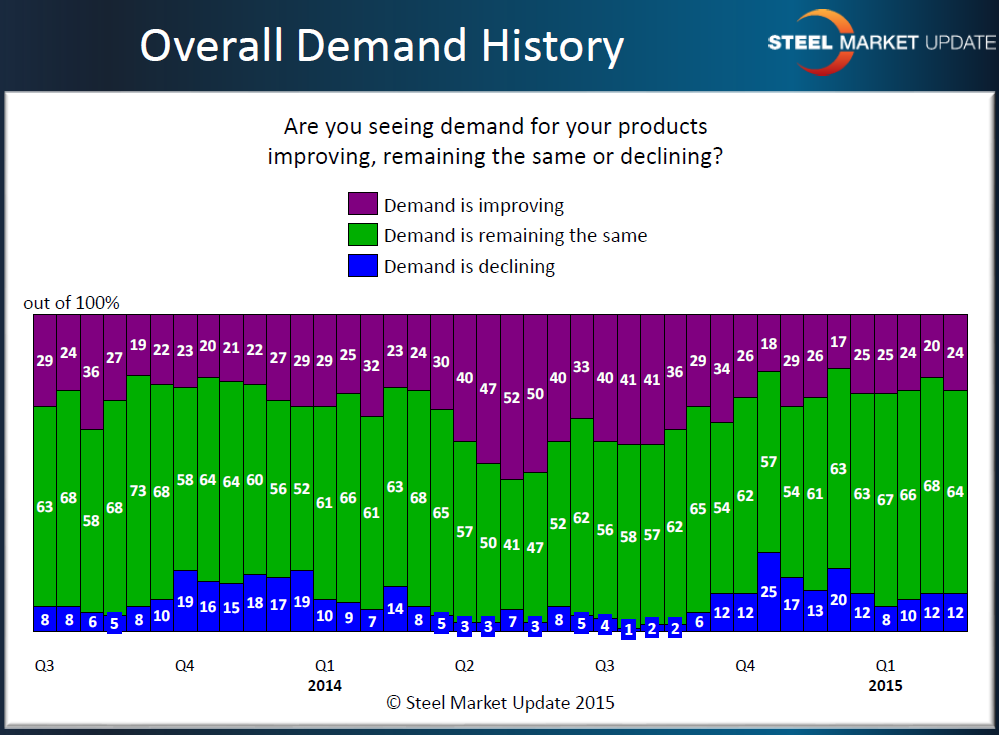
We want to know what the flat rolled steel buying and selling communities are thinking about demand. In last week’s survey we found demand levels to be consistent with what we have been measuring going back to late 4th Quarter 2015. We are seeing 1st Quarter demand levels as being reported at similar levels as what was seen one year earlier.
What we all want to know is what will demand look like 3 to 6 months into the future? Will we see a repeat of 2014 when there was a surge in demand during the second and third quarters, which is a typical seasonal pattern in flat rolled due to residential and commercial construction. If we do, then we can expect a burst of orders (assuming the service center get their inventories under control) in the coming weeks. A surge in orders should end the price erosion we have been seeing since August of last year.
Manufacturing Demand
We do not stop with just asking all of our participants what they think about demand, it is important to quantify the answers by breaking out manufacturing from distribution.
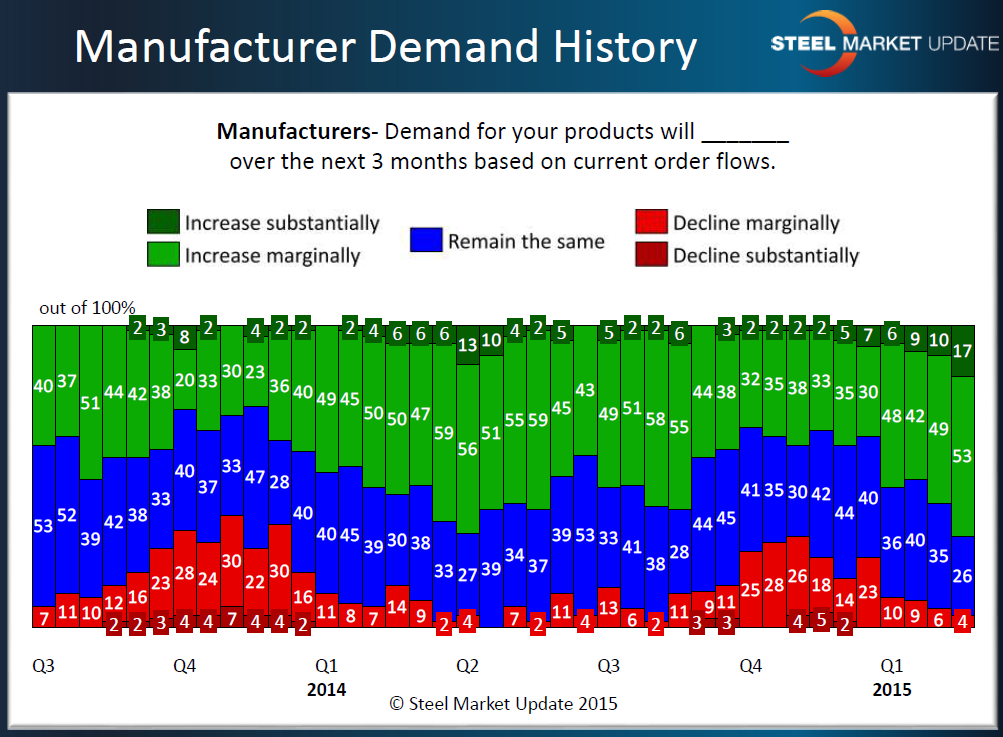
As you review the graph below note that we are asking the manufacturing companies participating in our survey to comment on demand for their products with the choices being that demand will: Increase Substantially, Increase Marginally, Remain the Same, Decline Marginally and Decline Substantially.
As you can see by the results, manufacturing companies are quite optimistic, even to the point where 17 percent of the manufacturing respondents are expecting demand to increase substantially. All told 70 percent of the manufacturing companies reporting were quite bullish on the future for their company.


