Market Data

February 20, 2015
Flat Rolled Steel Service Center Inventories: Apparent Excess/Deficit Report & Forecast
Written by John Packard
Steel Market Update last Apparent Excess/Deficit forecast for flat rolled steel shipments and inventories called for shipments in January to exceed 2014 levels by 2 percent. Total flat rolled shipments for the month of January 2015 were projected by us to be 2,415,000 tons. In actuality, shipment levels were 1.6 percent higher than January 2014 for a total of 2,295,500 tons according to the Metal Service Center Institute (MSCI) data released earlier this week.
![]() Where we missed our forecast was regarding receipts of flat rolled and total flat rolled inventories at the end of the month of January. Our original forecast for January believed with foreign imports totaling close to 4.4 million net tons during the month of January (all products), almost 800,000 tons more than December, that we would see an increase in flat rolled inventories at the distributors.
Where we missed our forecast was regarding receipts of flat rolled and total flat rolled inventories at the end of the month of January. Our original forecast for January believed with foreign imports totaling close to 4.4 million net tons during the month of January (all products), almost 800,000 tons more than December, that we would see an increase in flat rolled inventories at the distributors.
We projected inventories would rise by 5 percent plus a foreign adjustment of another 100,000 tons. SMU projected flat rolled inventories at the service centers would total 6,540,000 tons. In actuality, service centers held 6,175,900 tons of flat rolled inventories at the end of the month. Total inventories actually shrunk by 55,000 tons.
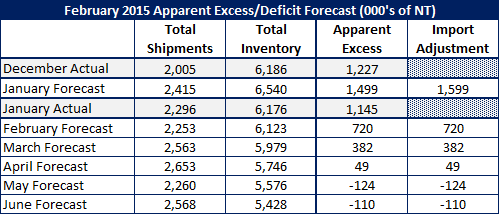
Our original Apparent Excess inventory forecast for January called for inventories to be out of balance by 1.6 million tons. Based on the latest data received from the Metal Service Center Institute and analyzed by Steel Market Update’s balanced inventory model, the actual Apparent Excess for January was 1,145,000 tons down from 1,227,000 tons the previous month. Although we missed the actual tonnage level we did not miss the continued reality that the flat rolled distributors entered February with a hefty excess of inventories.
U.S. service centers, who had been receiving carbon flat rolled at an average of 121,012 tons per day in December, were able to reverse that trend and bring receipts down to 108,814 tons per day. The distributors received 2,660,800 tons of inventories in December and in January they only received 2,285,300 tons.
Very little of that adjustment came from a reduction in foreign receipts. Although import numbers don’t tell us if the material being brought into the country was for a manufacturing company, service centers or steel mills, we are assuming that the breakdown (percentages) remain somewhat constant from month to month. If that assumption is correct the only flat rolled product showing a significant reduction in imported tons during the month of January vs. December was hot rolled (343,671 tons vs. 524,344 tons).
This means that the vast majority of the reduction in tonnage most likely came out of the domestic steel mills. This helps explain the weakness in steel prices during the month of January and moving into early February.
New Forecast for February through June 2015
Based on the January’s results we believe the flat rolled steel service centers will continue at a similar pace as they attempt to balance inventories. We are forecasting that shipments will exceed February 2014 levels by 1.5 percent. We are forecasting total shipments on flat rolled out of the U.S. distributors will be 2,253,300 tons (20 shipping days vs. 20 last year).
SMU is projecting service centers will receive new inventories at a rate of 110,000 tons per day during the month of February. This is up slightly from the 108,814 tons per day received during January. However, it is 4,706 tons per day less than what we saw last February when service centers were in a build rather than reduction mode.
If we are correct in our assumptions, service centers will end February with 6,122,600 tons of inventory and the Apparent Excess condition will continue at 720,000 tons.
We are using the same model for the months of March, April, May and June with shipments increasing by 1.5 percent above 2014 levels and receipts to remain steady at approximately 110,000 tons per day.
If this assumption proves to be relatively accurate service centers will be in a balanced inventory situation by the end of April (or slightly earlier).
In our opinion, we should see a pickup in order activity out of the service centers as lead times hit mid to late April and into May.
That would also be the time when the slide in prices should cease and we could see a bounce off the bottom as service centers restock and as demand improvement in the non-residential construction sector improves. The only drag on demand will be the energy markets (which should also be bottoming unless oil prices continue below $50 per barrel and into the low $40’s (or lower). Mining activity will also be reduced due to the lower commodity prices.
Offsetting energy and mining will be consumer demand should be rising. This could help keep automotive strong, assist housing (assuming a continued low interest environment), appliance, etc.
One area we need to continue to watch is the flow of foreign orders which we believe will continue to be high through the month of March. After that point they should begin to shrink. If they do not, that will continue to pressure inventories and the mill order books.
Below is a table showing our January forecast, January actual, and our forecast for February through June 2015.
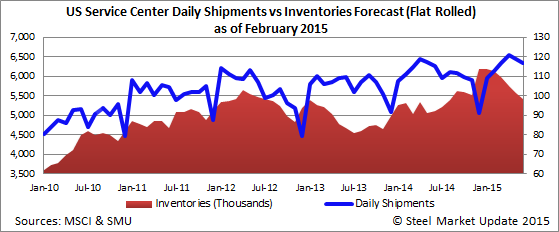
The graph below shows the daily shipment rate against inventory levels through our June 2015 forecast.
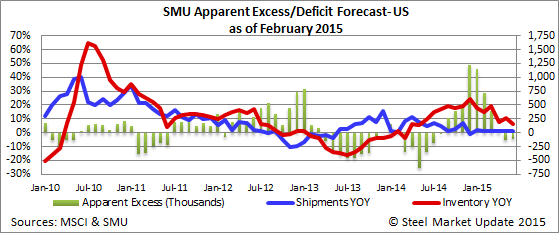
The graph below shows the change in the daily shipping rate and total inventory levels in a year over year comparison and out Apparent Excess model through our June 2015 forecast.
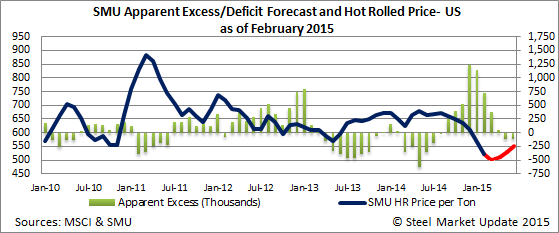
The graph below shows our Apparent Excess model through our June 2015 forecast along with the projected SMU hot rolled price index. Note that our opinion is for prices to level off at, or near, existing levels before slowing increasing in mid to late 2nd Quarter 2015.


