Prices

February 19, 2015
February Import License Data Trending Toward Another 4 Million Ton Month
Written by John Packard
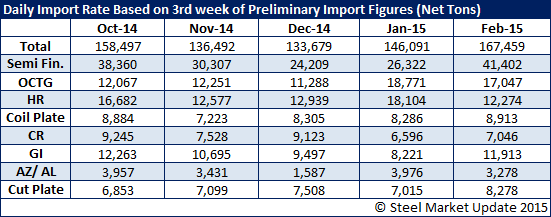
The U.S. Department of Commerce released the latest import licensing data for the license requests received through the 18th of February. Steel Market Update (SMU) then compares the daily tonnage rate against the previous four months and the daily license rate being reported during the 3rd week of that particular month.
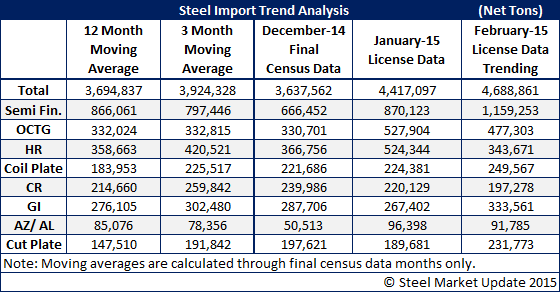
Based on that analysis, the trend for February 2015 steel imports is for this month to be another very large month with imports at, or above, those of January 2015. Based on license data as of February 18th, January is expected to come in around 4.4 million net tons of total foreign steel products (Preliminary Census data should be released next week).
February 2014 imports totaled 3.29 million net tons.
We are expecting large gains in semi-finished steels (slabs) which are trending toward 1 million net tons. The 12 month moving average for semi-finished is 866,061 net tons.
Even with the slowdown in the energy sector, oil country tubular goods (OCTG) imports are trending above the 12 month moving average of 332,024 net tons. What SMU finds interesting is the South Koreans, although still active in the market despite their dumping duties (107,000 net tons of license requests so far this month), are being challenged by other countries, some coming in for the first time or from very small positions in the past: Saudi Arabia (20,000 net tons of license requests so far this month), Austria (26,000 net tons), Brazil (13,000 net tons), Russia (7,000 net tons double their average rate), Czech Republic (8,500 net tons), as well as Japan and Argentina. Canada and Mexico combined for 29,000 net tons of license requests so far this month.
Plate products are trending higher than their rolling 12 month average: coiled plate (Turkey and Japan tonnage have jumped), cut plate (France, Germany, Turkey & Italy).
For flat rolled products we are seeing:
Hot rolled: Trending lower than both its 12 month and 3 month rolling average, South Korea is the biggest player.
Cold rolled: Trending slightly lower than both 12 month and 3 month rolling average with China, India, Sweden, South Korea and Canada being major players.
Galvanized: Trending well above both the 12 month and 3 month moving average with China, India, Taiwan, South Korea and Canada the major players.
Galvalume: Is trending slightly above its 12 month and 3 month moving averages.
The table below provides you with a look at the 12 month moving average (12MMA), 3 month moving average (3MMA) as well as the total imports for December (Final Census Data) and January (Import License Data through February 18th) and what we mathematically calculate as the trend for February. The February trend is done by taking the daily license rate and extrapolating it over the entire month. Our true expectation is for the month to be less than the 4.6 million tons shown below (but we thought January would also be below 4.0 million tons and we were surprised when our trending forecast was more accurate than our “gut” feel).


