Market Data

February 9, 2015
Net Job Creation through January 2015
Written by Peter Wright
The Bureau of Labor Statistics (BLS) report on non-farm employment indicated that 257,000 jobs were added in January. As we were analyzing this date we noticed massive historical revisions and had to go back to January 2000 (15 years!) before were confident we had caught them all. In the 12 months of 2014, job creation was revised up by 164,000 positions and in just November and December up by 147,000. The three month moving average (3MMA) of gains in January was the highest since March 2000 at 336,000. This job recovery is now seen to be much stronger than was the case in the mid-2000s, (Figure 1).
Total non-farm payrolls are now 2,484,000 more than they were at the pre-recession high of January 2008. November was the first time ever for total non-farm employment to exceed 140 million. In each of the last eleven months the 3MMA has exceeded 200,000 / month and with the latest revision, 2,950,000 jobs were created in 2014. All numbers in this analysis are seasonally adjusted by the BLS.
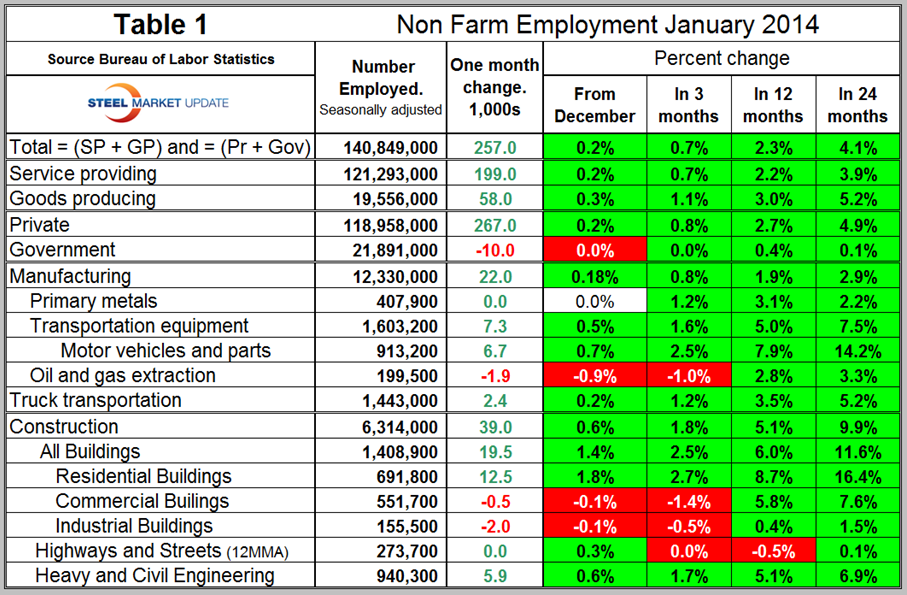
Table 1 slices total employment into service and goods producing industries and then into private and government employees.
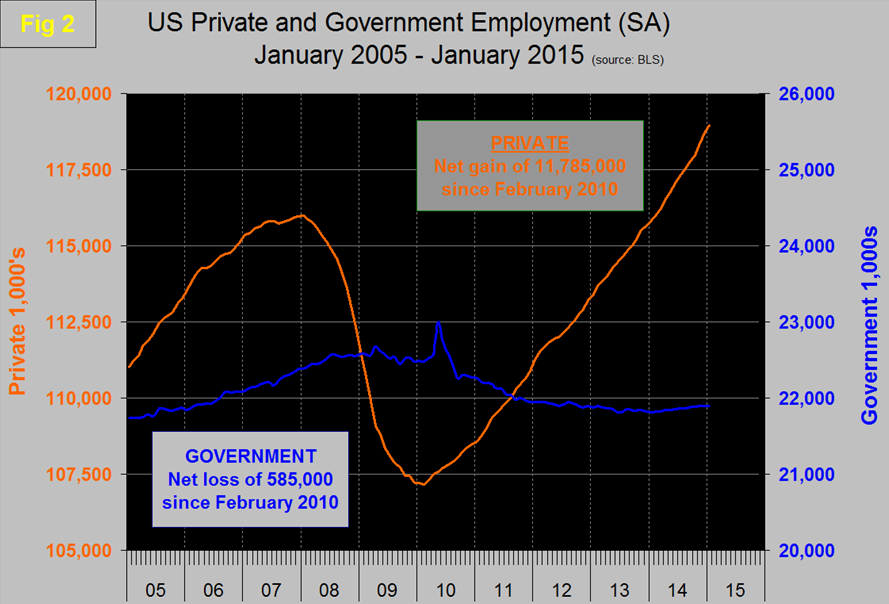
Total employment equals the sum of private and government employees. It also equals the sum of goods producing and service employees. Most of the goods producing employees work in manufacturing and construction and these sectors are further subdivided in Table 1. In January private employment grew by 267,000 and government declined by 10,000. Since February 2010 which was the employment low point, private employers have added 11,785,000 as government has shed 585,000, (Figure 2).
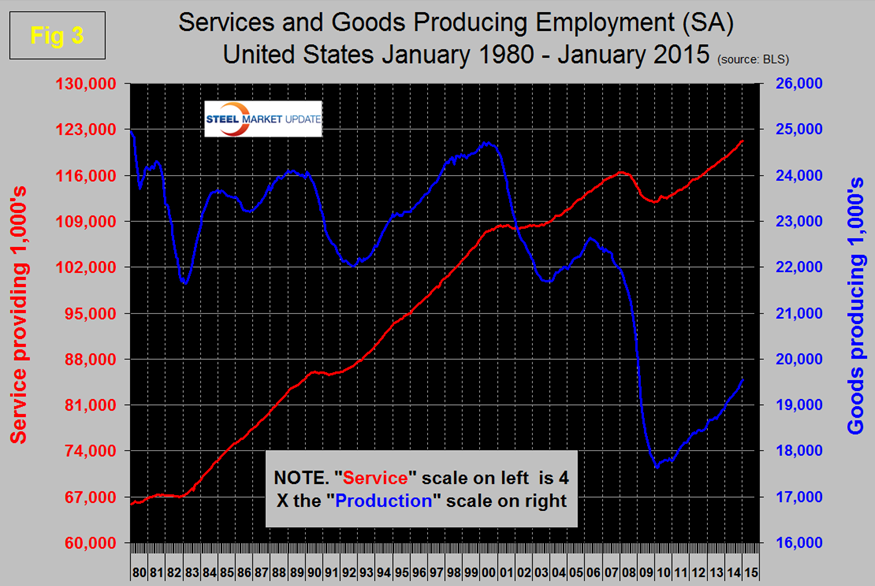
In 15 years since January 2000, federal government employment is down by 43,000, state government is up by 312,000 and local government is up by 1,051,000. In January service industries expanded by 199,000 and goods producing by 58,000 people. Since February 2010, service industries have added 9,271,000 and goods producing 1,929,000 positions, (Figure 3).
Manufacturing added 22,000 jobs in January and a revised 222,000 jobs for 2014 as a whole. Transportation equipment which is mainly motor vehicles and parts was the strongest sector in manufacturing in January with 7,300 additions. Note; Table 1 only identifies the major sectors in manufacturing and construction so the totals don’t add up.
Construction added 39,000 jobs in January and a revised total of 338,000 jobs for 2014 as a whole, however the construction of commercial and industrial buildings both lost ground in December and January. The strongest construction sector in January was residential buildings which had a growth of 12,500 jobs.
Since the bottom of the employment recession manufacturing has added 877,000 jobs and construction has added 814,000 jobs, (Figure 4). Clearly construction is catching up fast after a slower initial recovery from the recession. This bodes well for the sector that has been holding back steel demand.
The official unemployment rate increased from 5.6 percent in December to 5.7 percent in January. We are impatient with how misleading this number is because it doesn’t take into consideration those who have stopped looking. This is known as the “U3” rate. However the more comprehensive U6 unemployment rate also increased from 11.2 percent in December to 11.3 percent in January, (Figure 5).
U6 includes workers working part time who desire full time work and people who want to work but are so discouraged that they have stopped looking. The differential between these rates was usually less than 4 percent before the recession but since June has averaged 5.8 percent. The good news is that the gap is closing.
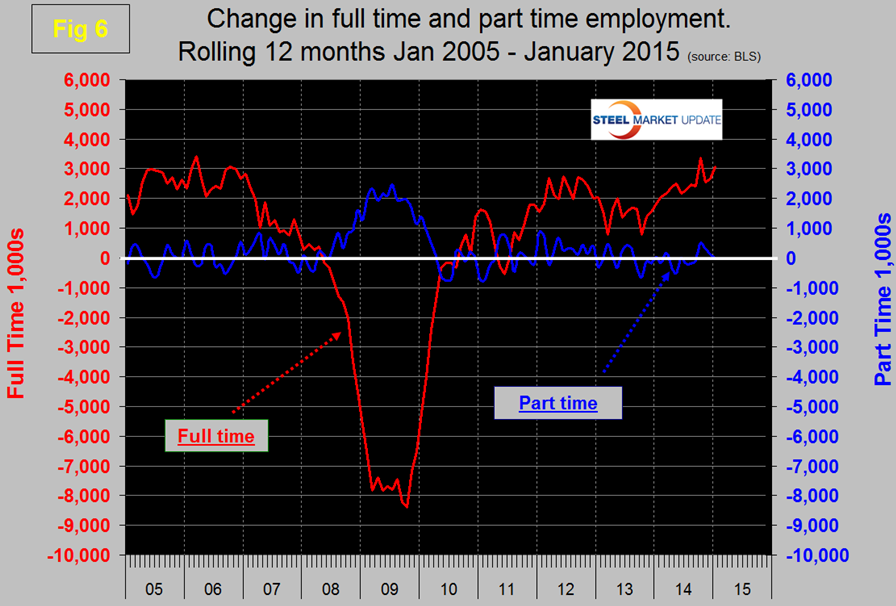
We read a lot in the press about full time and part time job growth, the reporting of which generally appears to us to be inaccurate. This data set is extremely erratic month to month so commentators can often pick up on a single number and run with it. At SMU we have concluded that the only way to get a realistic picture is to examine a 12 month rolling average which screens out most of the variability. By this reckoning the growth of part time employment hasn’t changed much in the last four years, the majority of the growth having been in full time, >35 hours per week, (Figure 6). Since February 2010 the increase in full time employment has been 9,913,000 jobs as part time employment is down by 71,000 jobs.
The global outplacement consultancy Challenger, Gray & Christmas, Inc. reported that employers shed 53,000 job positions in January and that 2014 had the lowest total since 1997.
The report included below is rather pessimistic, it considers only monthly numbers and gives a useful perspective on the reduction in the price of oil. Our analysis reports a three month moving average and on this basis the layoff rate has been gradually drifting down for three years and is consistently lower than the pre-recession level, (Figure 7). We include this analysis as a reality check for the government statistics.
Employers shed 53,041 in January; 40 percent due to drop in oil prices
Chicago, February 5, 2015 – Job cut announcements surged to their highest level in nearly two years, as falling oil prices prompted cost-cutting efforts in energy and related industries. In all, U.S.-based employers announced plans to shed 53,041 jobs from their payrolls to start 2015; with 40 percent of those directly related to oil prices.
The January total was up 63 percent from the 32,640 planned layoffs announced in December, according to the report on monthly job cuts released on Thursday.
Last month’s figure was 18 percent higher than the same month a year ago, when employers announced job cuts totaling 45,107. Last month, in fact, saw the highest monthly job-cut tally since February 2013 (55,356) and the highest January total since 2012, when employers announced 53,486 job cuts to begin the New Year.
Of the 53,041 job cuts announced in January, 21,322 were directly attributed to the recent and sharp decline in oil prices. Most of these cuts occurred in the energy industry, where employers announced a total of 20,193 layoffs (19,722 of which were directly attributed to oil prices). The January total is 42 percent higher than the 14,262 job cuts announced by the energy industry in all of 2014. Falling oil prices also contributed to job cuts in the industrial goods manufacturing sector, where companies supplying products and materials to oil drillers were forced to shutter operations. These firms announced 4,859 job cuts in January, of which 1,600 (or 33 percent) were due to oil prices. “We may see oil-related job cuts extend well beyond those industries directly involved with exploration and extraction. The economies throughout the northern United States that have been thriving as a result of the oil boom could experience a steep decline in employment across all sectors, including retail, construction, food service and entertainment,” said John A. Challenger, chief executive officer of Challenger, Gray & Christmas. “On the flip side, there are a number of industries throughout the country that will benefit from falling energy prices. Delta already reported significant savings tied to lower fuel costs. The airline is also seeing more travelers as lower ticket prices are spurring purchases from travelers, who have more money in their wallets. Trucking companies, plastics manufacturers and paint makers are also seeing bottom lines improve,” said Challenger. “Despite the recent surge in job cuts, the net result of falling oil prices could ultimately prove to be positive for the economy, as a whole. Not only will many industries see cost savings, but consumers will have more money for discretionary spending on things like dining out, travel, and entertainment. Lower prices at the pump has also been linked to higher sales of SUVs and other less fuel-efficient vehicles,” he added. While retailers may ultimately benefit from falling oil prices, the sector did, in fact, post the second largest job cut total in January, behind energy. Employers in the sector announced
6,699, the bulk of which came from the perennially struggling JC Penney and teen fashion retailer Wet Seal. Despite large layoff announcements from the two companies, retail job cuts were still lower than the same month a year ago, when stores announced 11,394 cuts coming out of the holiday season.
On Friday the BLS issued the following press release: (Abridged by SMU).
Total non-farm payroll employment rose by 257,000 in January. Job gains occurred in retail trade, construction, health care, financial activities, and manufacturing. After incorporating revisions for November and December (which include the impact of the annual benchmark process), monthly job gains averaged 336,000 over the past 3 months. Employment in retail trade rose by 46,000 in January.
Construction continued to add jobs in January (+39,000). Employment increased in both residential and nonresidential building (+13,000 and +7,000, respectively). Employment continued to trend up in specialty trade contractors (+13,000). Over the prior 12 months, construction had added an average of 28,000 jobs per month.
In January, health care employment increased by 38,000. Job gains occurred in offices of physicians (+13,000), hospitals (+10,000), and nursing and residential care facilities (+7,000). Health care added an average of 26,000 jobs per month in 2014.
Manufacturing employment increased by 22,000 over the month, including job gains in motor vehicles and parts (+7,000) and wood products (+4,000). Over the past 12 months, manufacturing has added 228,000 jobs.
Professional and technical services added 33,000 jobs in January, including increases in computer systems design (+8,000) and architectural and engineering services (+8,000).
Employment in other major industries, including mining and logging, wholesale trade, transportation and warehousing, information, and government, showed little change over the month.
The average workweek for all employees on private non-farm payrolls was unchanged at 34.6 hours in January. The manufacturing workweek edged up by 0.1 hour to 41.0 hours, and factory overtime edged down by 0.1 hour to 3.5 hours. The average workweek for production and non-supervisory employees on private non-farm payrolls edged down by 0.1 hour to 33.8 hours.
In January, average hourly earnings for all employees on private non-farm payrolls increased by 12 cents to $24.75, following a decrease of 5 cents in December. Over the year, average hourly earnings have risen by 2.2 percent. In January, average hourly earnings of private-sector production and non-supervisory employees increased by 7 cents to $20.80.
The change in total non-farm payroll employment for November was revised from +353,000 to +423,000, and the change for December was revised from +252,000 to +329,000. With these revisions, employment gains in November and December were 147,000 higher than previously reported. Monthly revisions result from additional reports received from businesses since the last published estimates and the monthly recalculation of seasonal factors. The annual benchmark process also contributed to these revisions.
SMU Comment: The January employment report continues to look excellent and the job recovery is tracking much better than the recovery from the 2001 recession. Which of course it should be since the recessionary losses were much greater in 2008 and 2009. There is an inverse relationship between layoffs and steel production which had a good correlation until early 2013 when the lines began to diverge, (Figure 8). We attribute this to the delayed recovery of construction and the increasing share being taken by imports. Note this long term relationship is not a cause and effect but simply a benchmark that has historically worked to show if steel production is where it should be given the state of the economy. The other interesting divergence in this graph is just before the recession when the labor and housing markets were clearly signaling impending doom eight months before steel demand tanked.


