Market Data

January 12, 2015
Net Job Creation through December 2014
Written by Peter Wright
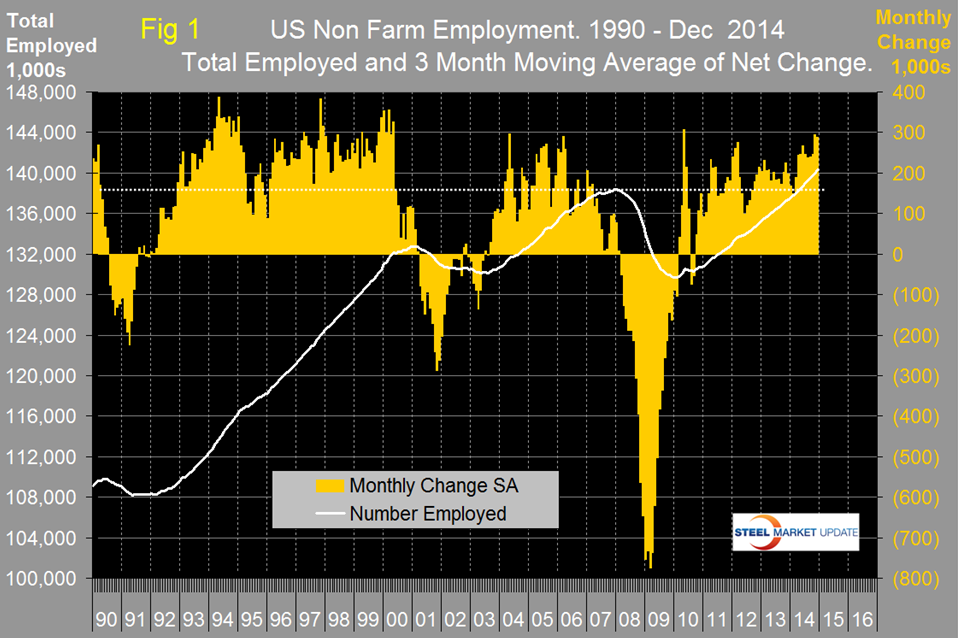
The Bureau of Labor Statistics (BLS) report on non-farm employment indicated that 252,000 jobs were added in December, November and October were revised up by a total of 50,000. The three month moving average (3MMA) of gains in December was second only to November as the highest since May 2010 at 289,000. This job recovery is stronger than was the case in the mid-2000s, (Figure 1). Total non-farm payrolls are now 1,982,000 more than they were at the pre-recession high of January 2008. November was the first time ever for total non-farm employment to exceed 140 million. In each of the last nine months the 3MMA has exceeded 200,000 per month and in 2014 as a whole 2,952,000 jobs were created. All numbers in this analysis are seasonally adjusted by the BLS.
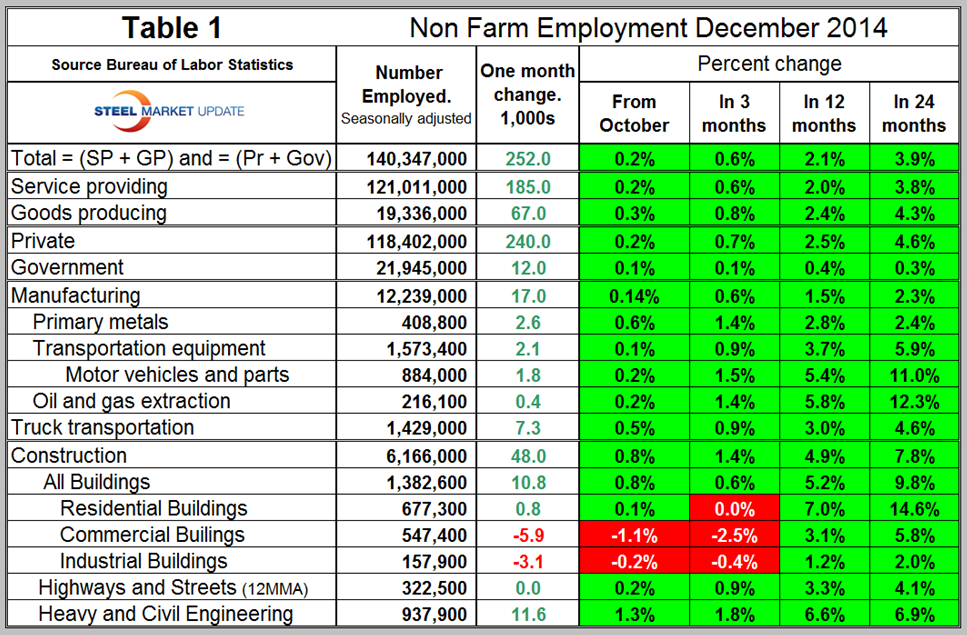
Table 1 slices total employment into service and goods producing industries and then into private and government employees. Total employment equals the sum of private and government employees. It also equals the sum of goods producing and service employees. Most of the goods producing employees work in manufacturing and construction and these sectors are further subdivided in Table 1.
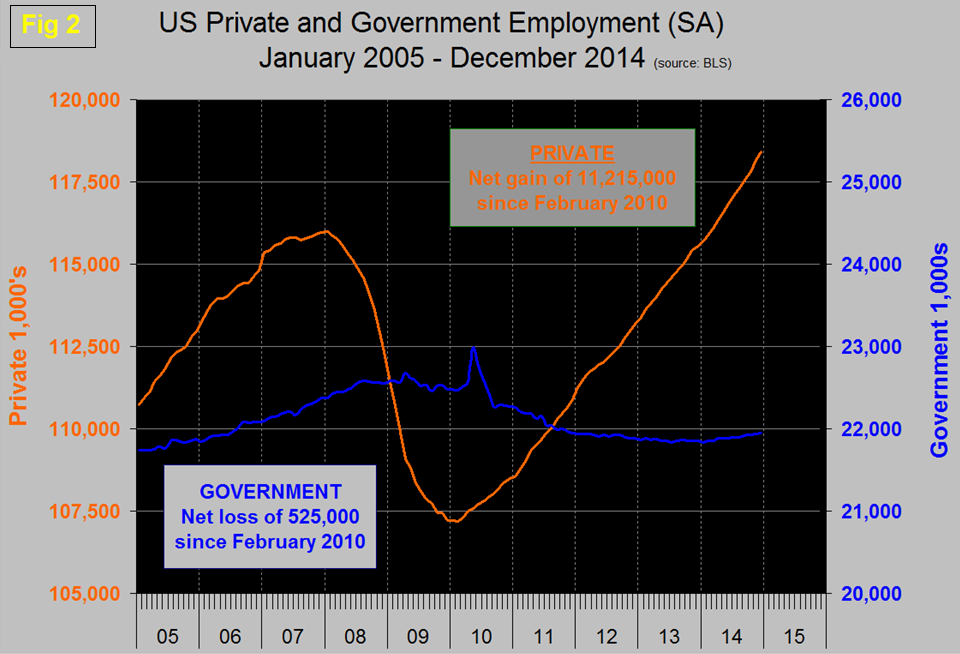
In December private employment grew by 240,000 and government by 12,000. Government employment contracted from September 2009 through January this year but has now had eleven straight months of growth. Most of the growth in government employment has been at the local level. Since the bottom of the employment recession in February 2010, the private sector has gained 11,215,000 jobs as government has shed 525,000 jobs, (Figure 2).
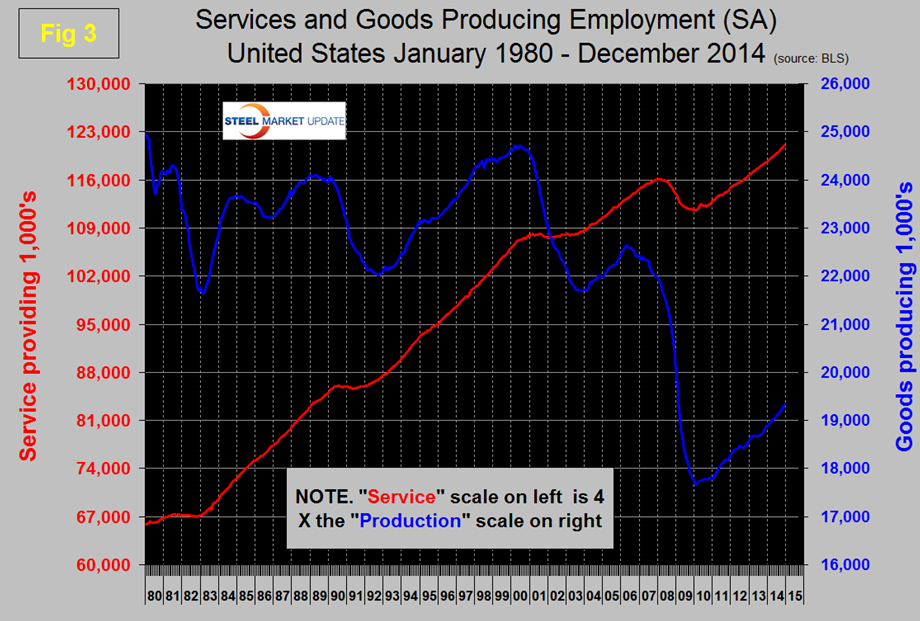
In December service industries expanded by 185,000 and goods producing by 67,000 people. Since February 2010, service industries have added 9,348,000 and goods producing 1,679,000 positions, (Figure 3).
Manufacturing has added 186,000 jobs this year with 17,000 of those added in December. Truck transportation and primary metals were the strongest sectors with additions of 7,300 and 2,600 positions respectively. Note: Table 1 only identifies the major sectors in manufacturing and construction so the totals don’t add up.
Construction has added 290,000 jobs this year with 48,000 in November however the construction of commercial and industrial buildings both lost ground in December. The strongest construction sector in December was heavy and civil engineering which had a growth of 11,600 jobs.
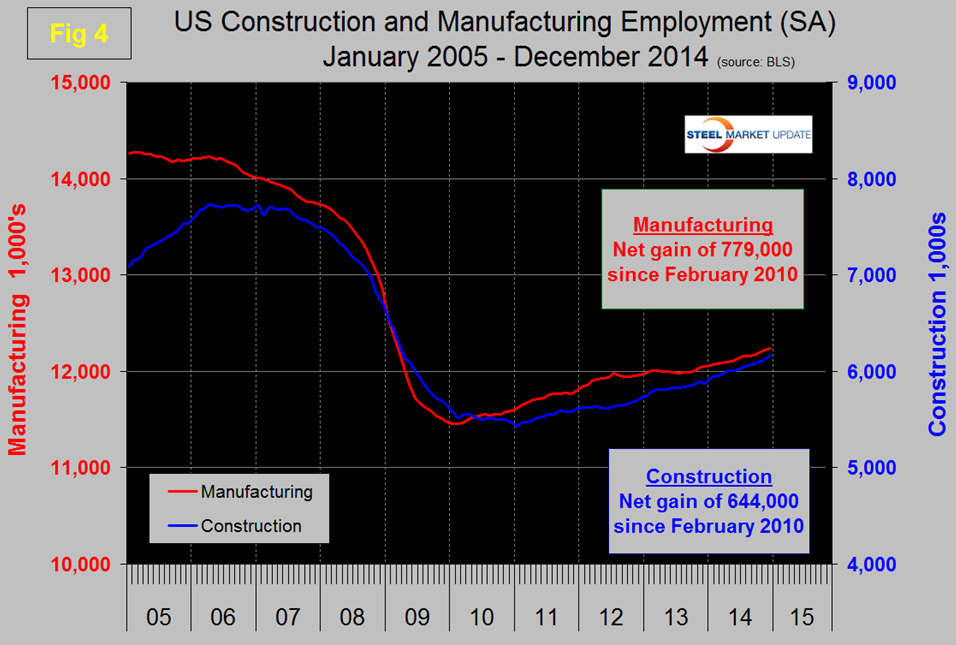
Since the bottom of the employment recession manufacturing has added 779,000 jobs and construction has added 644,000 jobs, (Figure 4). Construction is accelerating which bodes well for the sector that has been holding back steel demand.
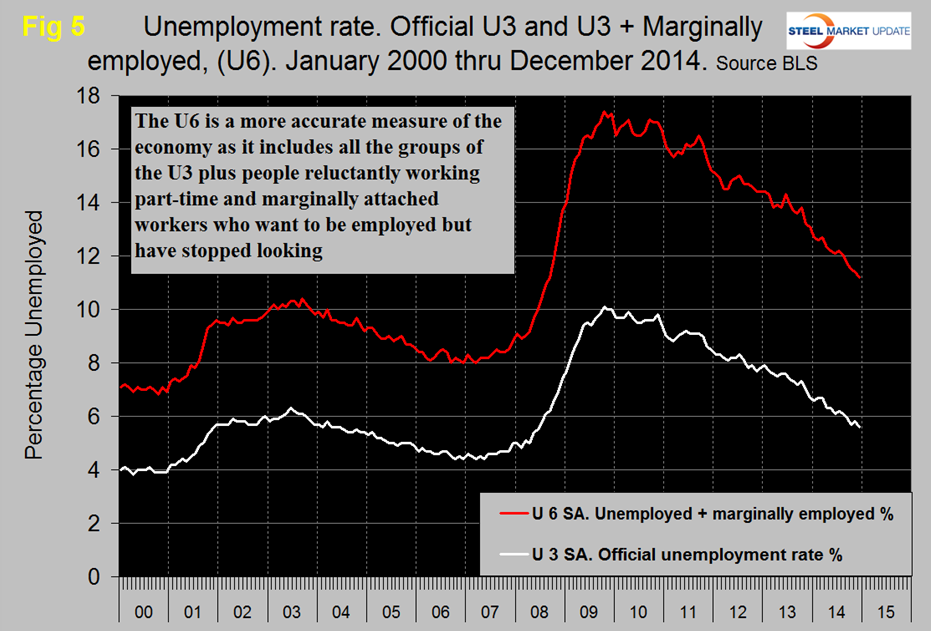
The official unemployment rate declined from 5.8 percent in November to 5.6 percent in December. This is known as the “U3” rate. The more comprehensive U6 unemployment rate stands at 11.2 percent, down from 11.4 percent in November and 12.7 percent in January, (Figure 5).
U6 includes workers working part time who desire full time work and people who want to work but are so discouraged that they have stopped looking. The differential between these rates was usually less than 4 percent before the recession but in 2014 has averaged 5.9 percent. The good news is that the gap is closing.
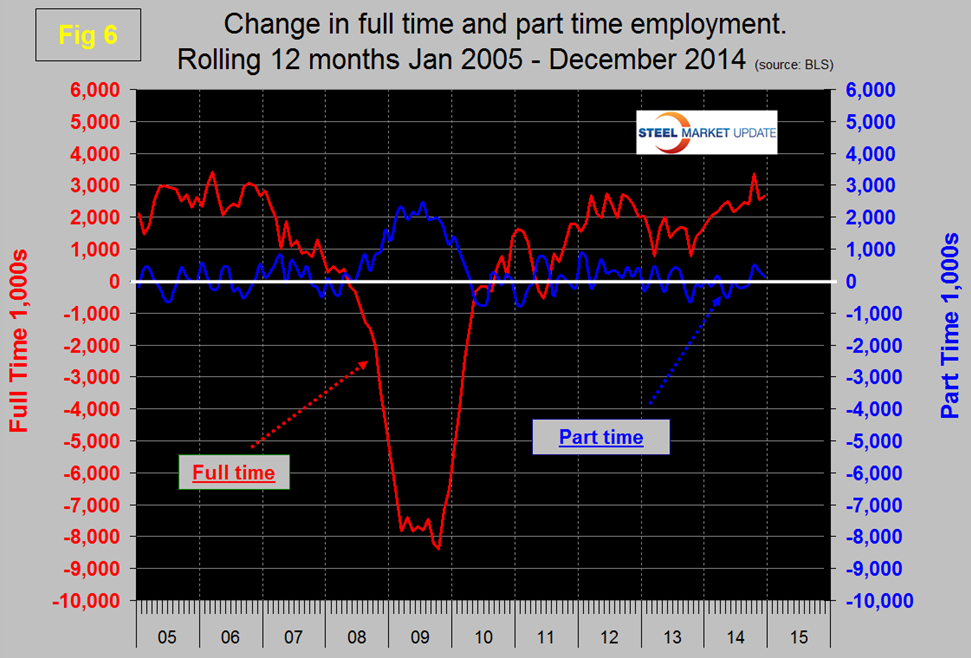
We read a lot in the press about full time and part time job growth which generally appears to us to be inaccurate. This data set is extremely erratic month to month so commentators can often pick up on a single number and run with it. At SMU we have concluded that the only way to get a realistic picture is to examine a 12 month rolling average which screens out most of the variability. By this reckoning the growth of part time employment hasn’t changed much in the last four years, the majority of the growth having been in full time, >35 hours / week, (Figure 6). Since the bottom of the recession the increase in full time employment has been 9,136,000 jobs and in part time has been 2,045,000 jobs.
On Friday the AGC, (Associated General Contractors of America) released the following statement; Construction employers added 48,000 jobs in December and 290,000 for the year, the largest annual increase since 2005, as the sector’s unemployment rate fell to 8.3 percent. Association officials said many firms are expanding payrolls to keep pace with growing construction demand, but are having a hard time finding qualified workers to fill key positions.
“Construction firms are clearly ramping up their hiring to keep up with swelling demand for construction,” said Ken Simonson, the association’s chief economist. “Demand for workers to construct apartments, pipelines and huge industrial projects is likely to remain robust in 2015.”
Construction employment totaled 6,166,000 in December, the highest level since March 2009, with a 12-month gain of 290,000 jobs or 4.9 percent, Simonson noted. Residential building and specialty trade contractors added a combined 13,500 employees since November and 132,100 (6 percent) over 12 months. Nonresidential contractors hired a net of 34,400 workers for the month and 158,200 (4.3 percent) since December 2013. The heavy and civil engineering construction segment, which includes pipelines, petrochemical and power plants, and public works construction, added 11,600 jobs in December and 57,900 (6.6 percent) over the year.
Association officials said the construction employment gains come as more contractors report having a hard time finding enough qualified workers to fill available positions. They urged Congress to act quickly to reform and increase funding for the Perkins Act, which funds most career and technical education programs in the country.
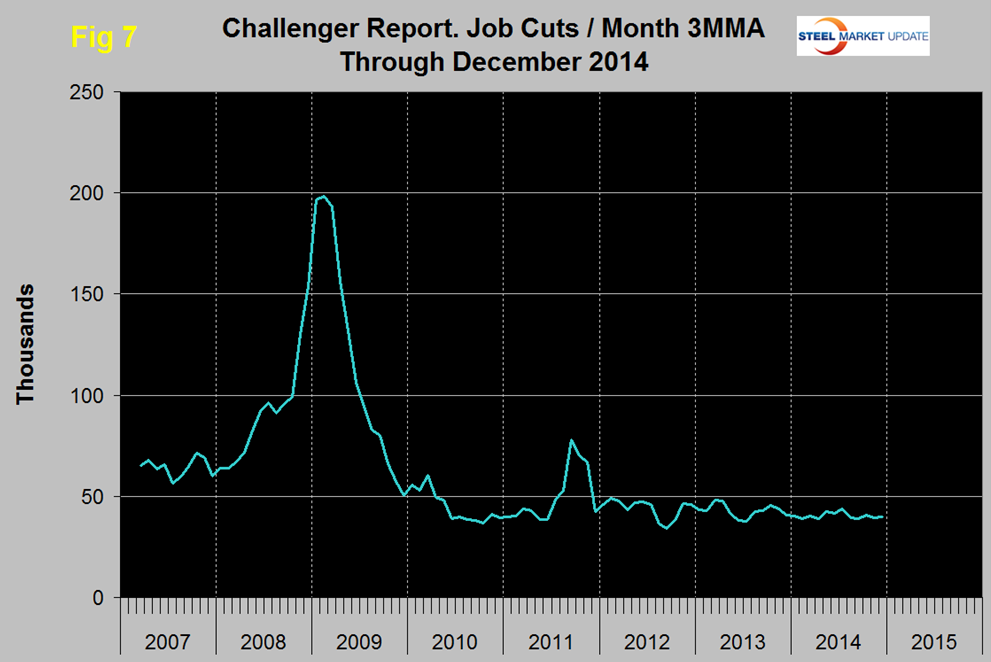
The global outplacement consultancy Challenger, Gray & Christmas, Inc. reported that employers shed 32,640 job positions in December and that 2014 had the lowest total since 1997.
December had the third lowest monthly total of 2014 and the layoff rate has been gradually drifting down for three years, (Figure 6).
Overall, employers announced job cuts totaling 483,171 in 2014. That is 5.0 percent fewer than the 509,051 cuts tracked in 2013. It was the lowest annual total since 434,350 job cuts were recorded in 1997. “Layoffs aren’t simply at pre-recession levels; they are at pre-2001-recession levels. This bodes well for job seekers, who will not only find more employment opportunities in 2015, but will enjoy increased job security once they are in those new positions,” said John A. Challenger, chief executive officer of Challenger, Gray & Christmas. Sixteen of the twenty eight industries tracked by Challenger saw fewer layoffs in 2014, with an average decline of 34 percent. “The biggest threat to the job market’s momentum could be falling oil prices, which may lead to increased job cuts in one of the high-flying sectors of 2014: energy. Lower prices mean less money for research, exploration and new drilling operations,” said Challenger. “In fact, just this week, U.S. Steel announced plans to shutter a plant that manufactures the specialized pipes used in oil and gas exploration and extraction. The resulting 768 layoffs will be counted in January layoff figures and may be precursor of what is to come if prices remain as low as they are now or continue to fall. However, the slowdown in oil-related industries may be more than offset by the extra dollars in consumers’ pockets as they shell out less money for gas and heating oil. The money not spent at the pump can be used for consumer goods, travel, home improvement, and dining out. Furthermore, continued low gas prices could spur an increase in SUV sales. All of these are going to have an immediate and positive impact on the job market and hiring,” said Challenger. Continued improvements in the housing market, the Affordable Care Act, and new technology advancements are expected to drive the economy and employment gains in 2015.
On Friday the BLS issued the following press release (abridged by SMU):
The Employment Situation – December 2014
Total non-farm payroll employment increased by 252,000 in December. In 2014, job growth averaged 246,000 per month, compared with an average monthly gain of 194,000 in 2013. In December, employment increased in professional and business services, construction, food services and drinking places, health care, and manufacturing.
Employment in professional and business services rose by 52,000 in December. Monthly job gains in the industry averaged 61,000 in 2014. In December, employment increased in administrative and waste services (+35,000), computer systems design and related services (+9,000), and architectural and engineering services (+5,000). Employment in accounting and bookkeeping services declined (-14,000), offsetting an increase of the same amount in November.
Construction added 48,000 jobs in December, well above the employment gains in recent months. Specialty trade contractors added jobs in December (+26,000), with the gain about equally split between residential and nonresidential contractors. Employment also increased in heavy and civil engineering construction (+12,000) and in nonresidential building (+10,000).
In December, manufacturing employment increased by 17,000, with durable goods
(+13,000) accounting for most of the gain. Manufacturing added an average of 16,000 jobs per month in 2014, compared with an average gain of 7,000 jobs per month in 2013.
The average workweek for all employees on private non-farm payrolls was unchanged at 34.6 hours in December. The manufacturing workweek edged down by 0.1 hour to 41.0 hours, and factory overtime edged up by 0.1 hour to 3.6 hours. The average workweek for production and non-supervisory employees on private non-farm payrolls edged up by 0.1 hour to 33.9 hours.
In December, average hourly earnings for all employees on private non-farm payrolls decreased by 5 cents to $24.57, following an increase of 6 cents in November. Over the year, average hourly earnings have risen by 1.7 percent. In December, average hourly earnings of private-sector production and non-supervisory employees decreased by 6 cents to $20.68.
The change in total non-farm payroll employment for October was revised from +243,000 to +261,000, and the change for November was revised from +321,000 to +353,000. With these revisions, employment gains in October and November were 50,000 higher than previously reported.
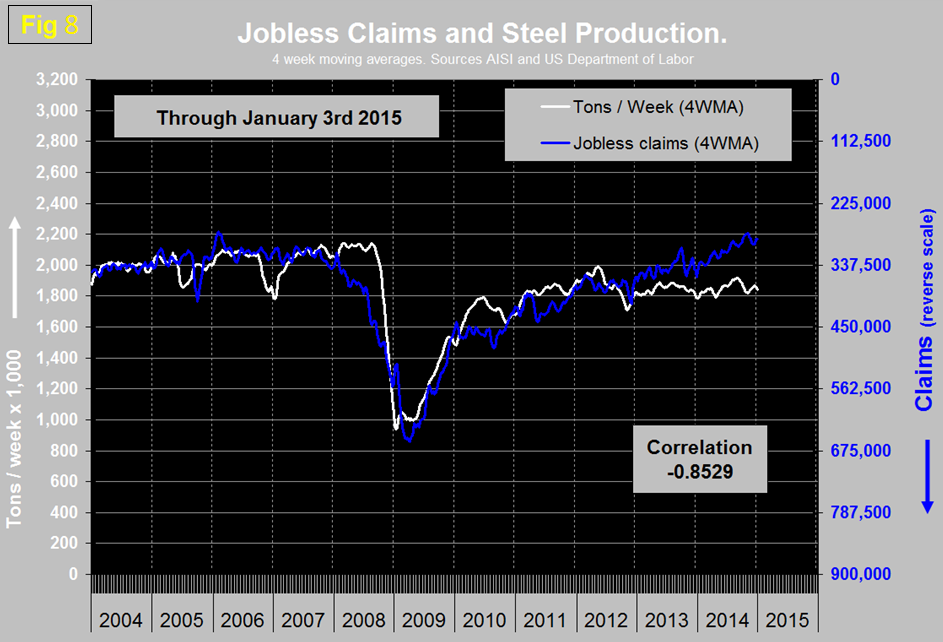
SMU Comment: The December employment report continues to look good and the job recovery is still tracking better than the recovery from the 2001 recession. Which of course it should be since the recessionary losses were much greater in 2008 and 2009. There is an inverse relationship between layoffs and steel production which had a good correlation until early 2013 when the lines began to diverge, (Figure 8).
We attribute this to the delayed recovery of construction and the increasing share being taken by imports. Note this long term relationship is not a cause and effect but simply a benchmark that has historically worked to show if steel production is where it should be given the state of the economy. The other interesting divergence in this graph is just before the recession when the labor and housing markets were clearly signaling impending doom eight months before steel demand tanked.


