Prices

December 30, 2014
2014 Steel Imports Will be 2nd Highest in History
Written by John Packard
As we move into the month of January all eyes will be on the December steel import data which will determine if 2014 goes down in history as the largest or second largest year for total steel imports in U.S. history. Prior to 2014 the record for the year with the most foreign steel imports has been held by 2006 with its 45.3 million net tons. The second largest year for foreign steel imports is currently 1998 at 42.5 million net tons. We expect 1998 to fall to third place by the time we get the final December steel import data.
For the first 11 months 2014 total steel imports were 40.6 million tons (based on US Department of Commerce Steel Import Monitoring System data). To that total we anticipate adding another 3.5 million net tons which would put 2014 into the second slot in history behind 2006.
Steel Market Update did a thorough evaluation of imports for the first 11 months of the year and then compared them against 2013 to see how we have fared by product. The results provide a clear picture as to why, even with apparent steel demand growth of 11.9 percent so far this year, we have seen prices as relatively stable as mills struggle to keep their order books full. The domestic mills have struggled as foreign steel has absorbed much of the growth. Using October as an example we saw foreign steel accounting for 31.6 percent of apparent steel supply in the United States (October is the last month we have completed numbers as final November data should be updated next week).
Last October foreign accounted for 24.3 percent of apparent steel supply. The year-over-year change shows foreign grabbing 7.3 percent larger market share from the domestic steel mills.
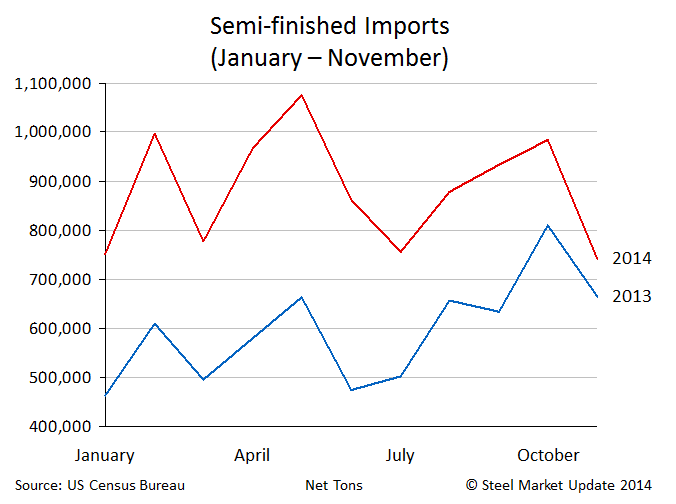
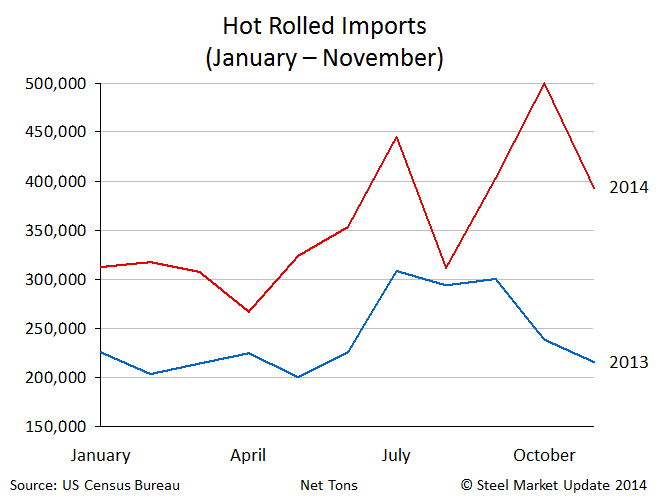
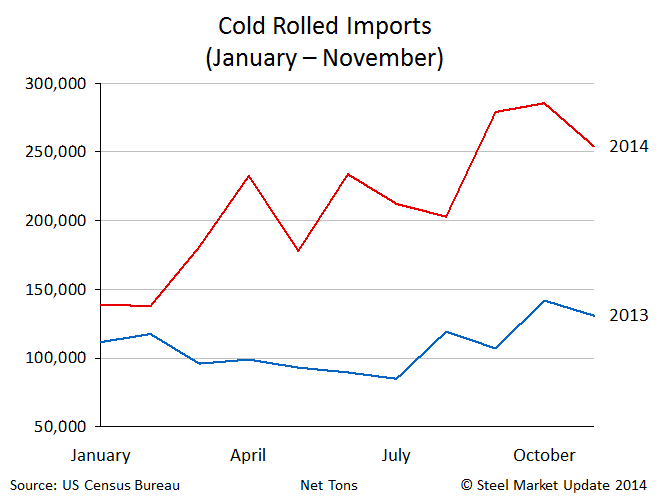
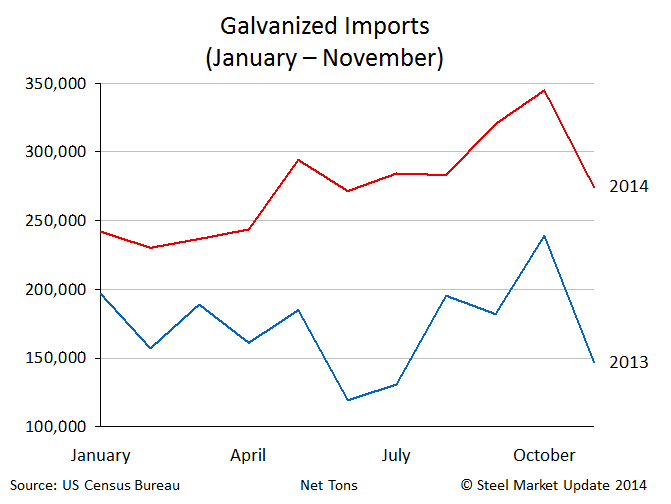
As we worked on the yearly comparisons and broke out the data by product by month we realized that the visuals are quite telling.
Semi-Finished imports (slabs) totaled 9.7 million net tons during the first 11 months 2014, this is up from 6.6 million net tons for the first 11 months 2013. This is an increase of 3.1 million tons or 48.2 percent from one year to the next.
Hot rolled imports totaled 3.9 million net tons for the first 11 months 2014. Again, this represents an increase of 1.2 million tons or 48.4 percent over the 2.7 million net tons imported into the U.S. during the first 11 months 2013.
Cold rolled imports for 2014 came in at 2.3 million net tons during the first 11 months 2014. This is 1.1 million tons more or 96.3 percent than the 1.2 million net tons received during the first 11 months 2013.
Hot dipped galvanized imports for the first 11 months 2014 were 3.0 million net tons. In the same time period last year that number was 1.9 million net tons. This is 1.1 million tons greater or 59.0 percent higher during 2014 than 2013.
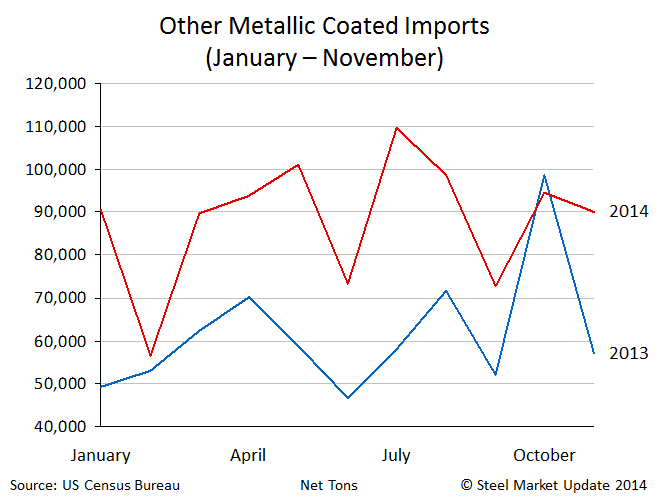
Other metallic, most of which is Galvalume, totaled 1.0 million net tons during the first 11 months 2014. This is 300,000 net tons more or 43.1 percent higher than the 700,000 tons received in 2013.


