Market Data

December 15, 2014
Currency Update for Steel Trading Nations as of December 11th 2014
Written by Peter Wright
The currency markets continue to be dominated by a strengthening dollar and a weakening of third world currencies in particular. Hyun Song Shin, who chief economist at the Bank for International Settlements in Basel, gives a lot of thought to the implications of the current situation. In recent presentations at the Brookings Institution, Mr. Shin documented the growing use of the U.S. dollar by borrowers and lenders outside of this country. U.S. banks and bond investors have lent $2.3 trillion outside the U.S. Foreign banks and foreign bond investors have lent much more: $6.5 trillion.
Here’s how Mr. Shin sees the world: “A manufacturer in an emerging market borrows in dollars, perhaps because it sells a lot of goods in dollars and sees borrowing in dollars as a hedge. A local bank lends the dollars, borrowing from some big global bank. When the emerging-market currency is strong and the dollar is weak, that manufacturer’s balance sheet looks sturdier–and the local bank sees that and lends more readily. Thus a weak dollar can lead to a global credit boom. When the dollar rises, though, all this runs in reverse, effectively tightening global financial conditions, particularly in emerging markets. The emerging-market currency falls. The manufacturer has trouble making payments on its dollar loans; so do its peers. Banks lend less readily. Capital investment stalls. Global money managers–the ones with lots of short-term wholesale deposits that search the world for the best yields–see a falling local currency and a weakening economy and pull money from the emerging-market banks. Then, global asset managers who had been lured by a high-growth story see that it is now over and do the same thing, selling emerging-market corporate bonds. That pushes up interest rates that businesses in emerging markets have to pay, and weakens them further in a vicious cycle. Long-term investors who don’t necessarily need to be leveraged can get burned when events in the financial markets translate into events in the real economy and cause a negative feedback loop,”
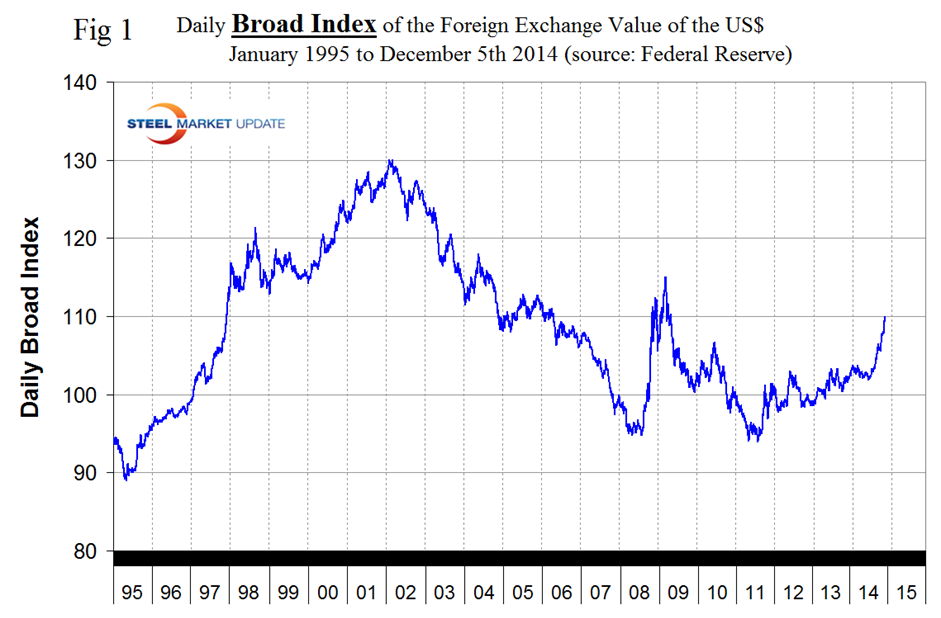
Based on the daily Federal Reserve Broad Index value of the US $ against our major trading partners we see a strengthening trend that has existed for the last three years. On February 3rd 2014, the value for the dollar was 103.8026, the index then weakened, turned around at mid-year and on December 5th (the last date published by the Fed) had achieved the highest value of the year at 109.9628. After a brief respite in late October the dollar is again continuing to go straight north and now has the highest value since the spike in early 2009. (Figure 1).
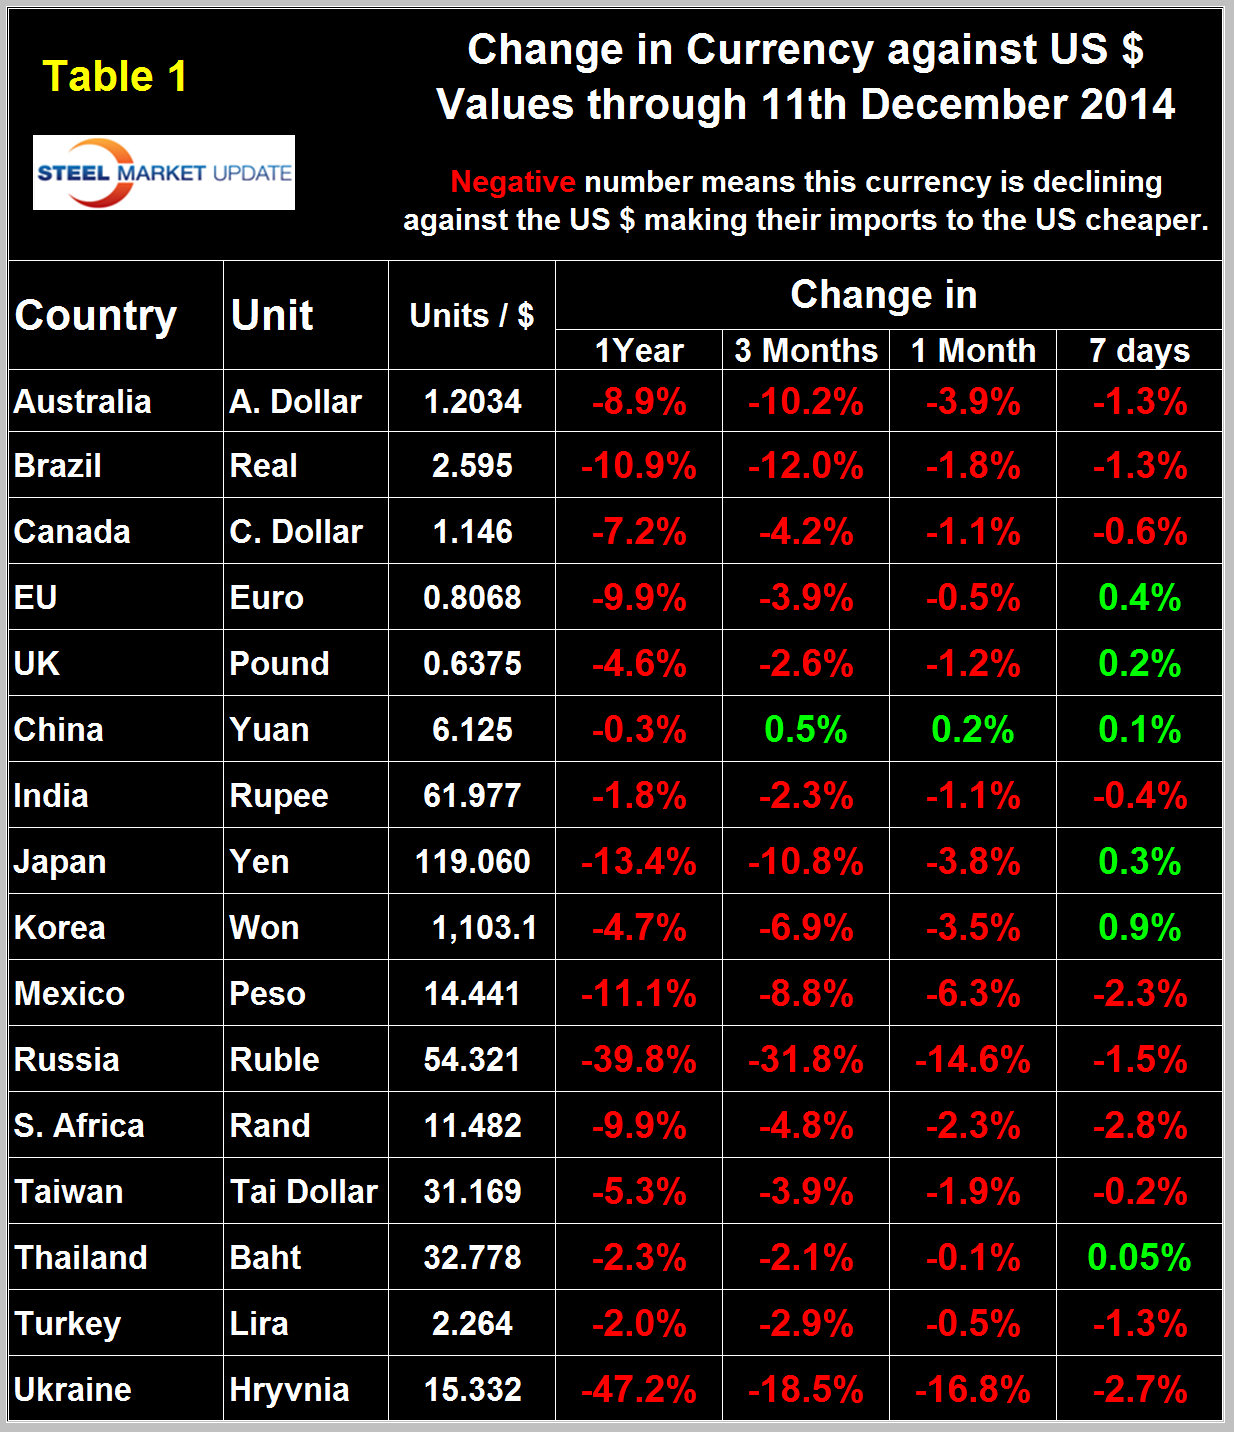
The Broad Index has strengthened by 4.9 percent in the last three months, 2.6 percent in the last month and 1.0 percent in the last seven days. It does not necessarily follow that the currencies of the steel trading nations follow the Broad Index but in the last month and three months this has been the case. In the seven days through December 11th the dollar has strengthened against ten of the sixteen steel trading nations and weakened against six. Table 1 shows the number of currency units of steel trading nations that it takes to buy one US dollar and the change in one year, three months, one month and seven days. Negative values for change indicate that the dollar is strengthening against a particular currency. An explanation of the source data is given at the end of this piece. In the last twelve months the dollar has strengthened against all sixteen currencies considered here. In the last three and one month periods it strengthened against all steel trading currencies except the Chinese Yuan. Table 1 is color coded to indicate strengthening of the dollar in red and weakening in green. We regard strengthening of the US Dollar as negative and weakening as positive because the effect on net imports.
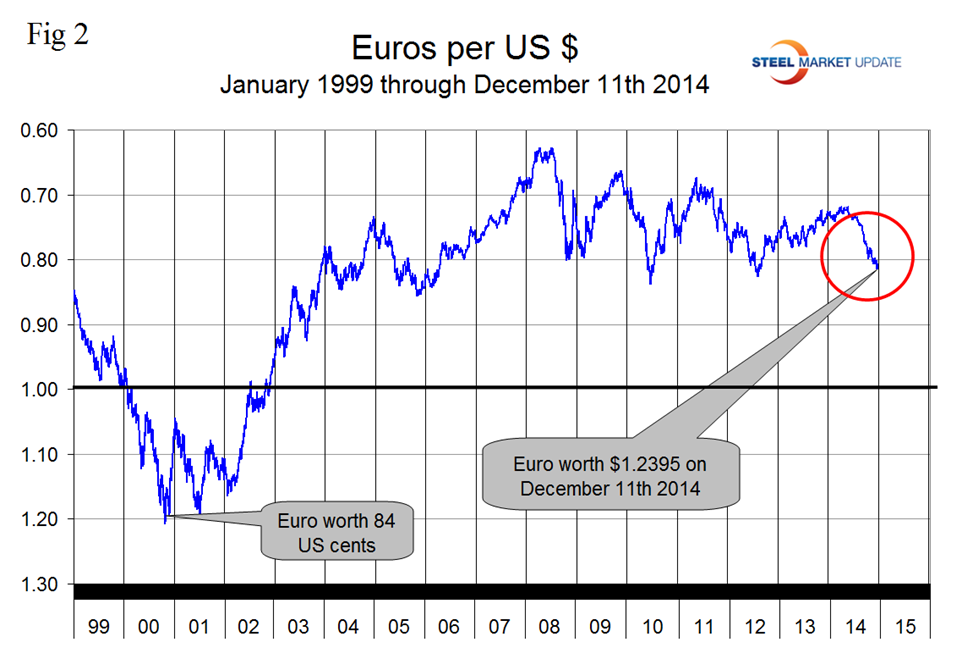
On September 6th the Euro broke through the 1.3 US $ / Euro level for the first time since July 11th last year and since our last report on November 11th when it closed at 1.2464 the currency has declined further to 1.2395. On December 11th the Euro stood at 0.8068 to the US$ and had declined by 3.9 percent in the last three months, (Figure 2). A devalued Euro means that US exports will be more expensive in Europe and European imports will be cheaper here. This is particularly true for steel trade. In addition European scrap will be more attractive to Turkish buyers than supplies from the US which will put downward pressure on domestic scrap prices.
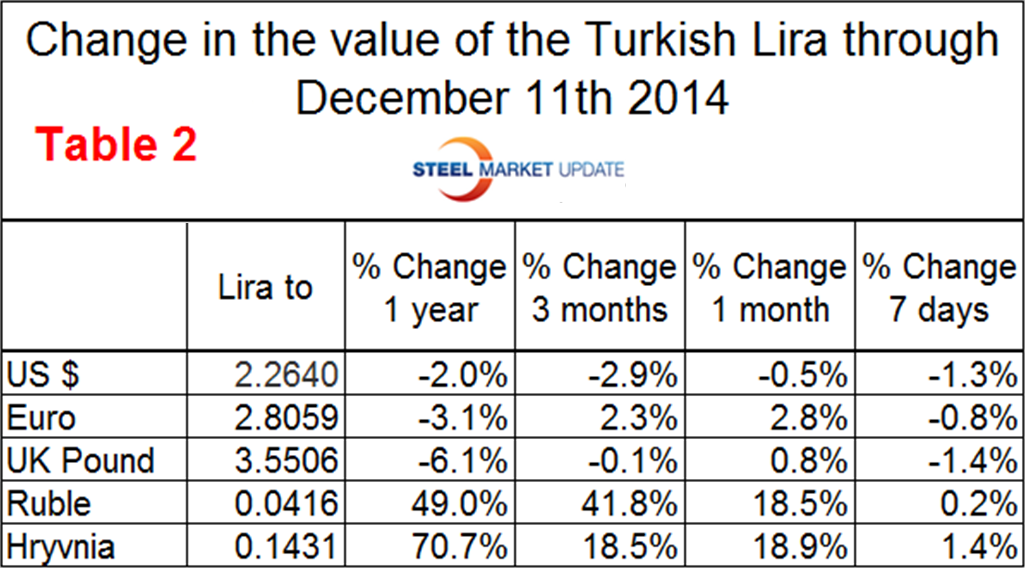
Table 2 shows how the value of the Turkish Lira has changed against its major scrap and or semi-finished suppliers.
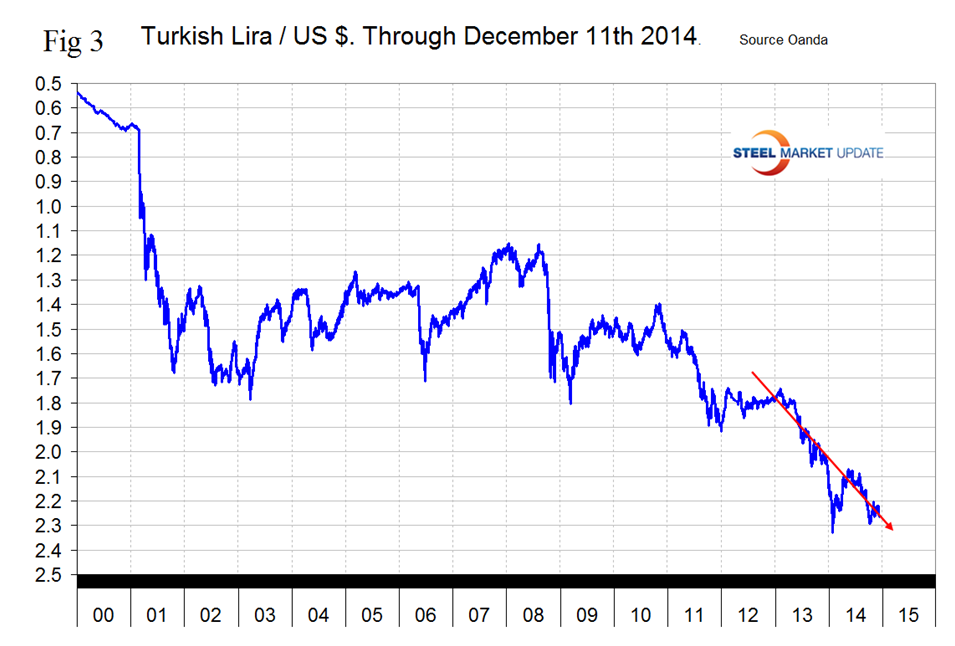
The US position as a scrap supplier has continued to deteriorate in the last three months as the Dollar has strengthened by 2.9 percent against the Lira and the Euro has weakened by 2.1 percent. This gives a European scrap dealer a relative advantage of 5 percent when competing with US East Coast yards for business in Turkey and consequently results in a decrease in both US export prices and strengthens the hand of US domestic mill buyers. The situation with the Russian Ruble is even more extreme as the Lira has strengthened by 41.8 percent against the Ruble in the last three months. This means that a Russian trader can get almost twice as many Rubles for his scrap than he did three months ago and allows him to negotiate easily for whatever business he wants from Turkey. Figure 3 shows the downward trend of the Lira against the Dollar since January 2013.
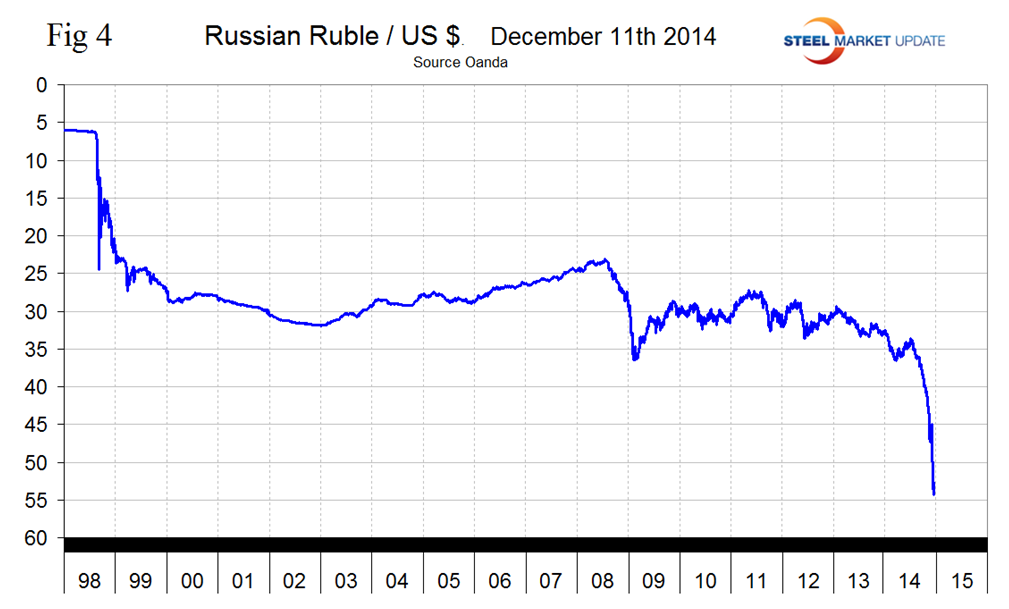
The Russian Ruble has had the largest decline of all the steel trading nations in the last three months being down by 31.8 percent against the Dollar and is in virtual free fall, (Figure 4). A month ago we reported that the Russian central bank had raised interest rates to 9.5 percent despite the very sluggish performance of the economy. On Thursday December 10th they raised it again to 10.5 percent and intensified the Ruble buyback program. These moves are intended to bolster the currency that has been hurt both by sanctions and by the drop in the price of oil which is Russia’s major export and income earner.
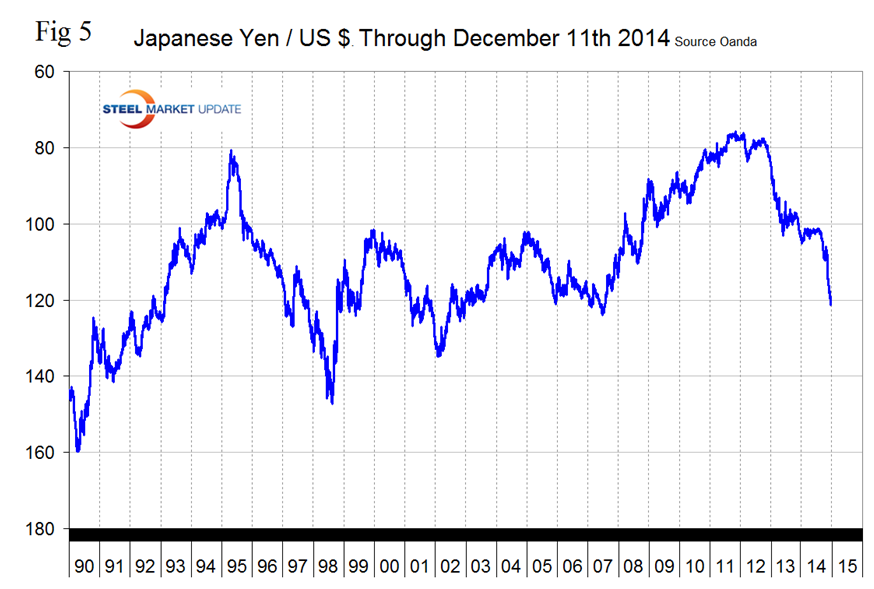
The Japanese Yen broke through the 120 level on December 6th before rallying slightly and closing at 119.06 on December 11th, (Figure 5). The Yen is down by 13.4 percent in 12 months and 10.8 percent in 3 months. Some analysts are predicting a level of 200 Yen / Dollar in the not too distant future.
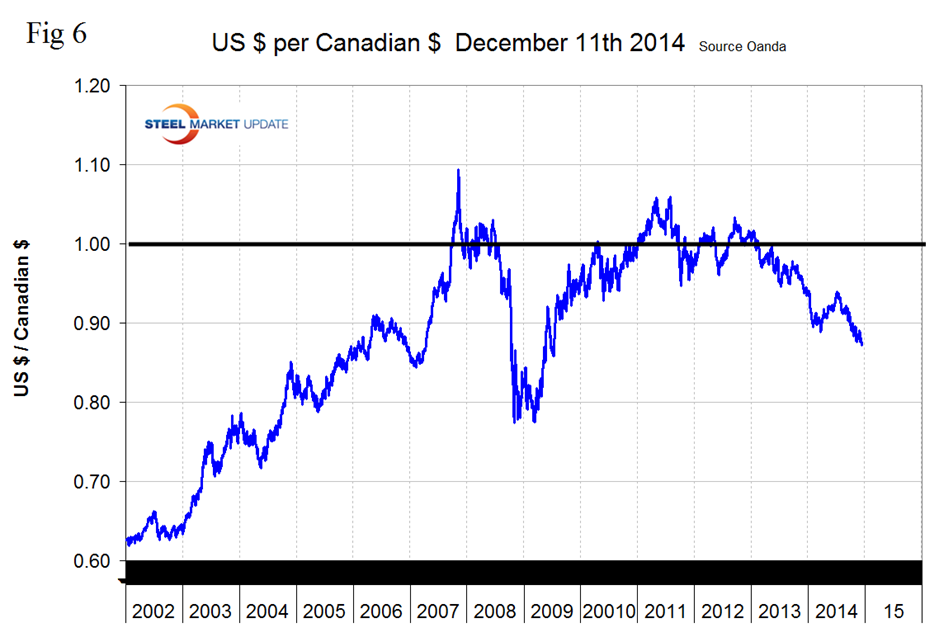
After flirting with the 90 US cent valuation early in 2014, the Canadian $ broke through that level on September 27th and has stayed there ever since. The decline has been pronounced since mid-year. On December 11th the loonie closed at 87.28 US cents down one cent since we last published this report on November 11th. The Canadian $ has declined by 7.2 percent in the last year, 4.2 percent in three months, 1.1 percent in one month and 0.6 percent in seven days, (Figure 6).
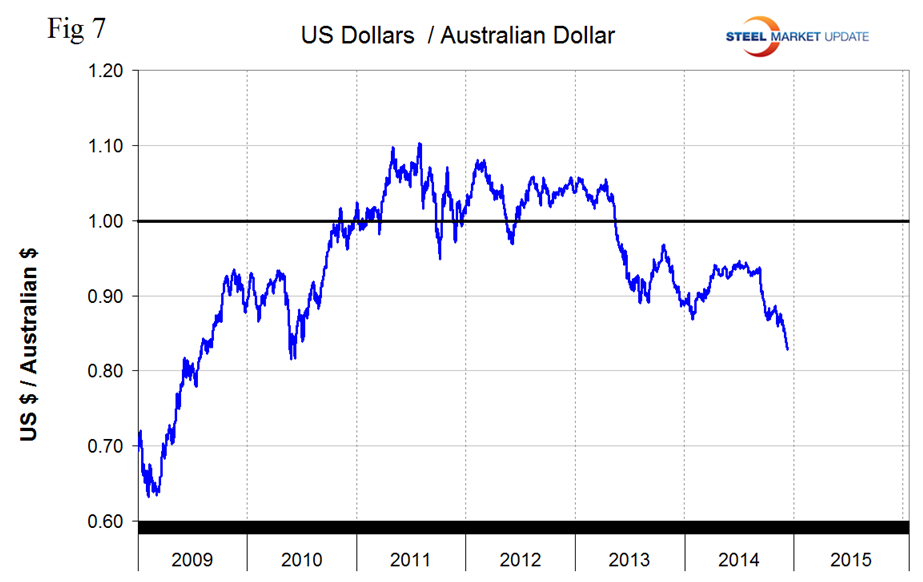
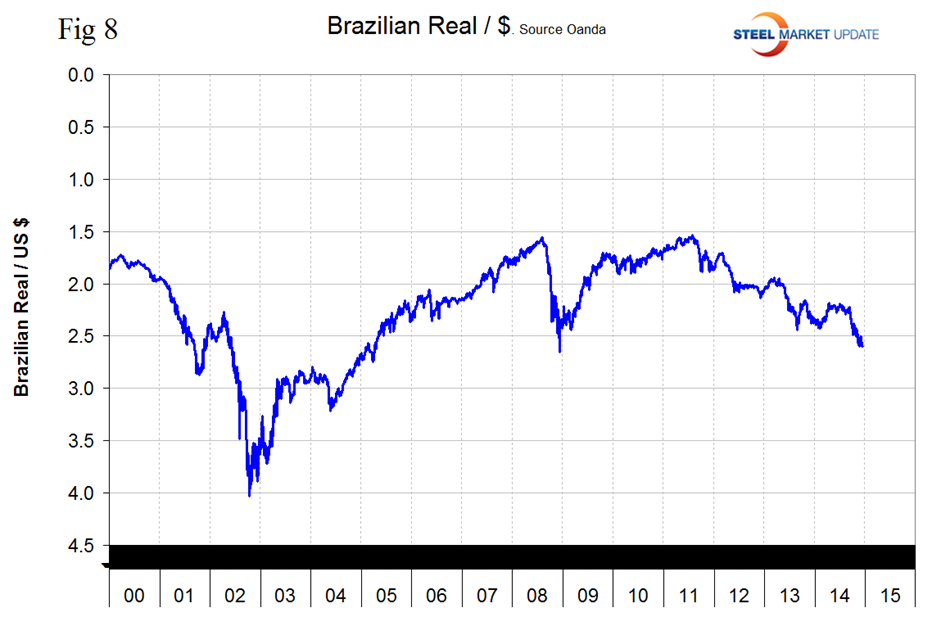
The reversal of the ‘carry-trade’ (borrow US$, buy something else higher yielding) has been well underway since the Fed announced last year that it would end QE3. Emerging country currencies have plummeted, together with commodity prices. Australian and Canadian commodity producers that borrowed heavily in USD have been doubly hit by a stronger US$ and plunging commodity prices, and their share prices have plummeted. The Australian $, (Figure 7) and Brazilian Real, (Figure 8) are being hit even harder than the Canadian $ being down by 10.2 percent and 12.0 percent respectively in the last three months.
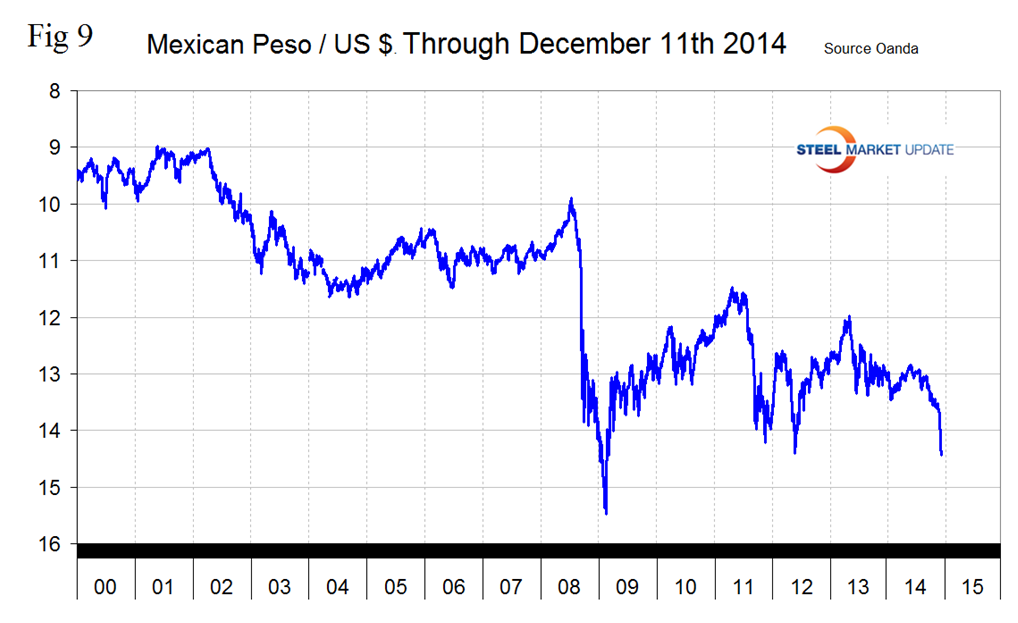
The Mexican Peso closed at 14.441 on December 11th, down by 8.8 percent in three months, and in free fall for all of December, (Figure 9). The Peso has broken through the previous low point which occurred on June 6th 2012 and is now at its lowest point since March 16th 2009.
SMU Comment: Reports in the press are not exaggerated. The US dollar is escalating rapidly in the global currency markets and against the currencies of the major steel trading nations. This not a good trend for US steel market competitiveness and will continue to drive net imports higher and raw materials prices lower. In this monthly analysis we report on the currencies that we think have the most immediate significance, but all 16 steel trading nation graphs are available on request if any reader has a special interest that we haven’t covered.
Explanation of Data Sources: The broad index is published by the Federal Reserve on both a daily and monthly basis. It is a weighted average of the foreign exchange values of the U.S. dollar against the currencies of a large group of major U.S. trading partners. The index weights, which change over time, are derived from U.S. export shares and from U.S. and foreign import shares. The data are noon buying rates in New York for cable transfers payable in the listed currencies. At SMU we use the historical exchange rates published in the Oanda Forex trading platform to track the currency value of the US $ against that of sixteen steel trading nations. Oanda operates within the guidelines of six major regulatory authorities around the world and provides access to over 70 currency pairs. Approximately $4 trillion US $ are traded every day on foreign exchange markets.


