Market Data

December 10, 2014
Supply, Mill Shipments and Net Imports of Sheet Products through October 2014
Written by Peter Wright
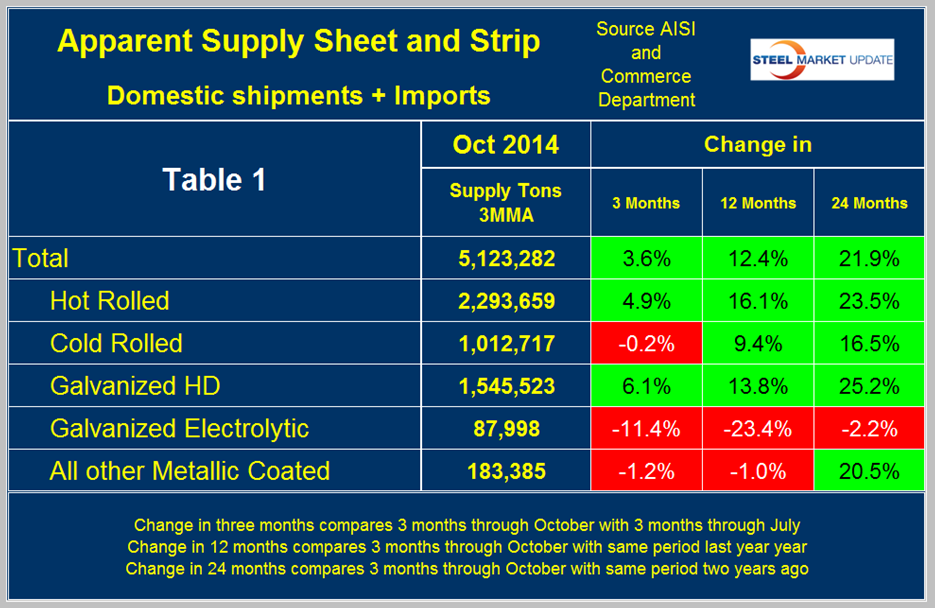
The supply of sheet products had strong positive growth in the 3 months period August through October year over year being up by 12.4 percent and led by hot band which was up by 16.1 percent (Table 1).
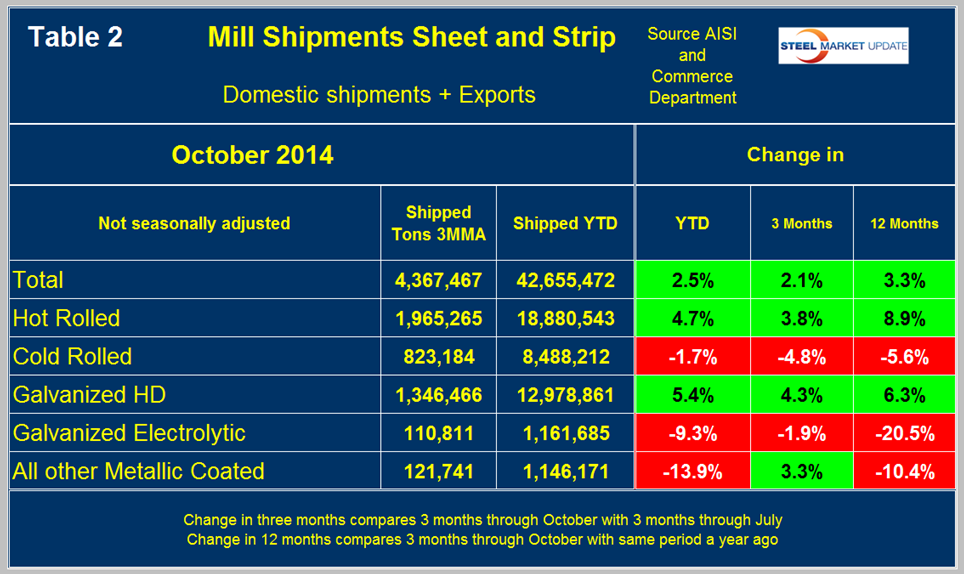
The sources of this analysis are the Commerce Department trade statistics and AISI steel shipment data. These results contrast markedly from the growth of mill shipments which are shown in Table 2. In the three months through October, mill shipments of sheet products grew by only 3.3 percent year over year. In the case of cold rolled, supply in three months through October year over year was up by 9.4 percent but mill shipments were down by 5.6 percent. In all cases imports have dominated the growth picture and for sheet products in total were up by 52.9 percent in the same period year over year.
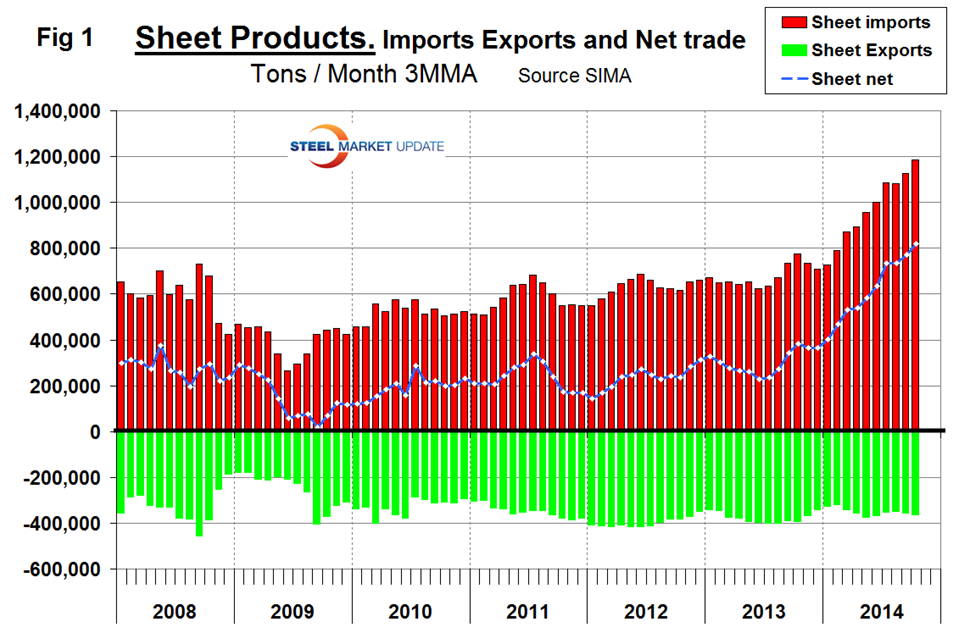
Net imports = imports minus exports, we regard this as an important look at the overall trade picture and its effect on demand at the mill level. Figure 1 shows that net sheet product imports on a three month moving average (3MMA) basis increased in October to a level double that which existed before the recession. The deterioration in net was entirely an import effect, exports have been fairly consistent since Q4 2009.
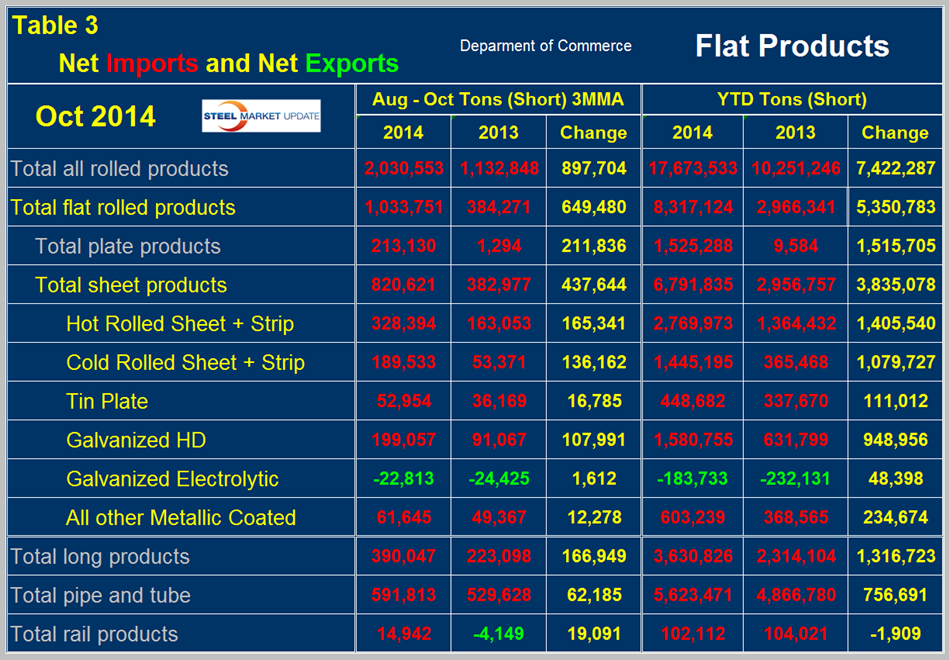
Table 3 shows net imports by product. Year to date through October, total flat rolled net imports were 8,317,124 tons of which 6,791,835 tons were sheet products. Net sheet imports more than doubled y/y being up by 3,835,078 tons. Net imports increased on all products except rail which were down slightly. Electro galvanized was the only product to have a trade surplus in 2013 and 2014 year to date but this surplus declined in 2014. In Table 1 negative net imports, (which means a trade surplus) are shown in green.
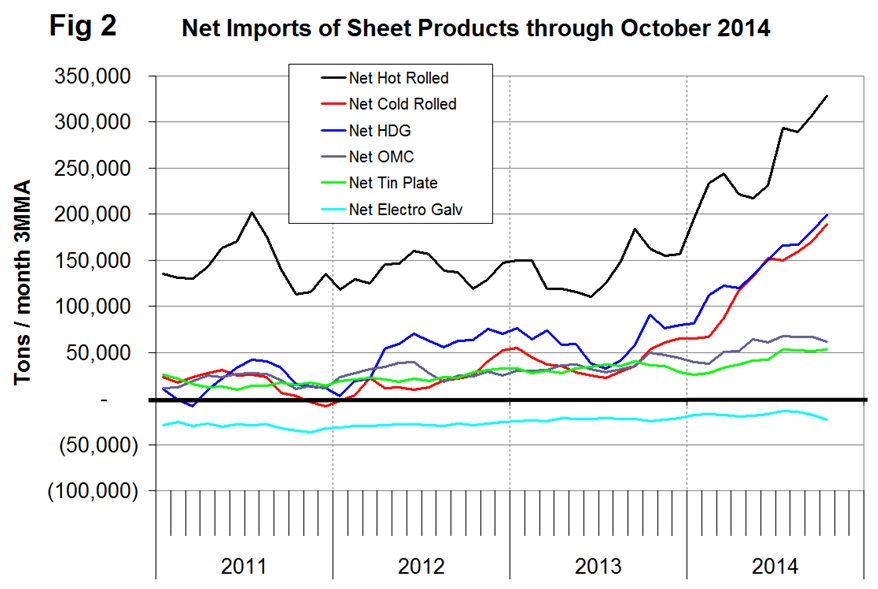
Figure 2 shows the trend of monthly net sheet product imports since January 2011 on a 3MMA basis. Hot rolled, cold rolled and EG have increased strongly this year and are far higher than at any time since we began this analysis in January 2011. The trade surplus of electro-galvanized has recovered slightly in the last three months after contracting since late 2011.
It is clear from this analysis that the domestic sheet mills are not sharing fairly in the positive market growth that has prevailed in 2014.


