Market Data

December 6, 2014
Steel Production Not Where it Should be in this Stage of the Economic Recovery
Written by Peter Wright
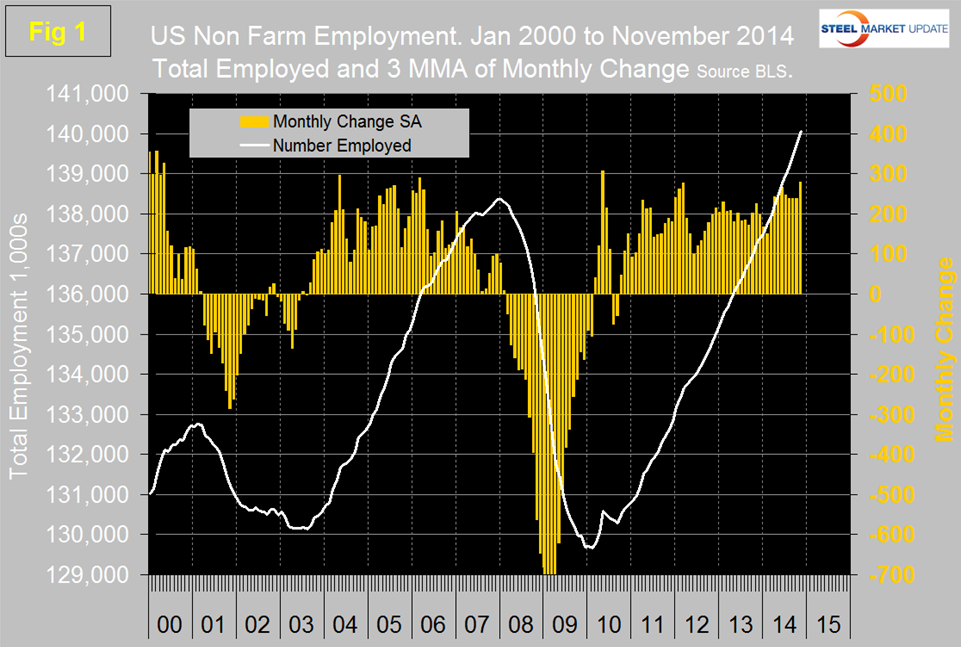
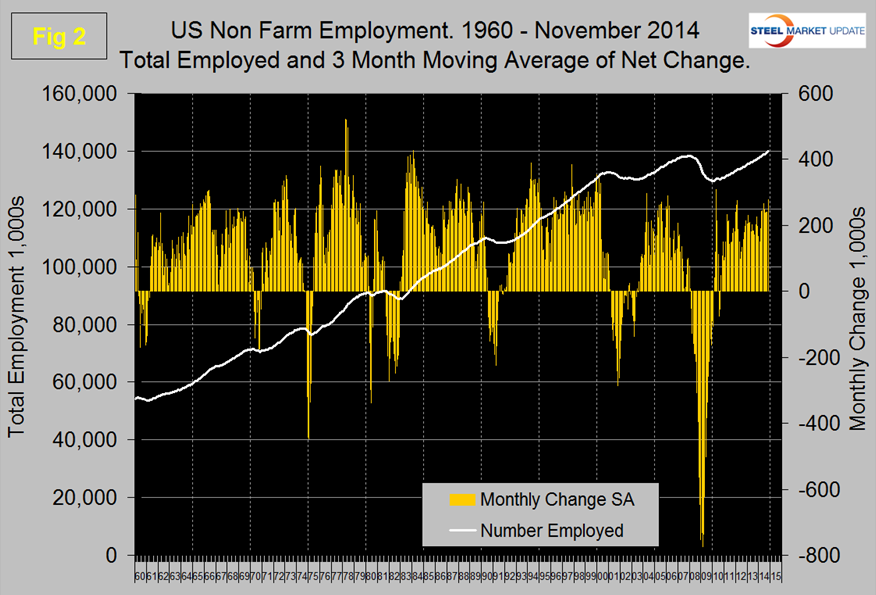
The Bureau of Labor Statistics (BLS) report on non-farm employment indicated that 321,000 jobs were added in November, October and September were revised up by a total of 44,000. The three month moving average (3MMA) of gains was the highest since May 2010 at 278,000. This job recovery is stronger than was the case in the mid-2000s, (Figure 1) and to give a bit more perspective Figure 2 shows results since 1960, it is clear that it is taking longer after each recession for the total employed to recover to the pre-recession high.
Total non-farm payrolls are now 1,680,000 more than they were at the pre-recession high of January 2008. November was the first time ever for total non-farm employment to exceed 140 million. In each of the last eight months the 3MMA has exceeded 200,000 per month and in the first ten months of 2014 has averaged 227,000. All numbers in this analysis are seasonally adjusted by the BLS.
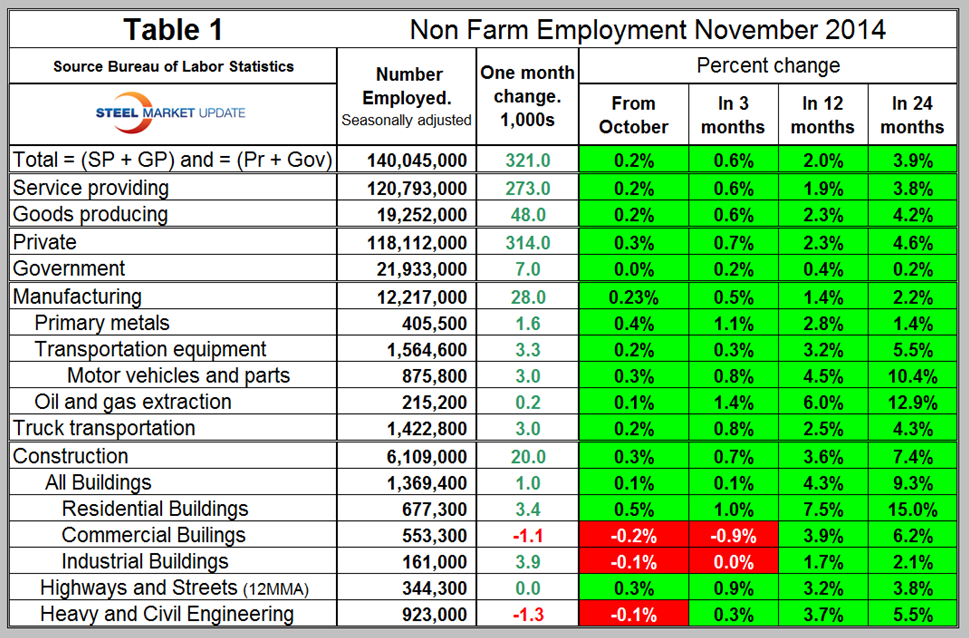
Table 1 slices total employment into service and goods producing industries and then into private and government employees. Total employment equals the sum of private and government employees. It also equals the sum of goods producing and service employees. Most of the goods producing employees work in manufacturing and construction and these sectors are further subdivided in Table 1. In November, private employment grew by 314,000 and government by 7,000. Service industries expanded by 273,000 and goods producing by 48,000 people. Private sector employment has expanded by 4.6 percent in the last 24 months as government by 0.2 percent. Government employment contracted from September 2009 through January this year but has now had ten straight months of growth. Most of the growth in government employment has been at the local level. In the first eleven months of 2014, the federal government has shed 17,000 jobs, state governments have added 16,000 and local governments have added 80,000 positions. This is a recovery process, during the recession most of the government losses were at the local level.
Manufacturing has added 164,000 jobs this year with 28,000 of those added in November. Truck transportation and transportation equipment were the strongest sectors with additions of 3,300 and 3,000 positions respectively. Note: Table 1 only identifies the major sectors in manufacturing and construction so the totals don’t add up.
Construction has added 233,000 jobs this year with 20,000 in November however the construction of commercial buildings shed 1,100 jobs in November. The strongest construction sector in November was industrial buildings with 3,900 job gains followed by residential construction that added 3,400 jobs.
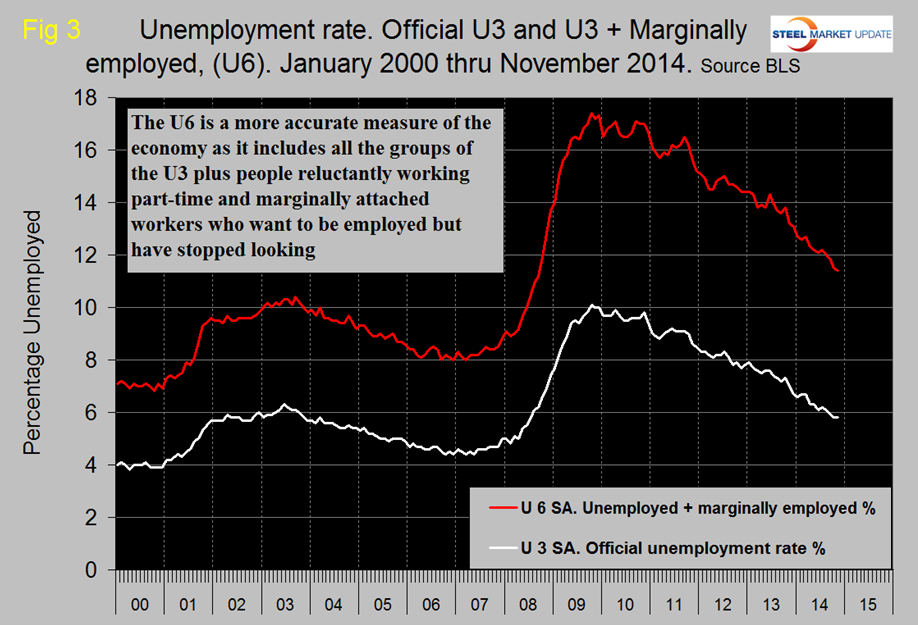
The official unemployment rate was unchanged at 5.8 percent in November and was down 5.9 percent in September and 6.1 percent in August. This is known as the “U3” rate. The more comprehensive U6 unemployment rate stands at 11.4 percent, down from 11.5 percent in October and 11.8 percent in September, (Figure 3). U6 includes workers working part time who desire full time work and people who want to work but are so discouraged that they have stopped looking. The differential between these rates was usually less than 4 percent before the recession but in 2014 has averaged 5.9 percent. The good news is that the gap is closing.
From Industry Week, November 24th. A combination of strong growth in jobs plus replacement demand for equipment from businesses will provide a stable base for overall economic growth, according to a new report released by The MAPI Foundation, the research affiliate of the Manufacturers Alliance for Productivity and Innovation. The group released its quarterly economic forecast, predicting that inflation-adjusted gross domestic product will expand 2.8 percent in 2015 and 3.0 percent in 2016. Both are declines from the August report—of 3.0 percent and 3.3 percent, respectively.
Manufacturing production is expected to outpace GDP, with anticipated growth of 3.5 percent in 2015 (a decrease from 4.0 percent in the previous forecast) and 3.9 percent in 2016 (an increase from 3.6 percent in the August report). The November 2014 report forecasts a five-year horizon in which GDP is expected to average 2.8 percent and manufacturing production to average 3.26 percent growth. “We will have full employment in 18 months and manufacturing is already there,” said MAPI Foundation Chief Economist Daniel J. Meckstroth.
“With the unemployment rate continuing to fall, the pain and suffering from the recession is dissipating. Why are businesses spending? Because consumers are spending. Also, the drop in energy prices is essentially a tax cut for us. Lower prices are a positive development.”
Production in non-high-tech manufacturing is expected to increase 3.8 percent in 2015 and 3.7 percent in 2016. High-tech manufacturing production, which accounts for approximately 5 percent of all manufacturing, is anticipated to grow 8.2 percent in 2015 and 10.0 percent in 2016.
The forecast for inflation-adjusted investment in equipment is for growth of 6.9 percent in 2015 and 7.3 percent in 2016. Capital equipment spending in high-tech sectors will also rise. Inflation-adjusted expenditures for information processing equipment are anticipated to increase by double digits in each of the next two years—12.1 percent in 2015 and 12.3 percent in 2016.
The MAPI Foundation expects industrial equipment expenditures to advance 7.6 percent in 2015 and 3.6 percent in 2016. Conversely, the outlook for spending on transportation equipment is for decreases of 0.8 percent in 2015 and 0.4 percent in 2016.
Spending on nonresidential structures is anticipated to improve by 2.6 percent in 2015 and 4.2 percent in 2016. Residential fixed investment is forecast to increase 10.2 percent in 2015 and 10.9 percent in 2016. Meckstroth anticipates 1.2 million housing starts in 2015 and 1.4 million in 2016.
Inflation-adjusted exports are anticipated to increase 3.3 percent in 2015 and 3.9 percent in 2016. Imports are expected to grow 3.6 percent in 2015 and 6.6 percent in 2016. The MAPI Foundation forecasts overall unemployment to average 5.6 percent in 2015 and 5.3 percent in 2016.
The outlook is for an increase of 202,000 manufacturing jobs in 2015, a decrease from 315,000 in the August report. Meckstroth envisions 16,000 manufacturing jobs to be added in 2016, down from 86,000 in the previous forecast.
Over the five-year period from 2015 to 2019, the MAPI Foundation forecasts an average annual increase of 66,800 manufacturing jobs.
On Friday the BLS issued the following press release:
Total non-farm payroll employment rose by 321,000 in November, and the unemployment rate was unchanged at 5.8 percent November gains compared with an average monthly gain of 224,000 over the prior 12 months. In November, job growth was widespread, led by gains in professional and business services, retail trade, health care, and manufacturing. The number of unemployed persons was little changed at 9.1 million. Over the year, the unemployment rate and the number of unemployed persons were down by 1.2 percentage points and 1.7 million, respectively.
Employment in professional and business services increased by 86,000 in November, compared with an average gain of 57,000 per month over the prior 12 months. Within the industry, accounting and bookkeeping services added 16,000 jobs in November.
Employment continued to trend up in temporary help services (+23,000), management and technical consulting services (+7,000), computer systems design and related services (+7,000), and architectural and engineering services (+5,000).
Employment in retail trade rose by 50,000 in November, compared with an average gain of 22,000 per month over the prior 12 months. In November, job gains occurred in motor vehicle and parts dealers (+11,000); clothing and accessories stores (+11,000); sporting goods, hobby, book, and music stores (+9,000); and non-store retailers (+6,000).
Health care added 29,000 jobs over the month. Employment continued to trend up in offices of physicians (+7,000), home health care services (+5,000), outpatient care centers (+4,000), and hospitals (+4,000). Over the past 12 months, employment in health care has increased by 261,000.
In November, manufacturing added 28,000 jobs. Durable goods manufacturers accounted for 17,000 of the increase, with small gains in most of the component industries. Employment in non-durable goods increased by 11,000, with plastics and rubber products (+7,000) accounting for most of the gain. Over the year, manufacturing has added 171,000 jobs, largely in durable goods.
Financial activities added 20,000 jobs in November, with half of the gain in insurance carriers and related activities. Over the past year, insurance has contributed 70,000 jobs to the overall employment gain of 114,000 in financial activities.
Transportation and warehousing employment increased by 17,000 in November, with a gain in couriers and messengers (+5,000). Over the past 12 months, transportation and warehousing has added 143,000 jobs.
Construction employment also continued to trend up in November (+20,000). Employment in specialty trade contractors rose by 21,000, mostly in the residential component. Over the past 12 months, construction has added 213,000 jobs, with just over half the gain among specialty trade contractors.
In November, the average workweek for all employees on private non-farm payrolls rose by 0.1 hour to 34.6 hours. The manufacturing workweek rose by 0.2 hour to 41.1 hours, and factory overtime edged up by 0.1 hour to 3.5 hours. The average workweek for production and non-supervisory employees on private non-farm payrolls was unchanged at 33.8 hours.
Average hourly earnings for all employees on private non-farm payrolls rose by 9 cents to $24.66 in November. Over the year, average hourly earnings have risen by 2.1 percent. In November, average hourly earnings of private-sector production and non-supervisory employees increased by 4 cents to $20.74.
The change in total non-farm payroll employment for September was revised from +256,000 to +271,000, and the change for October was revised from +214,000 to +243,000. With these revisions, employment gains in September and October combined were 44,000 more than previously reported.
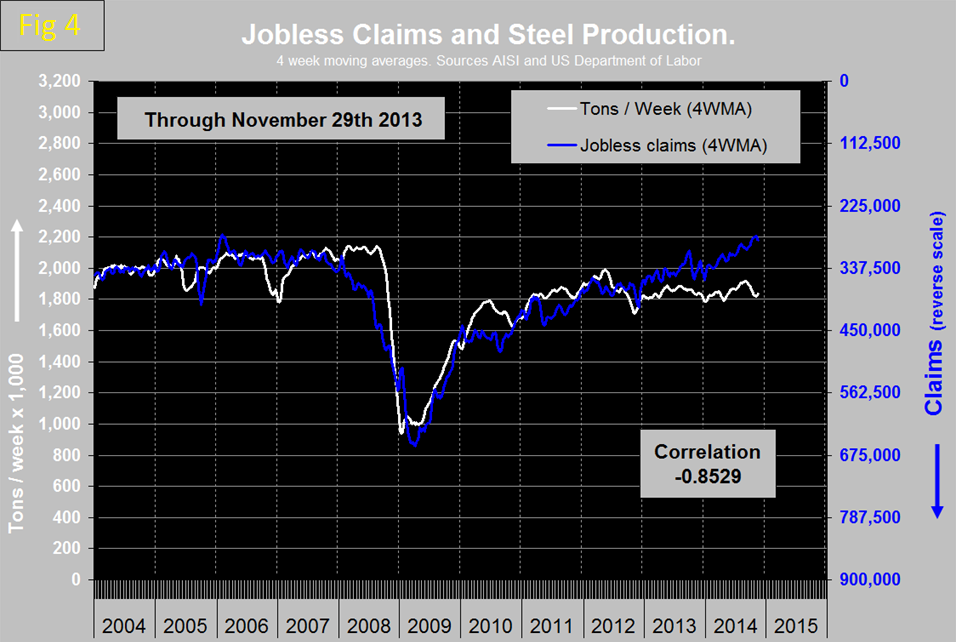
SMU Comment: The November employment report surprised on the upside and is still tracking better than the recovery from the 2001 recession. Which of course it should be since the recessionary losses were much greater in 2008 and 2009. There is an inverse relationship between layoffs and steel production which had a good correlation until early 2013 when the lines began to diverge, (Figure 4). We attribute this to the increasing share being taken by imports. Note this long term relationship is not a cause and effect but simply a benchmark that has historically worked to show if steel production is where it should be given the state of the economy. The other interesting divergence in this graph is just before the recession when the labor, (and housing) market was clearly signaling impending doom eight months before steel demand tanked.


