Market Data

November 29, 2014
November at a Glance
Written by John Packard
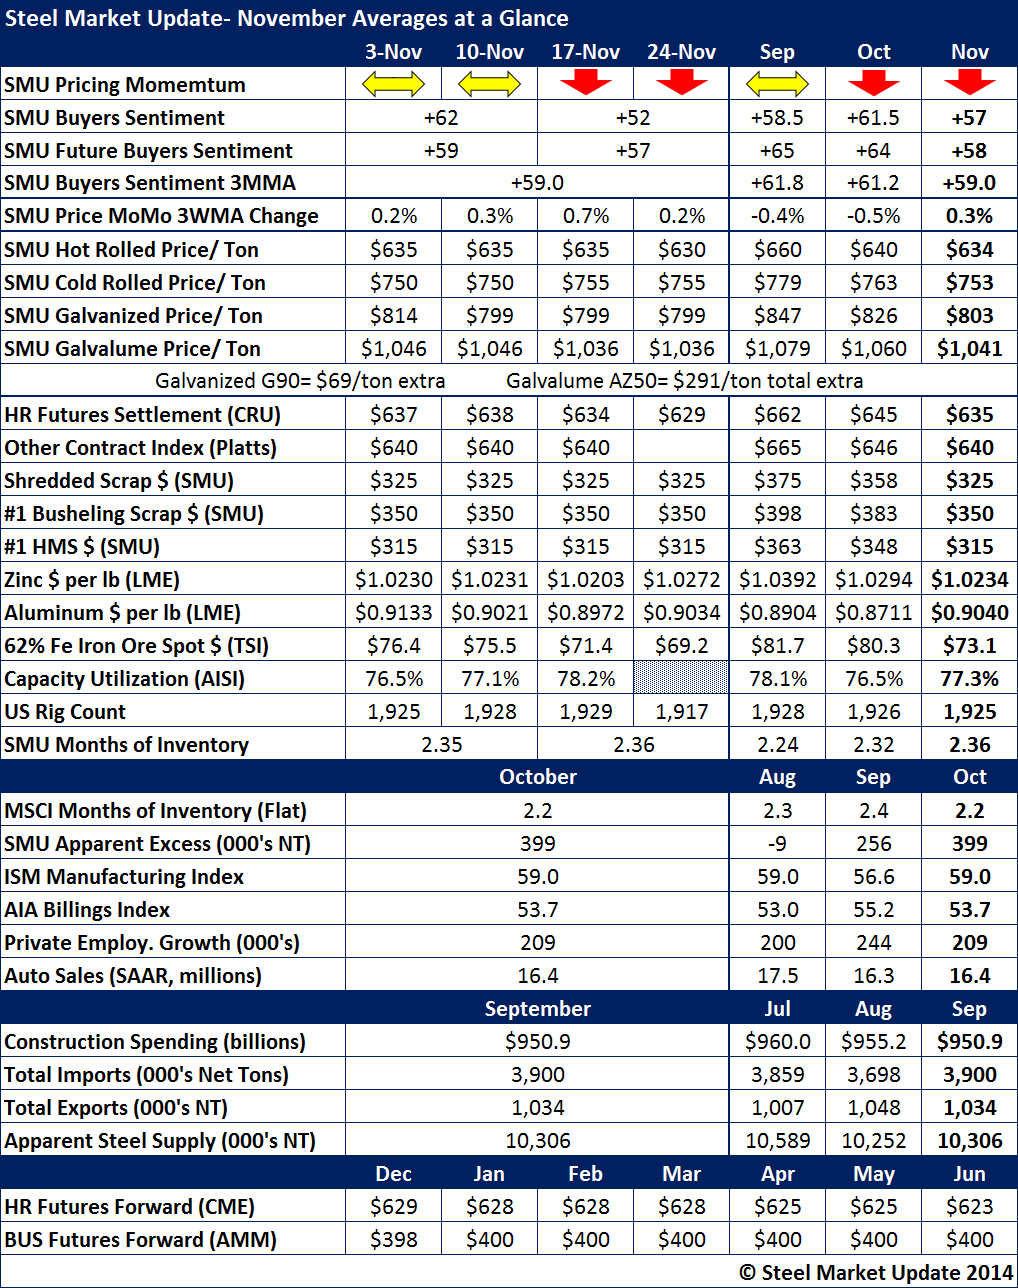
Steel Market Update (SMU) benchmark hot rolled coil pricing averaged $634 per ton ($31.70/cwt) for the month of November. CRU HRC averaged $635 per ton ($31.75/cwt) while Platts averaged $640 per ton ($32.00/cwt).
Hot rolled prices at $630 per ton as of the last week of the month, were $5 per ton lower than where they were when the market started and $10 per ton lower than the prior month’s average.
Key commodities that affect steel prices and/or mill profits have been steadily dropping over the past couple of months. Shredded and #1 busheling scrap prices are down $50 as of the end of November compared to where they were at the end of September. SMU forecast for scrap is for prices to trend sideways to down $10 per gross ton during the month of December.
Spot iron ore dropped to its lowest level in at least 5 years with 62% Fe fines trading at $69.20 per dry metric ton as the month came to a close.
SMU Steel Buyers Sentiment Index 3 month-moving-average (3MMA) dropped for the third consecutive month.
Based on the SMU proprietary model, we see service center flat rolled inventories as being +399,000 tons in over supply (apparent excess). This is one of our Premium level products for those who want more depth and forecasting from SMU. If you are interested in learning more about Premium level membership please contact our office: info@SteelMarketUpdate.com or by phone: 800-432-3475.