Market Data

November 19, 2014
SMU Service Center Apparent Inventory Excess/Deficit Revue and Forecast
Written by John Packard
The Metal Service Center Institute (MSCI) reported flat rolled steel inventories earlier this week. Steel Market Update then reviews the data and incorporates the information into a proprietary model which assists us in determining whether inventories are short (deficit) or long (excess) based on what our model is telling us.
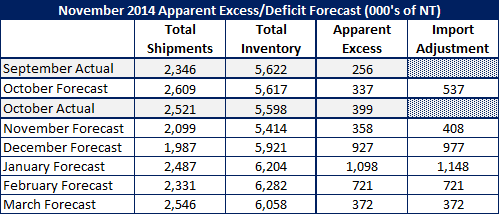
When September ended we were showing service center flat rolled inventories with an Apparent Excess of +256,000 tons.
![]() For October, SMU had forecast shipments to be 6 percent higher YOY and we forecast total flat rolled shipments would be 2,609,000 tons. The numbers released this week indicate that we over-projected the strength of the flat rolled market as distributors shipped 2,521,000 tons. Shipments improved by 2.4 percent year-over-year.
For October, SMU had forecast shipments to be 6 percent higher YOY and we forecast total flat rolled shipments would be 2,609,000 tons. The numbers released this week indicate that we over-projected the strength of the flat rolled market as distributors shipped 2,521,000 tons. Shipments improved by 2.4 percent year-over-year.
When it came to inventory we forecast that daily receipts would grow by 5 percent YOY which would result in a flat inventory situation over September prior to any import adjustments. Inventories came in at 5,598,000 tons which were 23,800 tons (we rounded up to 24,000 in our table below) less than September 2014 (SMU Note: this is where we mistakenly reported the numbers as being +238,000 in last night’s Executive issue of SMU)
Our Apparent Inventory Excess forecast called for an excess inventory of +337,000 tons and then we added an additional 200,000 tons to accommodate foreign imports sitting at the docks which we felt would need to be absorbed into inventory. This took our total excess forecast up to +537,000 tons.
The actual inventory excess for the month of October was +399,000 tons, 62,000 tons more than our forecast without adjusting for any foreign imports and 138,000 tons less than our adjusted forecast.
As we look out to November, December and then into 2015 we have adjusted our model slightly. We have scaled back our shipment forecast to +4 percent in November and then +3 percent in December with January, February and March at +5 percent. Again, the forecast is against the same month last year.
Inventory receipts are at +5 percent over the previous year rate and we have taken our import inventory adjustment down to 50,000 tons for November, December and January and then zero adjustment after January.
As you can see from the table below, if correct, our forecast calls for growing inventories in November, December and January and then to drop back in February and March.