Market Data

November 12, 2014
Currency Update for Steel Trading Nations November 11th 2014
Written by Peter Wright
Explanation of data sources: The broad index is published by the Federal Reserve on both a daily and monthly basis. It is a weighted average of the foreign exchange values of the U.S. dollar against the currencies of a large group of major U.S. trading partners. The index weights, which change over time, are derived from U.S. export shares and from U.S. and foreign import shares. The data are noon buying rates in New York for cable transfers payable in the listed currencies. At SMU we use the historical exchange rates published in the Oanda Forex trading platform to track the currency value of the US $ against that of sixteen steel trading nations. Oanda operates within the guidelines of six major regulatory authorities around the world and provides access to over 70 currency pairs. Approximately $4 trillion US $ are traded every day on foreign exchange markets.
The reversal of the ‘carry-trade’ (borrow US$, buy something else higher yielding) has actually been well underway since the Fed announced last year that it would end QE3. Emerging country currencies have plummeted, together with commodity prices. Australian and Canadian commodity producers that borrowed heavily in USD have been doubly hit by a stronger US$ and plunging commodity prices, and their share prices have plummeted.
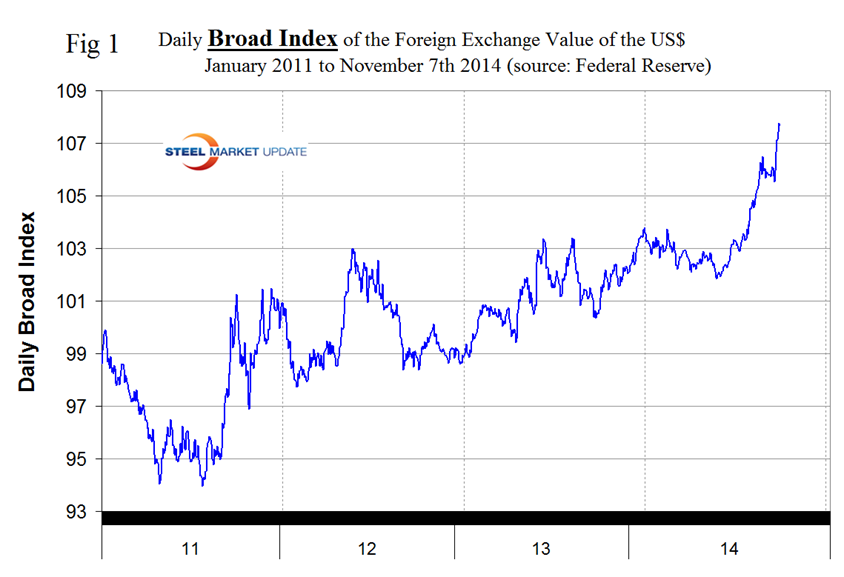
Based on the daily Federal Reserve Broad Index value of the US $ against our major trading partners we see a strengthening trend that has existed for the last three years. On February 3rd 2014, the value for the dollar was 103.8026, the index then weakened, turned around at mid-year and on November 7th (the last date published by the Fed) had achieved the highest value of the year at 107.671. After a brief respite in late October the dollar is again continuing to go straight north. (Figure 1).
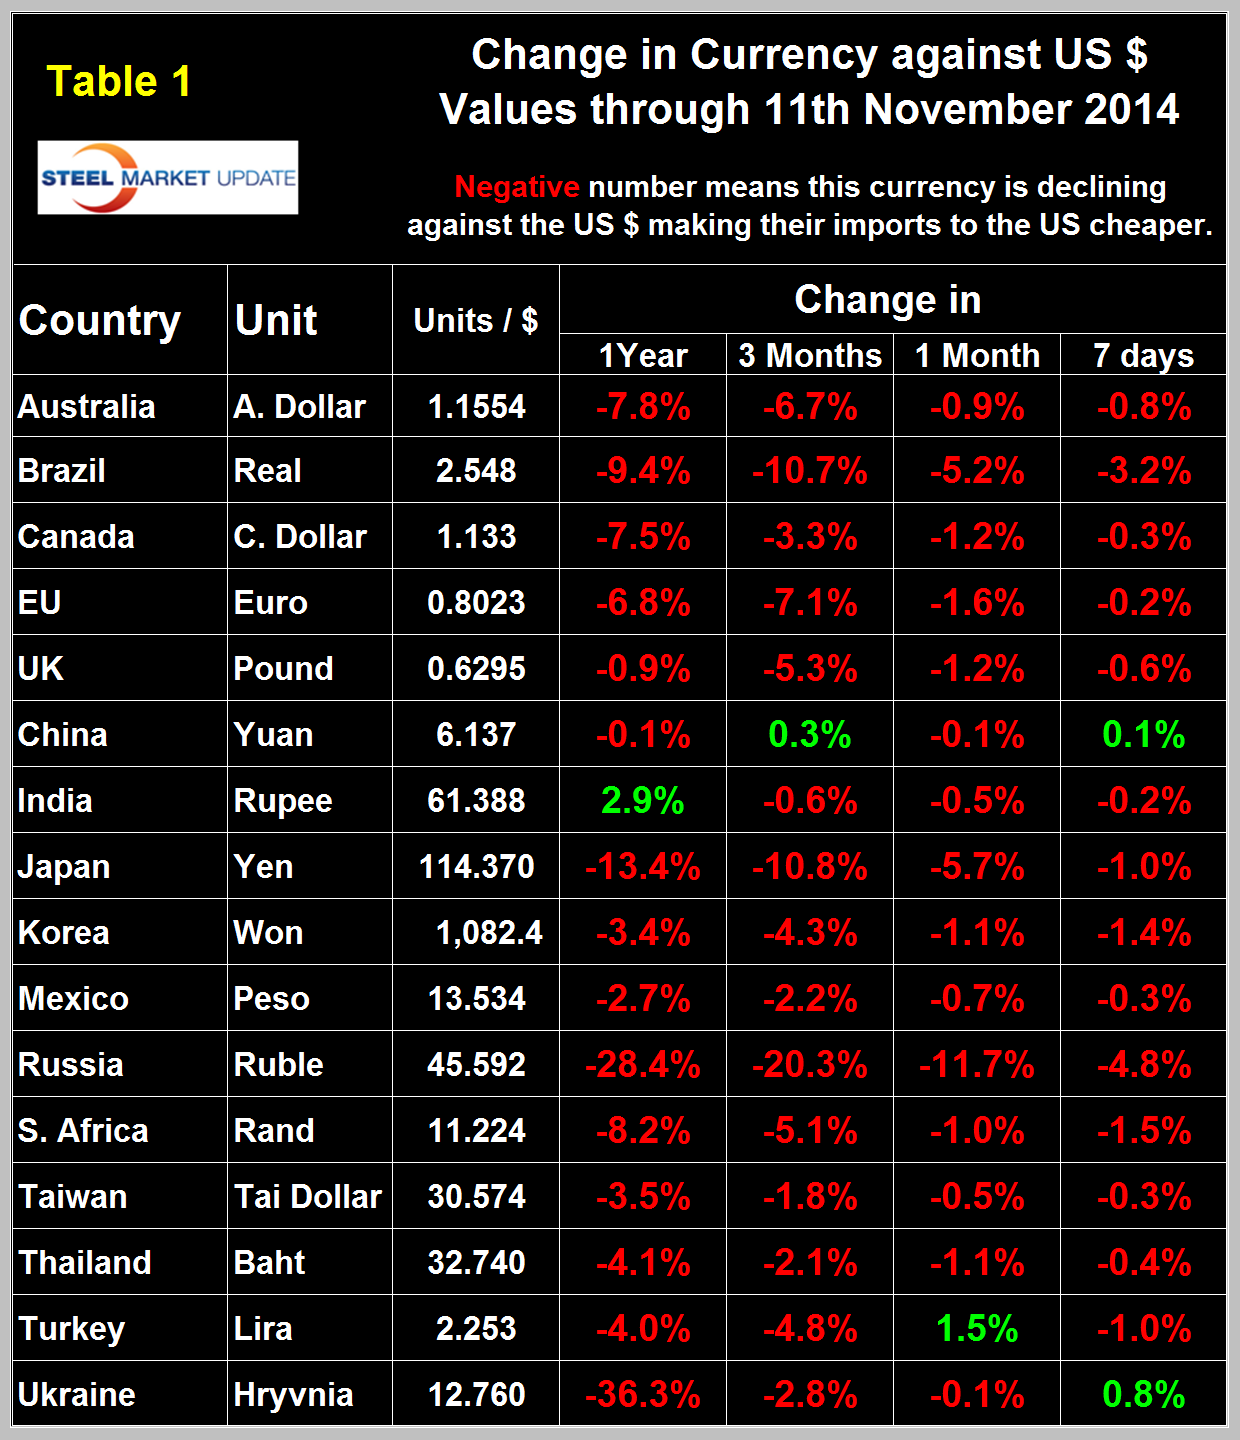
The Broad Index has strengthened by 4.6 percent in the last three months, 1.7 percent in the last month and 0.5 percent in the last seven days. It does not necessarily follow that the currencies of the steel trading nations follow the Broad Index but in the last seven days, month and three months this has been the case. In the last seven days the dollar has strengthened against fourteen of the sixteen steel trading nations. In the seven days before we last published this analysis on October 11th the dollar had weakened against twelve of the sixteen. Table 1 shows the number of currency units of steel trading nations that it takes to buy one US dollar and the change in one year, three months, one month and seven days. Negative values for change indicate that the dollar is strengthening against a particular currency. In the last twelve months, three months and one month through November 11th, the dollar has strengthened against 15 of the steel trading currencies. Table 1 is color coded to indicate strengthening of the dollar in red and weakening in green. We regard strengthening of the US Dollar as negative and weakening as positive because the effect on net imports.
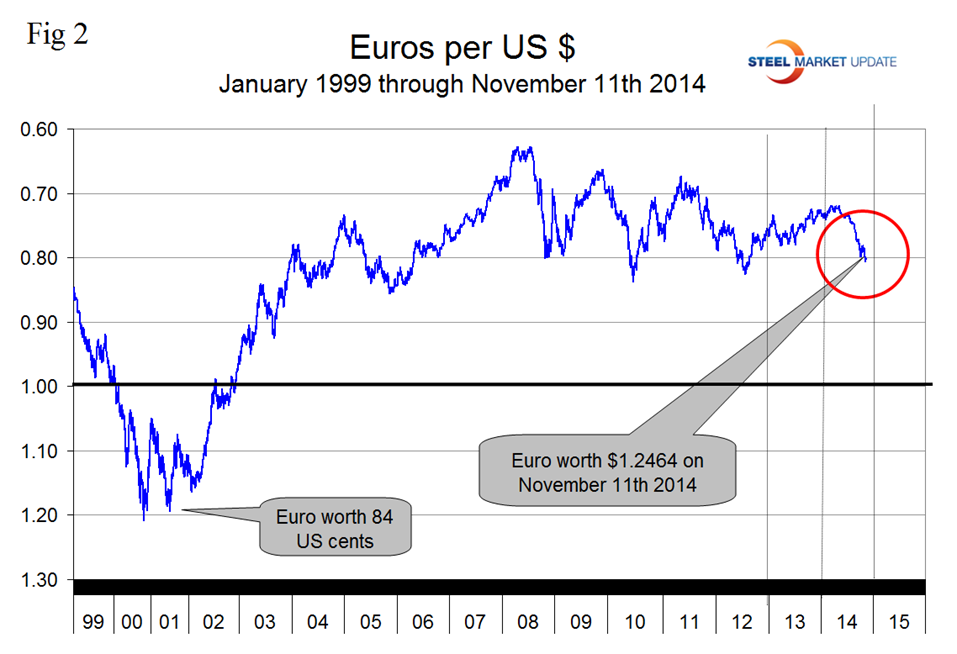
On September 6th the Euro broke through the 1.3 US $ / Euro level for the first time since July 11th last year and closed at 1.2464 on November 11th. On November 11th the Euro stood at 0.8023 to the US$ and had declined by 7.1 percent in the last three months, (Figure 2).
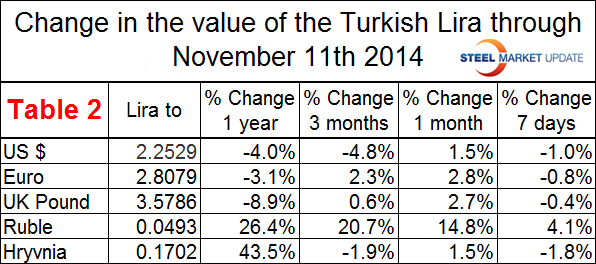
A devalued Euro means that US exports will be more expensive in Europe and European imports will be cheaper here. This is particularly true for steel trade. In addition European scrap will be more attractive to Turkish buyers than supplies from the US which will put downward pressure on domestic scrap prices. Table 2 shows how the value of the Turkish Lira has changed against its major scrap and or semi-finished suppliers.
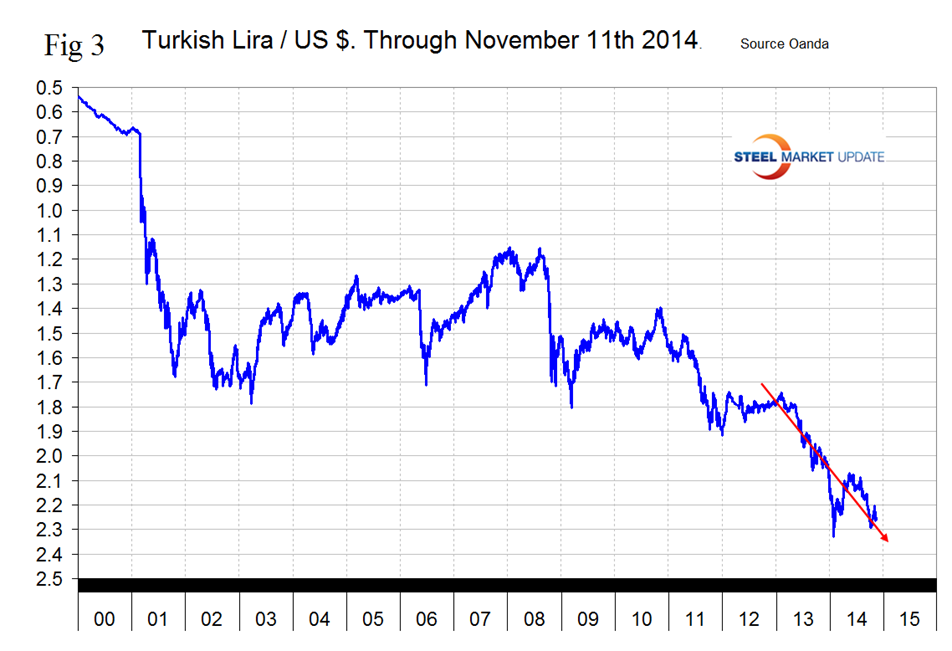
The US position as a scrap supplier has deteriorated strongly in the last three months as the Dollar has strengthened by 4.8 percent against the Lira and the Euro has weakened by 2.3 percent. In the mind of a Turkish scrap buyer this is a move of 7.1 percent which is huge as Turkish steel producers struggle to compete with Chinese steel entering the Middle East. The situation with the Russian Ruble is even more extreme as the Lira has strengthened by 20.7 percent against the Ruble in the last three months. Figure 3 shows the downward trend of the Lira against the Dollar since January 2013.
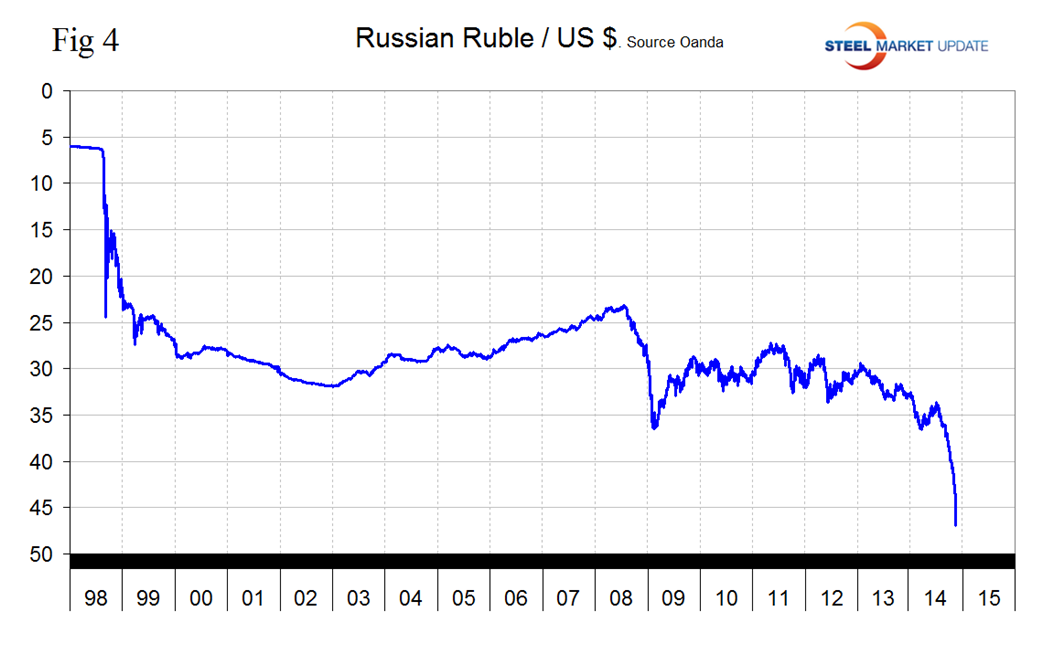
The Russian Ruble has had the largest decline of all the steel trading nations in the last three months being down by 20.3 percent against the Dollar and is in virtual free fall, (Figure 4). The Russian central bank just raised interest rates to 9.5 percent despite the very sluggish performance of the economy. The move was taken to bolster the Ruble that has been hurt both by sanctions and by the drop in the price of oil which is Russia’s major export and income earner.
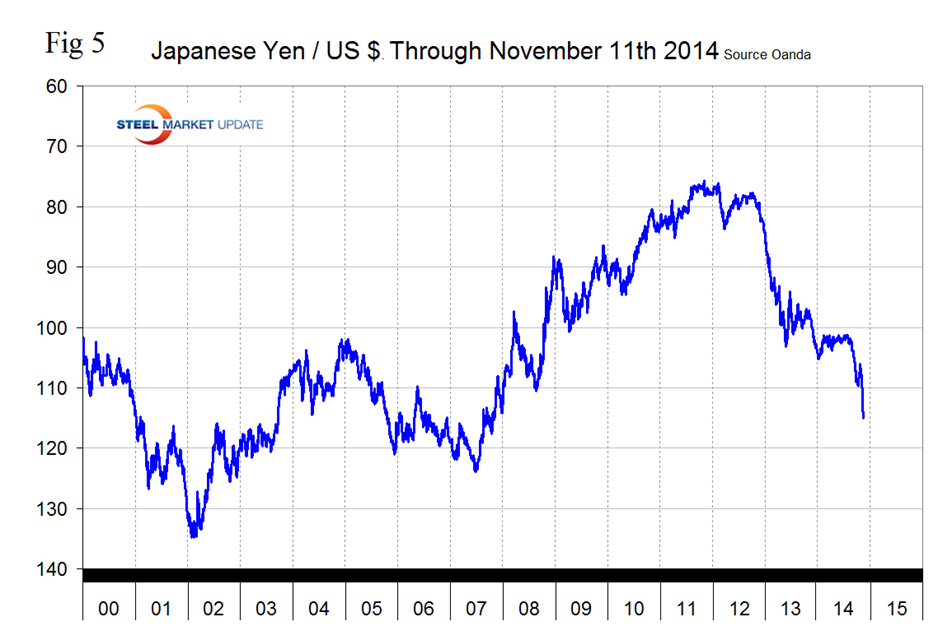
The Japanese Yen broke through the 110 level on November 1st and by the 11th had free fallen to 114.37, (Figure 5). The Yen is down by 13.4 percent in 12 months and 10.8 percent in 3 months. Some analysts are predicting a level of 200 Yen / Dollar in the not too distant future. In a surprise move early this month the Bank of Japan dramatically increased the size of the quantitative easing program that it has been conducting. This sent Japanese stocks soaring and the Japanese yen plunging, causing the yen to collapse to a seven year low. Essentially what the Bank of Japan has done is declare a currency war and in every currency war there are winners and there are losers. In Seoul, shares of auto makers Hyundai Motor and Kia Motors fell 5.9 percent and 5.6 percent, in response to the Japanese move. South Korean and Japanese companies often compete head-to-head in the same product groups in global markets, notably cars and electronics goods. From the Bank of Japan’s standpoint, “you’re giving your industry a head start relative to someone else’s,” said Markus Rosgen, regional head of equity strategy at Citi in Hong Kong. “The perception in the equity market will be that South Korea will have to take a hit from the lack of competitiveness versus the Japanese. Without a doubt, the Japanese are desperate. Their economic decline has lasted for decades, and their debt levels are off the charts. In such a situation, printing more money seems like such an easy solution. But as history has shown us, wild money printing always ends badly. Remember what happened in the Weimar Republic and in Zimbabwe.”
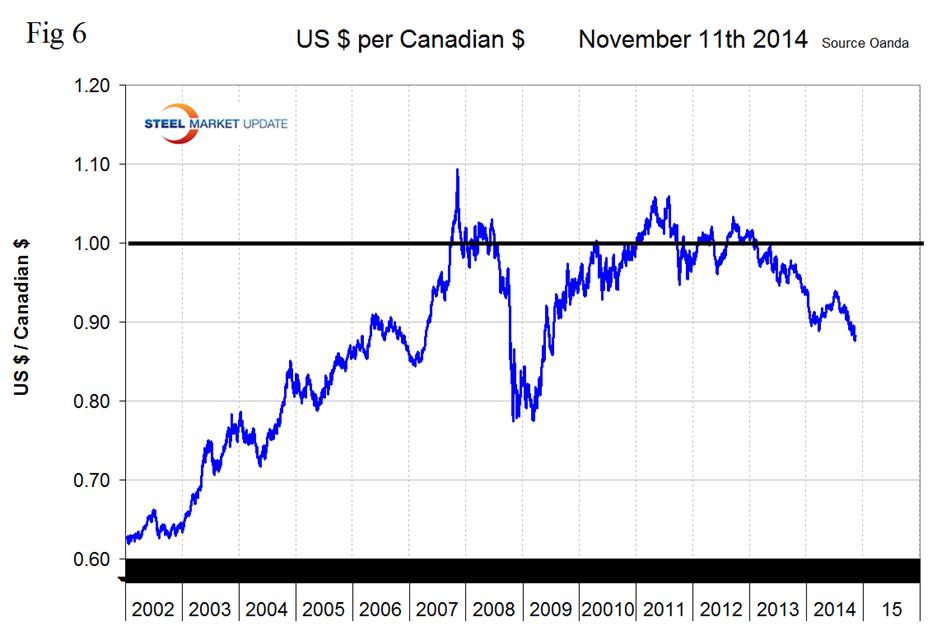
After flirting with the 90 US cent valuation early in 2014, the Canadian $ broke through that level on September 27th and stayed there. On November 11th the loonie closed at 88.28 US cents, down by 7.5 percent in 12 months and by 3.3 percent in three months, (Figure 6).
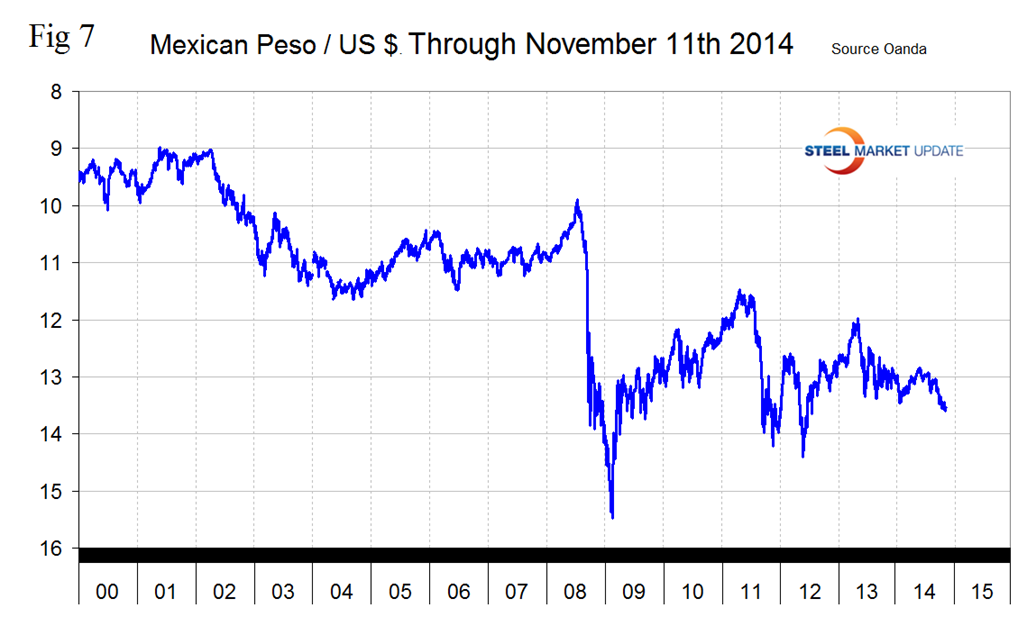
The Mexican Peso closed at 13.5338 on November 11th, down by 2.16 percent in three months, (Figure 7) and is now at its lowest point in over two years.
On October 14, 2014 John Mauldin wrote, “One of the biggest drivers of economic fortunes in the global economy is the currency markets. The value of your trading currency affects every aspect of your business and investments. It is fundamental in nature. While most Americans never even see a piece of foreign currency, every time we walk into Walmart, we are subject to the ebb and flow of global currency valuations, as are Europeans and indeed every person who participates in the movement of goods and services around the globe. In fact, globalization means that currency values are more important than ever. The world is more tightly interconnected now than it has ever been, which means that events which previously had no effect upon global affairs can trigger cascades of events that affect everyone.
I believe we are in the early stages of a profound currency-valuation sea change. I have lived through five major changes in the value of the dollar in the 45 years since Nixon closed the gold window. And while we are used to 40 percent to 50 percent moves in the stock market and other commodity prices happening in just a few years (or less), large movements in major trading currencies typically take many years, if not decades, to develop. I believe we are in the opening act of a multi-year US dollar bull market.
We all know the story of the boy who cried “Wolf!” once too often. I have been pounding the table about a dollar bull market for about three years now. I see eyes roll when I speak at conferences around the world and boldly forecast that the dollar is going to get stronger than anyone in the room can possibly fathom. All the signs have been pointing to it, and indeed we’ve seen the dollar move upward in a rather herky-jerky fashion off the lows of 2010, but not in a way that has been all that dramatic (except, arguably, against the Japanese yen). Indeed, the relative trading range of the dollar has been relatively constrained over the past six to seven years, pivoting around 80 on the DXY (symbol for the US dollar spot index).
This is in contrast to the true doom-and-gloomers, who are forecasting “the Demise of the Dollar.” At the same time, they are calling for an unseemly rise in interest rates, and many of them believe the Federal Reserve will push us over the brink into hyperinflation. Needless to say, then, you should buy massive amounts of gold and get your money out of the country.
I have had long conversations with many who believe in such a scenario. I call some of them close friends, even if we disagree on something as fundamental as the future of the dollar. I’ve come to the conclusion that their conviction is a lot like a religious belief. I’m not going to change them, and so I make very little effort to try.”
SMU Comment: The US dollar is escalating rapidly in the global currency markets and against the currencies of the major steel trading nations. This not a good trend for US steel market competitiveness and will continue to drive net imports higher. In this monthly analysis we show the trends that we think have the most immediate significance, but all 16 steel trading nation graphs are available on request if any reader has a special interest that we haven’t covered.


