Market Data

October 7, 2014
Net Job Creation through September 2014
Written by Brett Linton
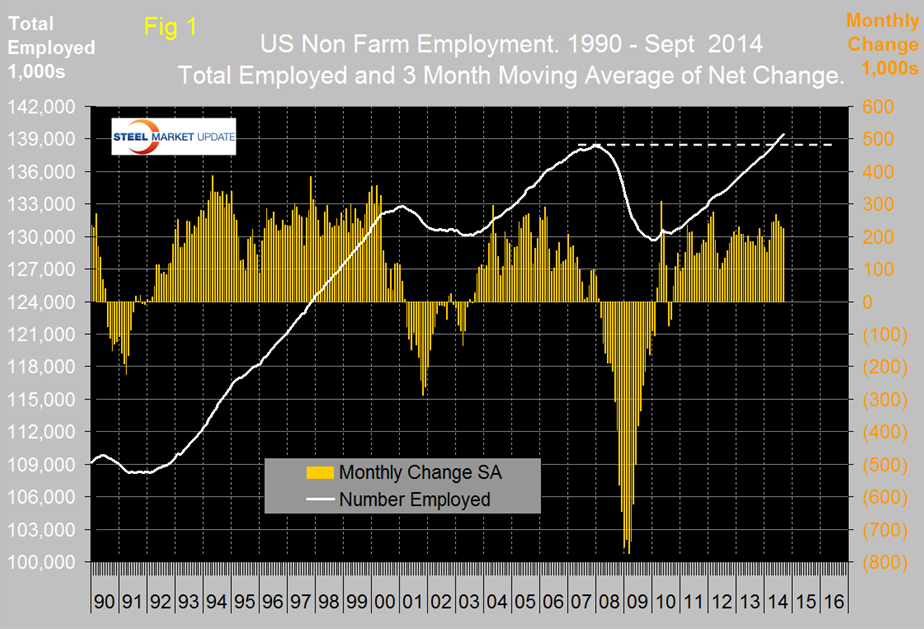
The Bureau of Labor Statistics (BLS) report on non-farm employment indicated that 248,000 jobs were added in September. August , which had been disappointing, was revised up by 38,000 and July was revised up by 31,000. The three month moving average, (3MMA) declined to 224,000 in September and has declined for three straight months but job recovery is now looking stronger than was the case in the mid-2000s, (Figure 1). In each of the last six months the 3MMA has exceeded 200,000 / month and the six month total has averaged 243,000. All numbers in this analysis are seasonally adjusted by the BLS. The total number employed in the US is now 139,435,000 people.
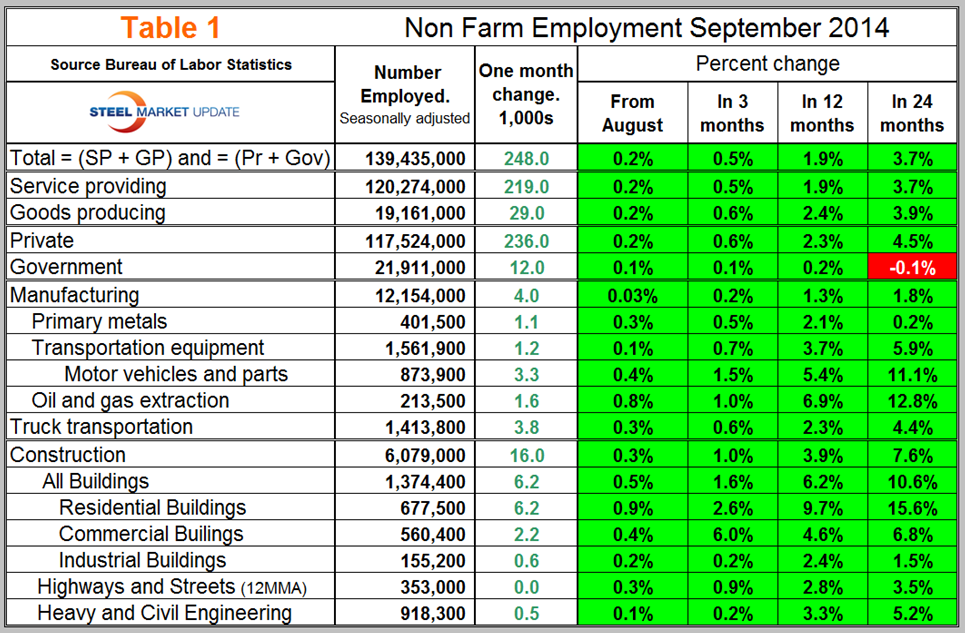
Table 1 slices total employment into service and goods producing industries and then into private and government employees. Total employment equals the sum of private and government employees. It also equals the sum of goods producing and service employees. Most of the goods producing employees work in manufacturing and construction and these sectors are further subdivided in Table 1. In September, private employment grew by 236,000 and government by 12,000. Service industries expanded by 219,000 and goods producing by 29,000 people. Private sector employment has expanded by 4.5 percent in the last 24 months as government has contracted by 0.1 percent. Government employment contracted from September 2009 through January this year but has now had eight straight months of growth. All the growth in government employment has been at the local level. In the first nine months of 2014, the federal government has shed 46,000 jobs, state governments have lost 28,000 and local governments have added 164,000 positions.
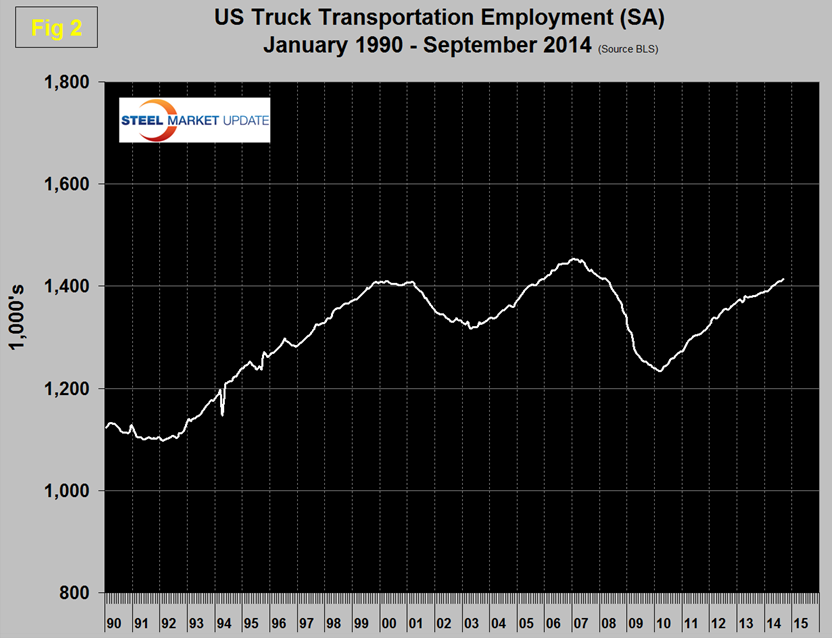
Manufacturing has added 101,000 jobs this year but the net change in the last two months was zero as the 4,000 gain in September wiped out the 4,000 loss in August. Motor vehicles and parts was the strongest manufacturing sector in September. The employment component of the ISM manufacturing index declined in September but the 3MMA has increased for six straight months meaning that most employers are adding to payrolls. Much has been written recently about the truck driver shortage, the truck transportation sector, which presumably includes more than drivers, added 3,800 positions in September and 26,900 YTD, (Figure 2). Note that Table 1 only identifies the major sectors in manufacturing and construction so the totals don’t add up.
Construction has added 203,000 jobs this year with 16,000 in September. The strongest construction sector in September was residential building which added 6,200 positions.
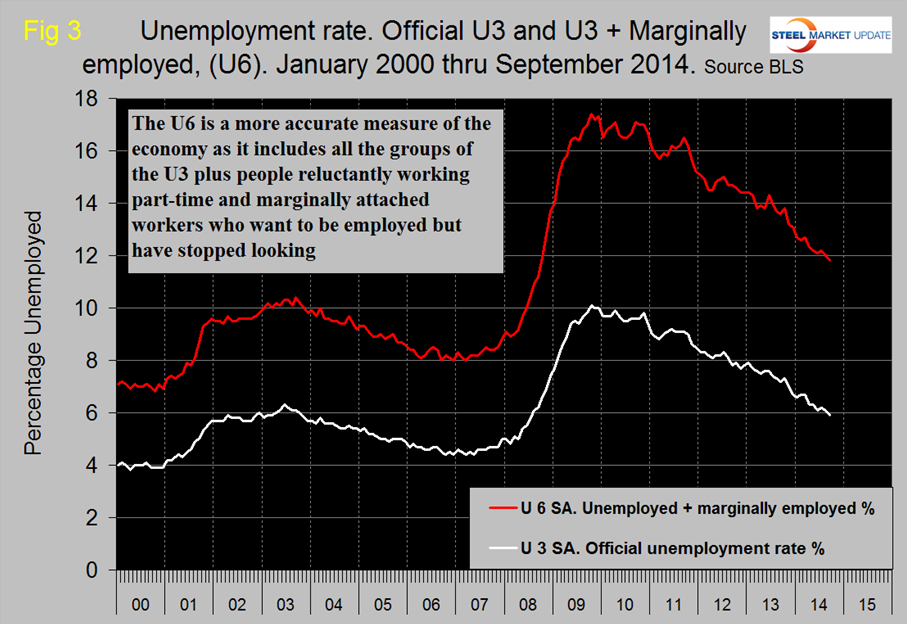
The official unemployment rate fell to 5.9 percent in September from 6.1 in August and 6.2 percent in July. This is known as the “U3” rate. The more comprehensive U6 unemployment rate stands at 11.8 percent, down from 12.0 percent in August and 12.2 percent in July, (Figure 3). U6 includes workers working part time who desire full time work and people who want to work but are so discouraged that they have stopped looking. The differential between these rates was usually less than 4 percent before the recession but in 2014 has averaged 6.0 percent.
The global outplacement consultancy Challenger, Gray & Christmas, Inc. issued the following press release on Thursday. At SMU we see relevance in this report as a reality check on other data sources that we use to evaluate the direction and velocity of employment change.
Monthly job cuts fell to their lowest level in 14 years in September, as U.S.-based employers announced workforce reductions totaling 30,477 during the month. As the fourth quarter begins, 2014 is on pace to be the lowest job-cut year since 1997.
The September total plunged 24 percent from the 40,010 job cuts announced in August, according to the report Thursday from global outplacement consultancy Challenger, Gray & Christmas, Inc. It was also 24 percent lower than the September total from a year ago, when employers announced plans to cut payrolls by 40,289.
Last month saw the fewest job cuts since June, 2000, when just 17,241 announced layoffs were recorded. The decline brings the 2014 monthly average down to 40,379. If this pace holds, the year could end with fewer than 500,000 job cuts for the first time since 1997 (434,350).
To date, employers have announced 363,408 planned layoffs, 6.2 percent fewer than the 387,384 cuts announced through September, 2013. In the third quarter, job cuts totaled 117,374, which was down 5.9 percent from the previous quarter. The third quarter total was 8.6 percent lower than the same quarter a year ago, when 128,452 cuts were recorded.
“There have been a couple of bumps in the road for the economy lately, which caused consumer confidence to drop in its latest reading. However, as this report shows, the recent hiccups have not resulted in widespread layoffs. Job security is being helped by the fact that corporate profits remain near record highs. So, we may see some ebb and flow in the rate of hiring, but employers, at this point, are reluctant to make any over-correction in workforce levels,” said John A. Challenger, chief executive officer of Challenger, Gray & Christmas.
September job cuts were led by the entertainment industry, where the closure of casino resorts in Atlantic City resulted in more than 7,000 job cuts. Overall, employers in the entertainment and leisure industry announced 8,119 job cuts during the month, the most since December, 2005, when announced layoffs totaled 12,202.
On Friday the BLS issued the following press release:
Non-farm payroll employment rose by 248,000 in September, and the unemployment rate declined to 5.9 percent. Employment increased in professional and business services, retail trade, and health care.
Incorporating the revisions for July and August, which increased total non-farm payroll employment by 69,000 on net, monthly job increases have averaged 224,000 over the past 3 months. In the 12 months prior to September, employment growth averaged 213,000 per month.
Professional and business services added 81,000 jobs in September, compared with an average monthly gain of 56,000 over the prior 12 months. In September, job gains occurred in employment services (+34,000), management and technical consulting services (+12,000), and architectural and engineering services (+6,000).
Retail trade employment rose by 35,000 in September. Most of the increase occurred in food and beverage stores (+20,000), largely reflecting the return of workers who had been off payrolls in August due to employment disruptions at a grocery store chain in New England. Over the year, retail trade employment has increased by 264,000.
Employment in health care increased by 23,000 in September. Over the month, job gains occurred in home health care services (+7,000) and in hospitals (+6,000). Over the year, health care has added 256,000 jobs.
In September, the information industry added 12,000 jobs, with a gain of 5,000 in telecommunications. Over the year, employment in information has shown little net change.
Among other service-providing industries, employment in food services and drinking places and in financial activities continued to trend up in September (+20,000 and +12,000, respectively).
In the goods-producing sector, mining employment rose by 9,000 in September and is up by 50,000 over the year. Construction employment continued on an upward trend in September (+16,000). Within the industry, residential building gained 6,000 jobs. Over the year, construction employment has grown by 230,000. Employment in manufacturing showed little change over the month.
Average hourly earnings of all employees on private non-farm payrolls were little changed at $24.53 in September (-1 cent), following an increase of 8 cents in August. Over the 12 months ending in September, average hourly earnings grew by 2.0 percent. From August 2013 to August 2014, the Consumer Price Index for All Urban Consumers (CPI-U) increased by 1.7 percent.
Turning to measures from the survey of households, the unemployment rate declined in September by 0.2 percentage point to 5.9 percent. Over the year, the jobless rate is down by 1.3 percentage points. In September, there were 9.3 million unemployed persons, a decrease of 329,000 from August. The number of long-term unemployed (those unemployed 27 weeks or more) was essentially unchanged over the month, at 3.0 million.
The labor force participation rate, at 62.7 percent, changed little in September. The employment-population ratio remained at 59.0 percent; it has been at this level for 4 consecutive months.
Among the employed, the number of people working part time for economic reasons was little changed at 7.1 million in September. (These individuals, also referred to as involuntary part-time workers, would have preferred full-time employment, but had their hours cut or were unable to find full-time work.)
Among people who were neither working nor looking for work in September, 2.2 million were classified as marginally attached to the labor force, about unchanged over the year. (These individuals had not looked for work in the 4 weeks prior to the survey but wanted a job, were available for work, and had looked for a job within the last 12 months.) The number of discouraged workers, a subset of the marginally attached who believed that no jobs were available for them, was 698,000 in September, a decline of 154,000 over the year.
In summary, non-farm payroll employment increased by 248,000 in September, and the unemployment rate declined to 5.9 percent.
SMU Comment: The September employment report including the July and August upward revisions are a strong indication that the recovery is tracking well and that the disappointing September results for consumer confidence and the ISM manufacturing indexes will not persist.


