

Market Data

September 30, 2014
Gross Domestic Product, Q2 2014, Third Estimate
Written by Peter Wright
The Bureau of Economic Analysis (BEA) released the third estimate of Q2 2014 Annual Revision of the National Income and Product Accounts last Friday.
The annualized growth rate was revised up from 3.95 percent in the first estimate to 4.17 percent in the second estimate to 4.59 percent in this the third estimate. GDP is measured and reported in chained 2009 dollars and this was the first time to exceeded $16 trillion.
Figure 1 shows quarterly results since 1990 and the latest IMF forecast through 2018. The reported GDP growth in the second quarter was in line with Q3 and Q4 last year. It was widely reported that the contraction in Q1 this year was a result of severe winter weather but there was more to it than that. Net exports alone accounted for a 2.74 percent negative swing from Q4 2013 to Q1 2014 and a decline in inventories accounted for a further change of 0.82 percent, neither of which should have been weather related. The year over year growth rate now stands at 2.59 percent up from 1.89 percent last quarter. In July the IMF reduced its growth forecast for the US in 2014 to 1.7 percent down from the April estimate of 2.8 percent. On about October 8th the IMF will update its estimates for global, regional and national growth, at which time we will report here on the forecast for growth in the US, Canada and Mexico as well as the global picture.
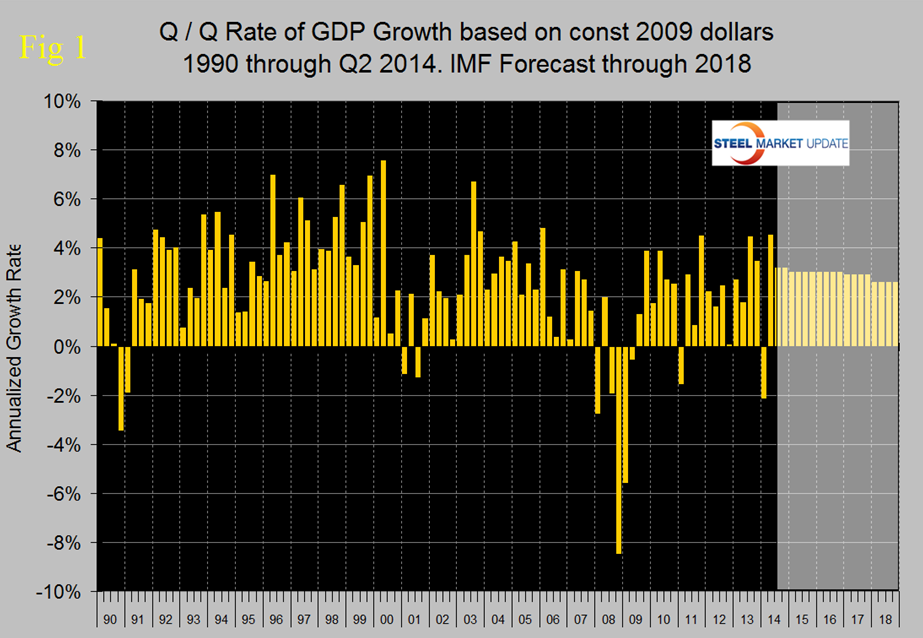
Figure 2 shows the change in the major sub-components of GDP. It can be seen that this latest quarter is trending with Q3 – Q4 last year and in fact there is a generally improving trend since Q2 2012 with Q1 this year appearing to be an outlier. Comparing Q2 with Q4 last year there has been a decline in personal consumption that was more than made up for by an increase in inventories. Increasing inventories has a positive contribution to GDP and as we explained last month over the long run inventory changes are a wash and simply move growth from one period to another. There wasn’t much change in nonresidential fixed investment but residential investment had a positive swing of 0.5 percent in its contribution. Personal consumption includes goods and services, the goods portion of which includes both durable and non-durables. In the Q2 personal consumption accounted for 68.16 percent of total economic activity, up from 67.93 percent in Q4 last year.
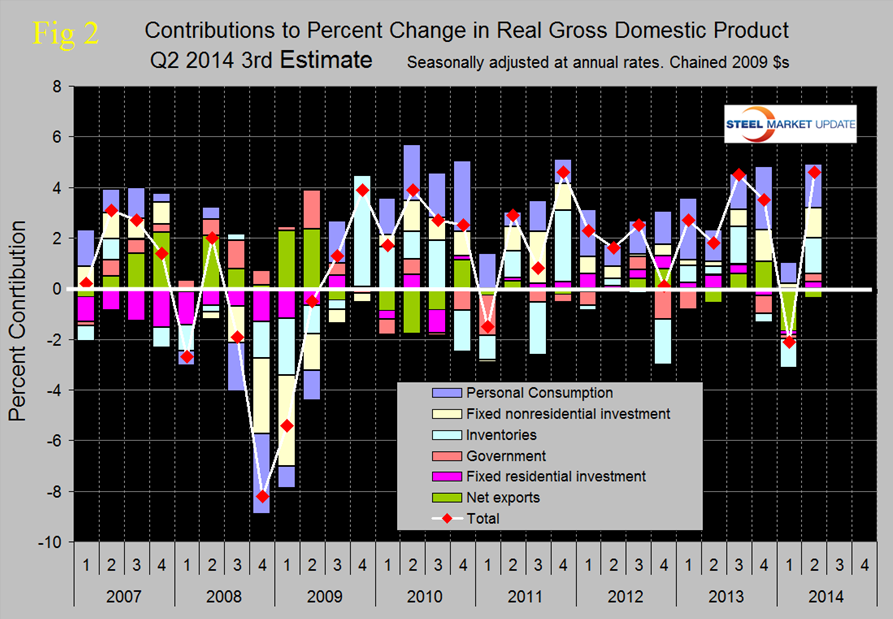
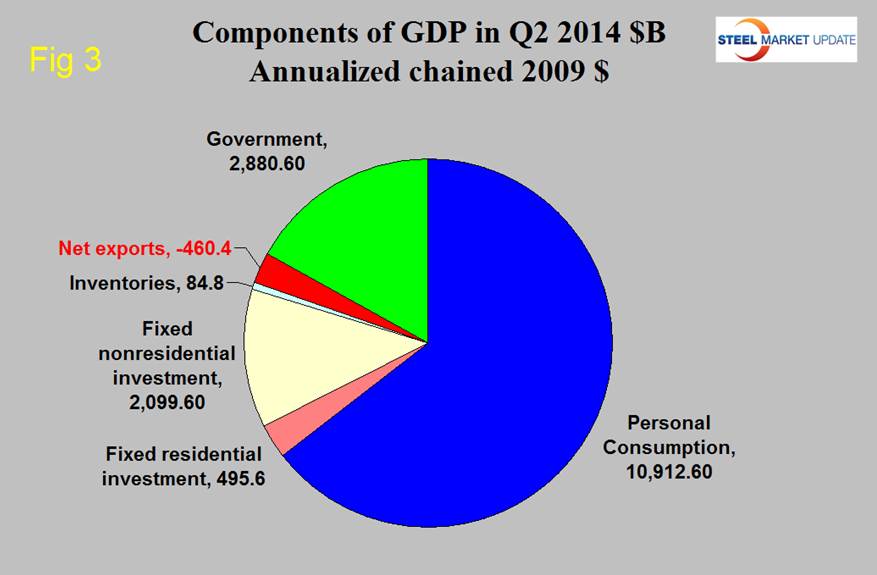
Figure 3 shows the breakdown of the $16 trillion economy.
The official press release from the BEA reads as follows:
Gross Domestic Product: Second Quarter 2014 (Third Estimate) Corporate Profits: Second Quarter 2014 (Revised Estimate)
Real gross domestic product — the output of goods and services produced by labor and property located in the United States — increased at an annual rate of 4.6 percent in the second quarter of 2014, according to the “third” estimate released by the Bureau of Economic Analysis. In the first quarter, real GDP decreased 2.1 percent.
The GDP estimate released today is based on more complete source data than were available for the “second” estimate issued last month. In the second estimate, the increase in real GDP was 4.2 percent. With the third estimate for the second quarter, the general picture of economic growth remains the same; increases in nonresidential fixed investment and in exports were larger than previously estimated.
The increase in real GDP in the second quarter primarily reflected positive contributions from personal consumption expenditures (PCE), exports, private inventory investment, nonresidential fixed investment, state and local government spending, and residential fixed investment. Imports, which are a subtraction in the calculation of GDP, increased.
Real GDP increased 4.6 percent in the second quarter, after decreasing 2.1 percent in the first.
This upturn in the percent change in real GDP primarily reflected upturns in exports and in private inventory investment, accelerations in nonresidential fixed investment and in PCE, and upturns in state and local government spending and in residential fixed investment that were partly offset by an acceleration in imports.
SMU Comment: We have reported frequently in the past on the relationship between GDP and steel consumption. Steel growth follows economic growth but is very much more volatile. In addition over the long run about a 2.5 percent growth of GDP is necessary to get any growth in steel consumption. In three of the last four quarters, GDP growth has been well above 2.5 percent which bodes well for future steel demand.


