Market Data

September 15, 2014
Currency Update for Steel Trading Nations
Written by Peter Wright
At least once per month, Steel Market Update produces an update on the various currencies associated with steel trading nations. The following information is as of late last week and was produced by SMU contributing writer Peter Wright.
Explanation of data sources: The broad index is published by the Federal Reserve on both a daily and monthly basis. It is a weighted average of the foreign exchange values of the U.S. dollar against the currencies of a large group of major U.S. trading partners. The index weights, which change over time, are derived from U.S. export shares and from U.S. and foreign import shares. The data are noon buying rates in New York for cable transfers payable in the listed currencies. At SMU we use the historical exchange rates published in the Oanda Forex trading platform to track the currency value of the US $ against that of sixteen steel trading nations. Oanda operates within the guidelines of six major regulatory authorities around the world and provides access to over 70 currency pairs. Approximately $4 trillion US $ are traded every day on foreign exchange markets.
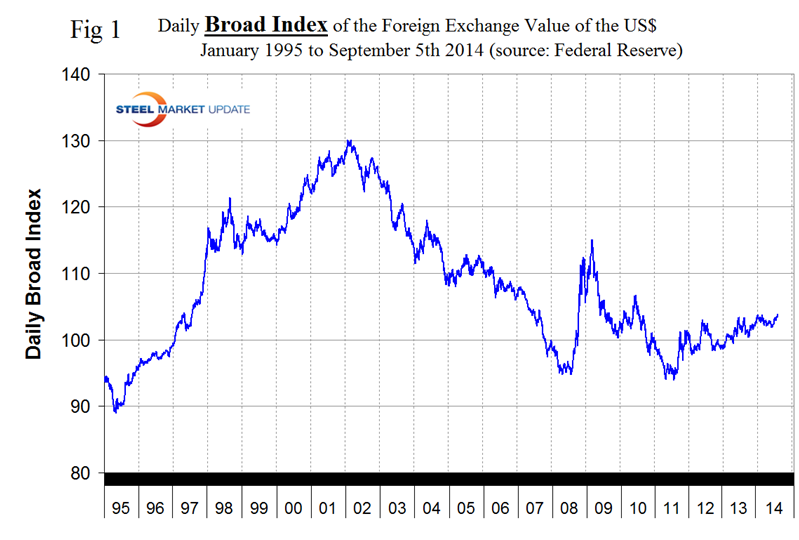
Based on the daily Federal Reserve Broad Index value of the US $ against our major trading partners we see a strengthening trend that has existed for the last three years. On February 3rd 2014, the value for the dollar was 103.8026. The index then weakened, turned around at mid-year and on September 4th had achieved the highest value of the year at 103.8562, (Fig 1).
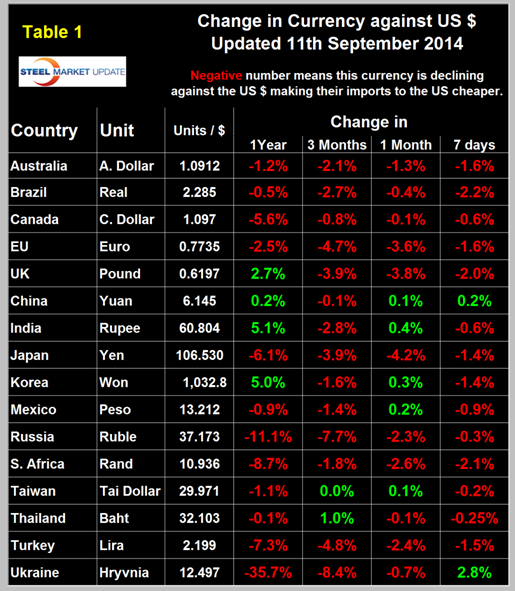
The Broad Index has strengthened by 1.1 percent in the last three months. It does not necessarily follow that the currencies of the steel trading nations follow the Broad Index but in the recent past this has been the case. Table 1 shows the number of currency units of steel trading nations that it takes to buy one US dollar and the change in one year, three months, one month and seven days. Negative values for change indicate that the dollar is strengthening against a particular currency. In the last three months and in 7 days through September 11th, the dollar has strengthened against 14 of the 16 currencies reviewed in this report. Table 1 is color coded to indicate strengthening of the dollar in red and weakening in green. We regard strengthening of the US Dollar as negative and weakening as positive because the effect on net imports.
One reason for the strength of the US $ is energy production and imports. US crude oil production at the highest level since 1987. The surge in domestic production has pushed crude oil imports to their lowest level since 1997. This improved energy trade balance, which has helped shrink the trade deficit plus the shrinking of the US budget deficit are powerful forces pushing the USD higher.
Another driver is the market’s perception that the US recovery will continue putting pressure of the Fed to speed the date for a rate hike. The 2-yr US Treasury yield has pushed through the 0.50 percent level, which has held in place since the 2008 financial crisis and looks set to head back to levels not seen since 2005-2006 near 1.5-2 percent. A move higher in interest rates would make the USD look attractive relative to its peers and push it even higher. In addition there are powerful influences of a more specific nature which over the last three months have contributed to the following declines:
- Expansion in ECB monetary policy, the Euro down by 4.7 percent.
- The impending Scottish independence vote, the British pound down by 3.9 percent.
- The yen weakening to a 6-year low to the USD in anticipation of future BOJ action, down by 3.9 percent.
- The ongoing crisis in Ukraine and sanctions against Russia have driven these currencies down by 8.4 percent and 7.7 percent respectively.
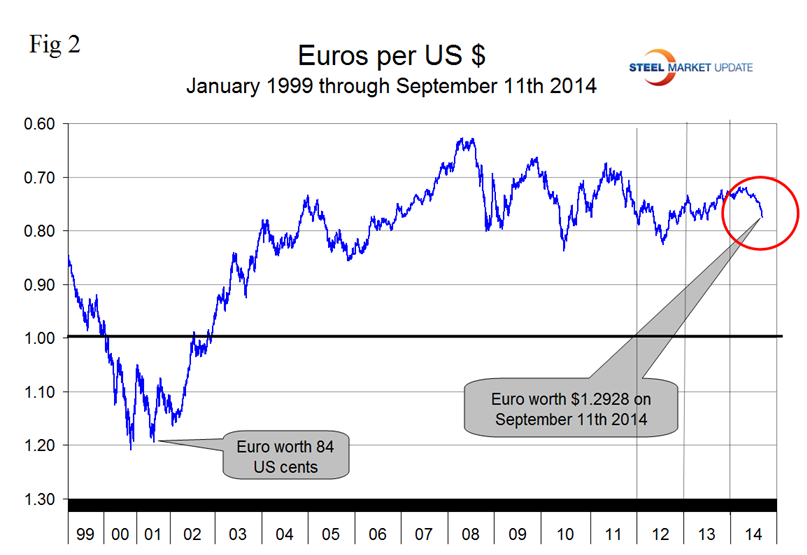
On September 6th the Euro broke through the 1.3 US $ / Euro level for the first time since July 11th last year and closed at 1.2928 on the 11th, (Fig 2).
The Euro has now declined by 6.05 percent against the US$ YTD, by 4.7 percent in the last three months and by 1.6 percent in the seven days through September 11th. The European Central Bank, (ECB) in their latest press conference on September 4th, announced a cut of its main lending rate to 0.05 percent and also revealed their intent to enter into a form of quantitative easing by purchasing asset backed securities and covered bonds at totals estimated between $500 billion to $1.3 trillion as early as October. This targeted long-term refinancing operation (TLTRO) is intended to promote lending activity to small and mid-sized businesses across the euro zone. The euro sank immediately after the decision was made and is still declining.
A devalued Euro means that US exports will be more expensive in Europe and European imports will be cheaper here. This is particularly true for steel trade. In addition European scrap will be more attractive to Turkish buyers than supplies from the US which will put downward pressure on domestic scrap prices. The ECB has been under immense pressure for the last year as the Eurozone continues to slip into a deflationary spiral. Deflation leads to stagnation, when the consumer and the business community stop spending in anticipation of lower prices in the future. The longer the prices stay low the more people will assume they will either stay low or fall even further. As the US federal reserve might soon start raising interest rates and the ECB is about to begin its quantitative easing plans, some see this divergence as a potential source of a large fall in the value of the Euro that might have already started over the last days.
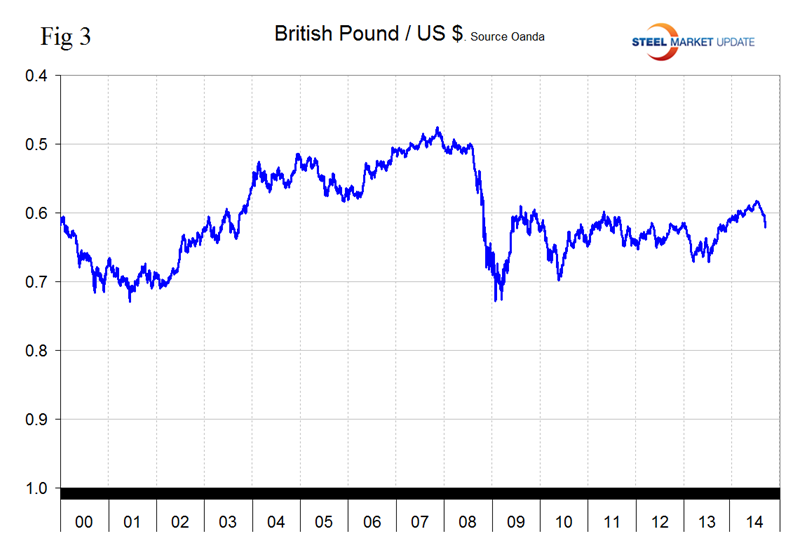
The abrupt decline in the British pound continued through the 11th in spite of comments by the Bank of England Governor Mark Carney suggesting that the central bank might start to raise interest rates in the spring. Scotland will vote for independence on September 18th. Until late August, investors had largely ruled out the chance of Scotland breaking away from the three-century-old union. But with recent polls indicating the vote is on a knife edge, hedge funds are scrambling to seek protection from further weakness in the pound, driving up volatility. Sterling was last at 0.6917 pounds to the US $, (Fig 3).
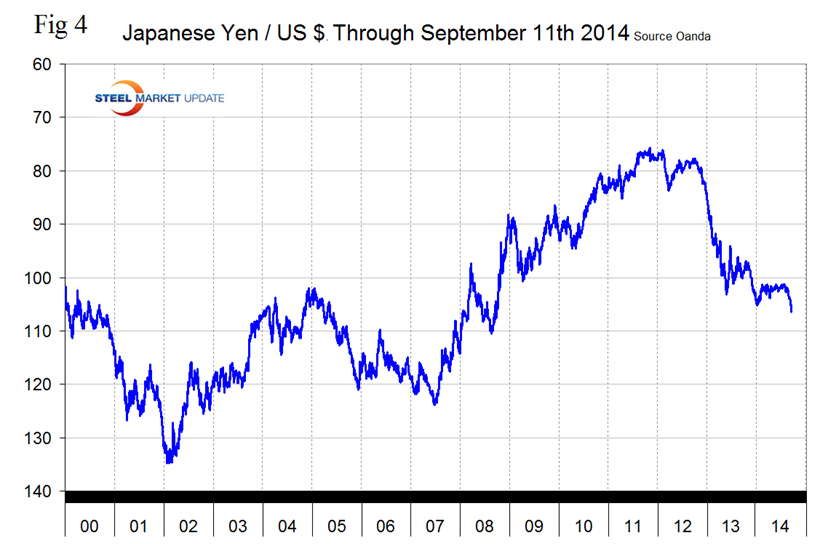
Japanese yen has had the greatest decline of all sixteen steel trading currencies in the last month falling by 4.2 percent to 106.53 yen to the $ on September 11th, (Fig 4). This is its lowest value in terms of US dollars since September 22nd 2008. It appears that the foreign exchange market led the rate move. Japanese investors have stepped up the export of their savings (they have purchased $12 billion of foreign bonds over the past two weeks), and at the same time, speculators have grown a substantial short yen position. The gross short speculative yen position in the futures market has grown by almost 50 percent to 133k contracts in the four weeks through September 2nd. The second round of yen weakness is now occurring catalyzed by the most recent release of Japanese economic data which was worse than expected. In Q2 the Japanese economy as measured by GDP shrank 7.1 percent due to a fall in both consumer spending and capital investments. Analysts believe that the longer Abe’s policies fail to deliver the hoped-for economic results, the more intensely they will be implemented and to expect more yen weakness over the coming year.
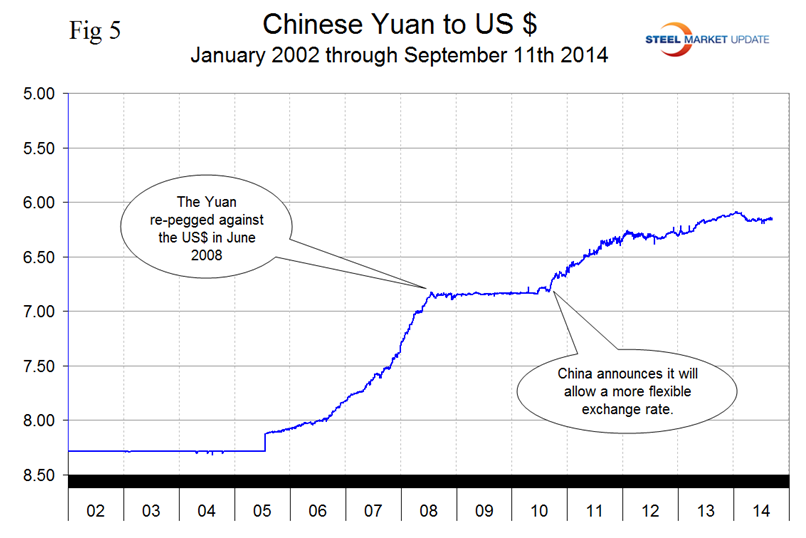
The Chinese Yuan is almost back to where it was a year ago after appreciating through 2013 then declining in early 2014, (Fig 5). Economy.com reported on August 27th. “Chinese economic policy at the macro level is now shifting to an easing bias, with local governments in 37 out of 70 major cities reversing housing restrictions to boost demand. The Yuan is more likely to head down than up, with 12-month Yuan forwards trading at a 1.2 percent discount over the spot rate. China is likely to rely a little more on exports again over the medium term, and foreign investment into China is likely to be weak.
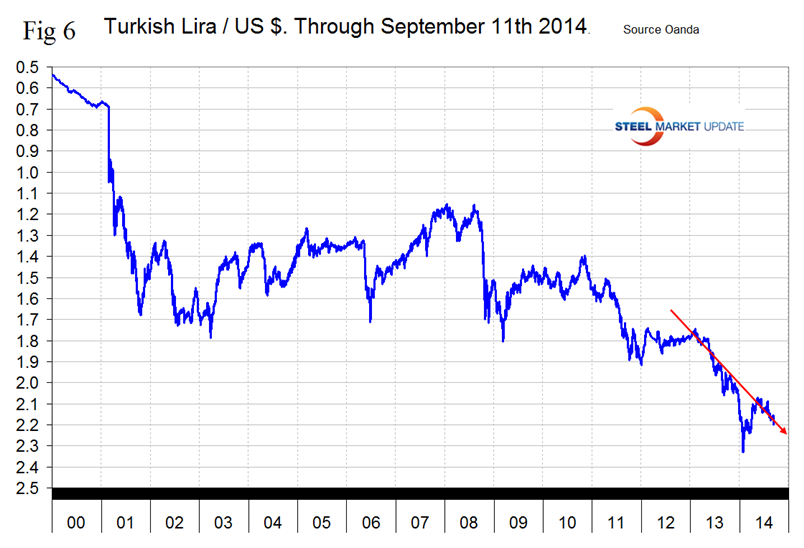
After declining sharply in January this year the Turkish Lira then recovered somewhat but has now resumed the downward trajectory that began early last year, (Fig 6). The Lira closed at 2.1985 to the dollar on September 11th.
There is a contrary opinion of the future of the US dollar that we reported a couple of months ago in our currency report. Bart Gruzalski reiterated that view last week: “In the past few years, some countries, notably Iran, Russia, China and Brazil, have made efforts to reduce their need to hold dollars for settling their trade accounts. Any country dropping the dollar for another oil-currency weakens confidence in the dollar as the currency of international trade and this can put the dollar on a slippery slope. The sanctions Obama imposed on Russia are beginning to backfire as Russia begins to sell her oil in non-dollar currencies.”
The Russian newspaper RIANOVOSTI gave the following account: “The Russian oil company Gazprom Neft has agreed to export 80,000 tons of oil from Novoportovskoye field in the Arctic; it will accept payment in rubles, and will also deliver oil via the Eastern Siberia-Pacific Ocean pipeline (ESPO), accepting payment in Chinese yuan for the transfers, the Russian business daily Kommersant reported Wednesday… Last week, Russia began to ship oil from the Novoportovskoye field to Europe by sea. Two oil tankers are expected to arrive in Europe in September. According to Kommersant, the payment for these shipments will be received in rubles. Gazprom Neft will not only accept payments in rubles; subsequent transfers via the ESPO may be paid for in yuan, the newspaper reported.”
SMU comment. Interesting times in the currency markets that steel company executives should be keenly aware of. In this monthly analysis we show the trends that we think have the most immediate significance, but all 16 steel trading nation graphs are available on request if any reader has a special interest that we haven’t covered.


