Market Data

July 22, 2014
China’s Economic Statistics Q2 2014
Written by Peter Wright
Statistical data out of China is always questioned for a number of reasons, not least is, “Is the data politically motivated.” Other suspicions arise because China gets their data out faster than any other major economy and the data is never revised.
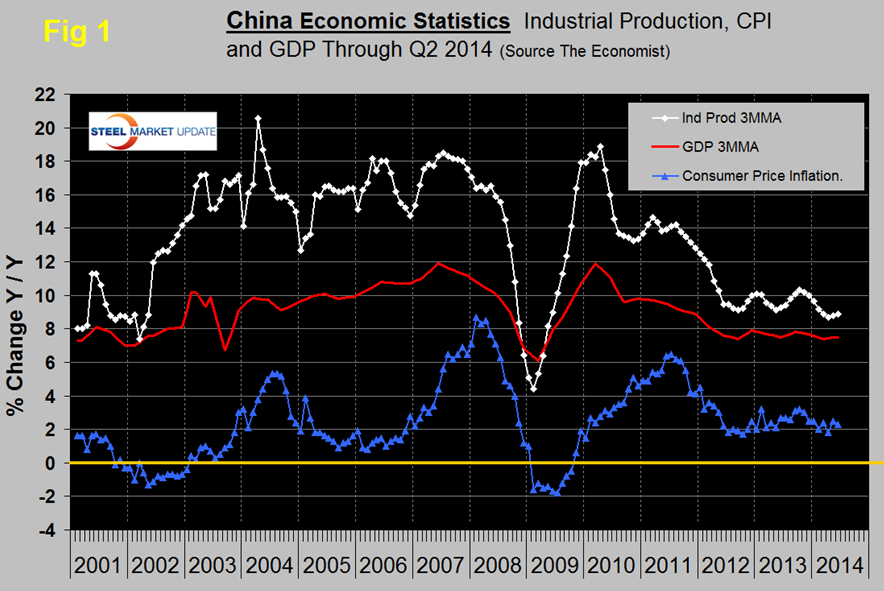
Figure 1 shows published data for the growth of GDP, industrial production and consumer prices through Q2 2014. The GDP and industrial production portions of this graph are three month moving averages. GDP grew 7.5 percent y/y in the first quarter a slight increase from the 7.4 percent rate of Q1 but still below potential.
Industrial production grew 8.9 percent y/y in the second quarter, the same as in Q1 but down from the 9.4 percent rate of Q2 2013. Moody’s reported as follows in Economy.com: Chinese industrial production picked up in June, growing 9.2 percent year on year, after May’s 8.8 percent gain. This provides an early sign of the effects from fiscal and monetary stimulus measures, which is boosting rail and broader infrastructure works as well as utilities. Still, output is growing below its potential rate because of overcapacity in steel and other sectors and as a result of the housing slowdown. Early signs suggest fiscal and monetary stimulus measures are working to support a pickup in production. An increase in government spending on railways, as well as reserve ratio cuts at banks, have lifted demand for machinery and metals products. Export-manufacturers have enjoyed a boost from the Yuan’s weakening (down 2.5 percent against the dollar in 2014), which has lifted lower-value added manufacturers. Electronics manufacturers are still benefiting from strong demand both at home and abroad for new handheld tech products such as smartphones.
The housing market remains the weak link, preventing production from expanding faster. Authorities remain committed to tackling bubbling debt problems. Yet some local governments are easing restrictions on house purchases to spur prices and construction, which should provide a lift steel and cement demand in coming months.
Consumer Price Inflation (CPI) has been stable in the 2.0 percent to 3.0 percent range since May 2012. In June China’s CPI grew 2.3 percent y/y slowing from a 2.5 percent increase in May. Food and housing were the main disinflation drivers. The government’s clampdown on housing is causing sales to decline and inventories to increase which developers are responding to with lower prices.
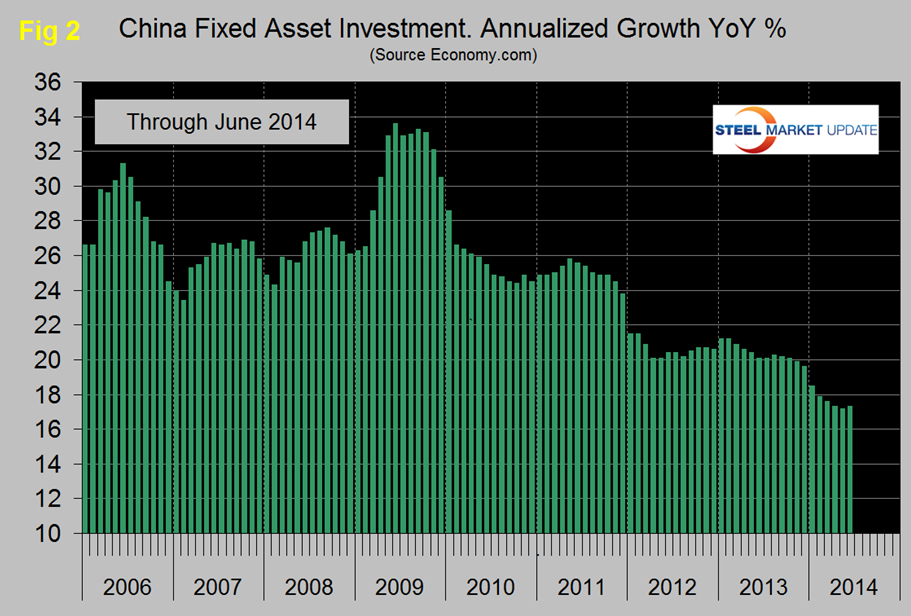
Figure 2 shows the growth of fixed asset investment y/y. The growth rate picked up slightly in June to 17.3 percent but has been declining for over four years. We understand that the data includes real-estate purchases so is not a direct reflection of constructional steel demand. We are assuming that the steel on the ground portion of this data follows the overall trend and this is in line with the stated objective to rebalance the economy in favor of consumer consumption.
The Manufacturers Alliance for Productivity and Innovation (MAPPI) reported as follows early this month. Apart from India, the outlook for developing Asia remains murky, mostly because of continued slowing in Chinese economic activity. To the extent that there had been any growth momentum in China at all, it moderated during the second half of 2013 and faded during the first half of 2014. As China confronts uneven world demand as well as financial, demographic, currency, and policy transitions, forecasters expect continued slowing. GDP growth is forecast to moderate from 7.7 percent in 2013 to 7.3 percent in 2014 and 7.1 percent in 2015. Industrial production growth is expected to slow from 9 percent in 2013 to 8.8 percent in 2014 and 8.6 percent in 2015.
– China’s GDP grew 7.7 percent in 2013, the same pace as in 2012. With stimulus measures winding down and the government focusing more on rebalancing and containing financial risks, however, the growth momentum started to moderate in late 2013 before showing evidence of a broad-based slowdown in early 2014.
– Growth in fixed asset investment eased from 19.6 percent in 2013 to 17.7 percent in the Q2 of 2014.
– The improved growth outlook in industrial countries hasn’t translated into gains for China’s exports. The disappointing export figures can be partly attributed to over-invoicing problems in early 2013; investors created fake invoices for exports to Hong Kong in an attempt to circumvent governmental control on capital inflows and take advantage of high interest rates in China. This situation makes a direct year-over-year comparison of exports growth misleading.
– The official PMI, which focuses mainly on large state-owned manufacturing companies, has been hovering around 50 since January; 50 is the border between expansion and contraction. The private HSBC PMI, which is weighted more toward small and private companies, stayed in the contraction zone during January through April.
– The Chinese currency reversed its long-term appreciation trend and depreciated 2.5 percent against the U.S. dollar between February and May. This is mainly a result of government intervention in the foreign exchange market in order to squeeze out speculators, deter hot money inflows, and more effectively curb the growth of shadow banking activities.
– The outlook for trade is likely to improve with the consensus forecast projecting that both exports and imports will grow 8 percent in 2014. Investment and manufacturing production are expected to stabilize soon after the government implementation of mini-stimulus measures, but the growth pace will not likely rebound strongly because of lingering overcapacity issues and tightened regulation on local government borrowing and shadow banking lending.
– Although the government has signaled stronger tolerance for slower economic growth in order to focus more on structural reforms, social stability is still its top priority; fiscal and monetary policy supports will be provided to avoid a sharp economic slowdown. The GDP growth rate will therefore not differ widely from the government target of 7.5 percent in 2014, and might decelerate slightly further in 2015.
– The main downside risk to the growth outlook in the near term comes from the financial sector, particularly concerning whether policymakers can contain debt accumulation and restore the soundness of the financial system without derailing growth momentum.
SMU Comment: There are widely reported concerns about the accuracy of the economic statistics out of China but at SMU we believe that the official data is all we have to go on as a guide to future steel trade activities, the importance of which is driven by the huge and excess steel capacity of China. From what we understand, the Chinese economy is becoming more consumer oriented and less dependent on fixed asset expenditures which are the largest consumer of steel products. If domestic Chinese steel demand declines, will capacity be reduced or will companies increase exports to relieve the pressure on profitability? This raises the question of where does profitability figure in the equation since such a high proportion of steel assets are government owned? There are two other macro concerns with conflicting motivators that could over-ride all other considerations. These are the environment and employment. We have no idea which of these will prevail, but clearly it behooves steel industry executives to stay tuned.


