Market Data

July 11, 2014
Net Imports of Sheet Products through May 2014
Written by Peter Wright
The supply of all steel products in the 3 months March through May 2014 was up by 10.0 percent from the same period last year. Flat rolled was up by 11.6 percent and sheet products by 11.5 percent. The sources of this analysis are the Commerce Department trade statistics and AISI steel shipment data.
The bad news is that imports of all flat rolled products were up by 61.9 percent and of sheet products by 61.8 percent y/y. On a tonnage basis flat rolled supply in March through May y/y was up by 1,887,187 tons of which imports ate up 1,427,115 tons. Sheet supply, (hot rolled + cold rolled + coated) was up by 1,502,864 tons and the increase in imports was 908,558 tons meaning that imports ate up 60.5 percent of the increase.
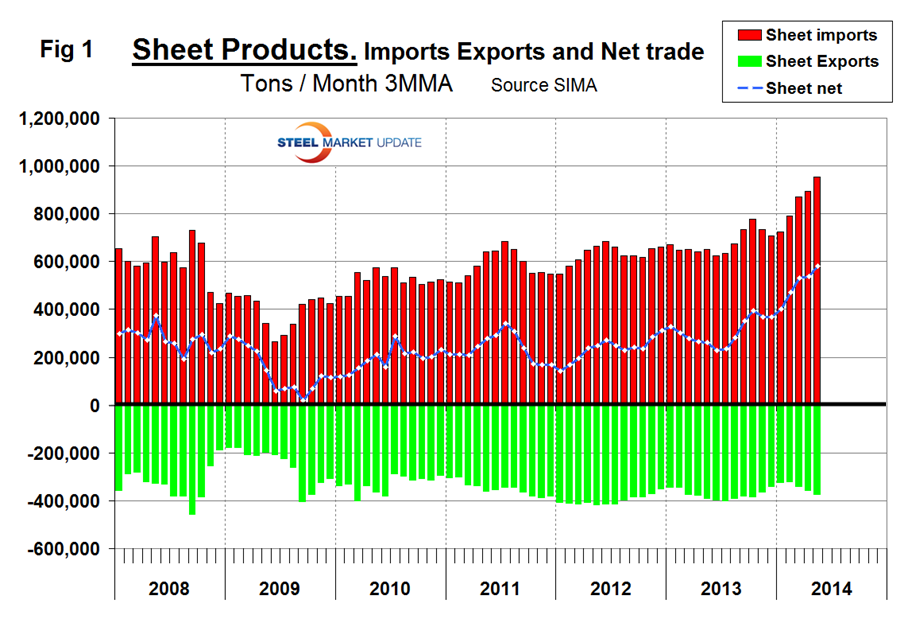
Net imports = imports minus exports, we regard this as an important look at the overall trade picture and its effect on demand at the mill level. Figure 1 shows that net sheet product imports on a three month moving average (3MMA) basis increased in May to the highest level since before the recession. The deterioration in net was entirely an import effect, exports have also increased this year and were up again in May.
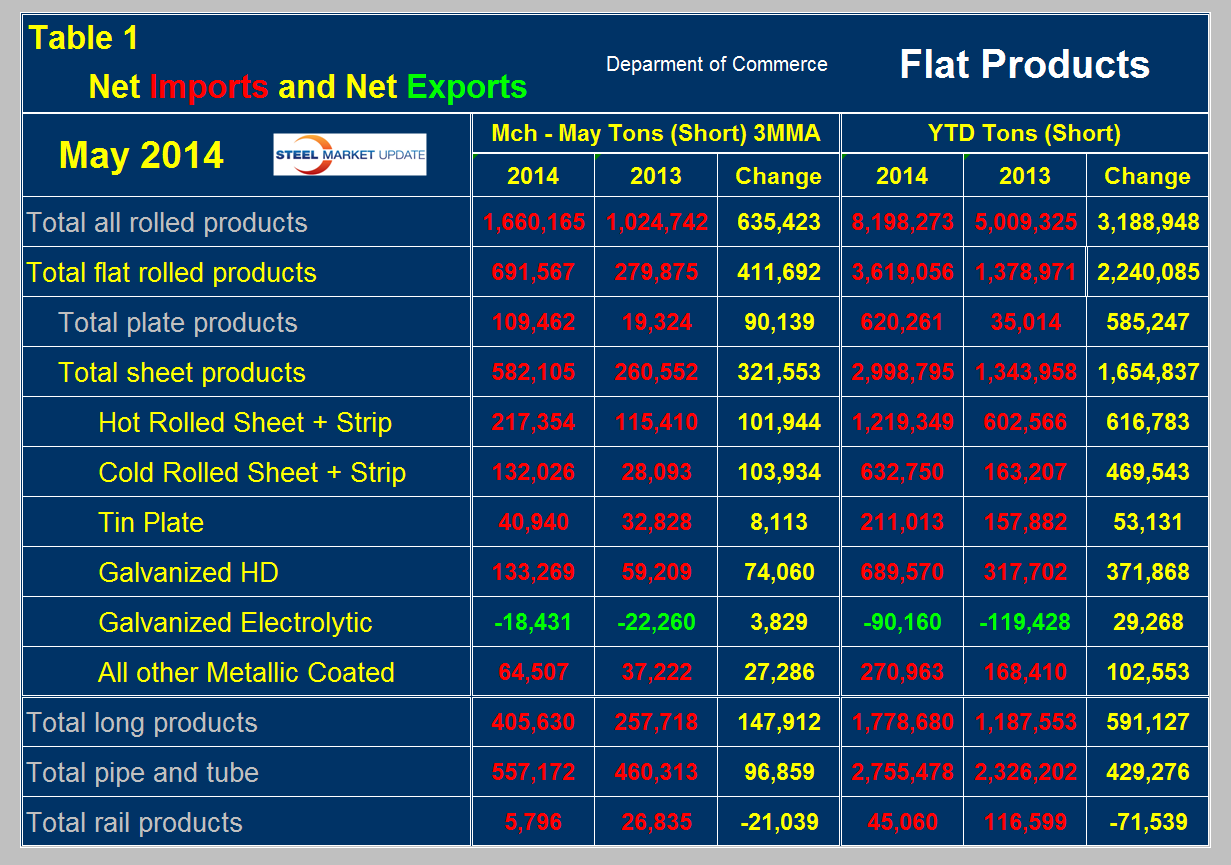
Table 1 shows net imports by product. Year to date through May, total flat rolled net imports were 3,619,056 tons of which 2,998,795 tons were sheet products. Net sheet imports more than doubled y/y being up by 1,654,837 tons. Net imports increased on all products except rail, led by hot band which increased by 616,783 tons. Electro-galvanized was the only product to have a trade surplus in 2013 and 2014 year to date but this surplus declined in 2014.In Table 1 negative net imports, (which means a trade surplus) are shown in green.
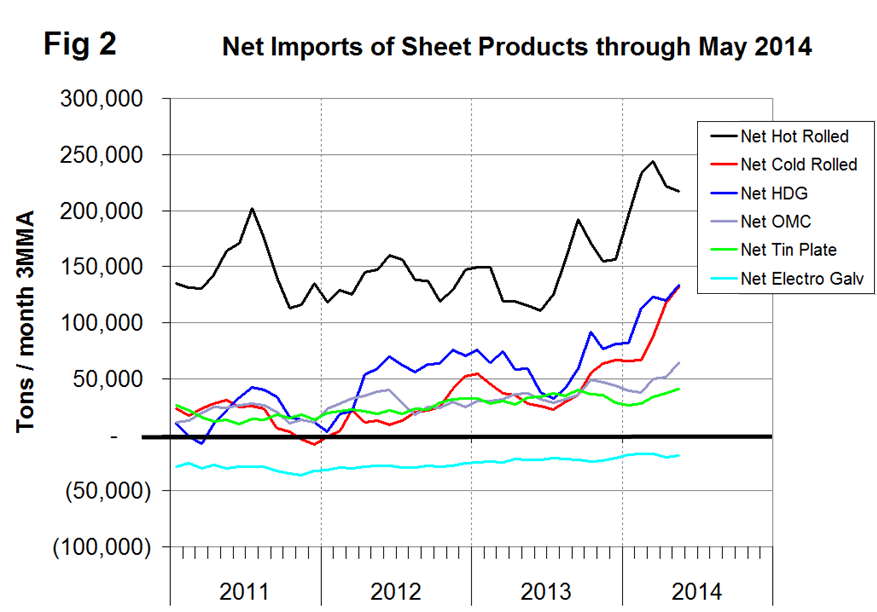
Figure 2 shows the trend of monthly net sheet product imports since January 2011 on a 3MMA basis. The trade surplus of electro-galvanized has been dwindling since late 2011, cold rolled has shot up markedly this year and has caught up with HDG.


