Prices

July 10, 2014
Imports Analysis: Semi-Finished, Flat Rolled & OCTG at High Numbers
Written by John Packard
It is still too early in the month of July to provide a trend analysis of where we think import numbers will fall by the end of the month. The first eight days (with three being holidays) of the month saw a relatively large number of license applications but we will wait until next Tuesday before we provide a projection based on the license data for the month of July.
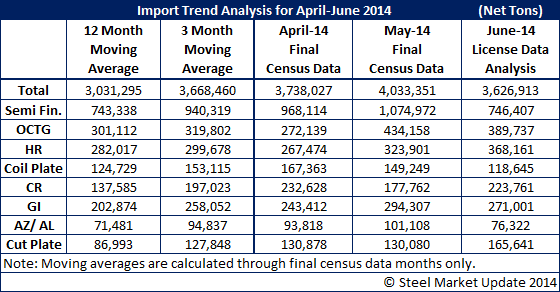
The U.S. Department of Commerce released Final Census Data for the month of May which was the largest month for imports in many years exceeding 4 million net tons. The biggest culprit was the domestic mills themselves as they imported over 1 million tons of semi-finished (most being slabs). Slightly more than 25 percent of total imports can be traced to steel mills and slabs. The domestic mills import more than slabs, however. Mills like USS/Posco (UPI) and Steelscape import large amounts of hot band so the final mill tally is much greater than 25 percent of the total imports.
During the month of July you have access to Premium Level services and one that you might want to take a look at is: imports by product, port and country. This data will help you recognize where the steel is going based on the port of arrival. You may be surprised from time to time where steel lands in the U.S. and where it is headed. We hope to have the May data loaded into the website early next week.
Oil country tubular goods (OCTG) continued at historically high levels with May exceeding 400,000 net tons. June license data indicates that the tonnage will be less than May but still very close to 400,000 net tons. About half of the May imports of OCTG were from South Korea. In June the number is lower with license data effectively calling for 153,000 net tons which is almost triple what South Korea shipped to the United States one year ago.
What should be concerning the domestic steel mills are the increases in flat rolled products. Hot rolled imports averaged 282,000 net tons a month from June 2013 to May 2014. In April the U.S. received 267,474 net tons of HRC. In May the number jumped to 323,901 net tons and then it jumped again in June to 368,161 net tons. Countries like Australia, Turkey, Korea and Russia along with our NAFTA partners are where the bulk of the steel is being sent from.
Cold rolled is another item where imports are surging with June forecast to be 223,761 net tons which is well above the 12MMA of 137,585 net tons. China has become the largest exporter of CRC to the U.S. with 48,000 tons in May and 82,375 net tons in June.
Galvanized imports have also grown to 294,307 net tons in May and slightly less (271,001 net tons) in June. Both are well above the 12MMA of 202,874 net tons. China was the largest exporter of galvanized to the United States in May with 80,223 net tons. In June China dropped down to 59,923 net tons and Canada returned as the largest exporter of GI to the U.S.
Other metallic (most of which is Galvalume) exceeded 100,000 net tons during the month of May before dropping back to a high but more reasonable 76,767 net tons in June. The culprits are Taiwan, China, Korea and Mexico.
Here is how the data shook out as of the 7th of July: