Analysis

June 22, 2014
Bakken Floods Railcars with Oil
Written by Peter Wright
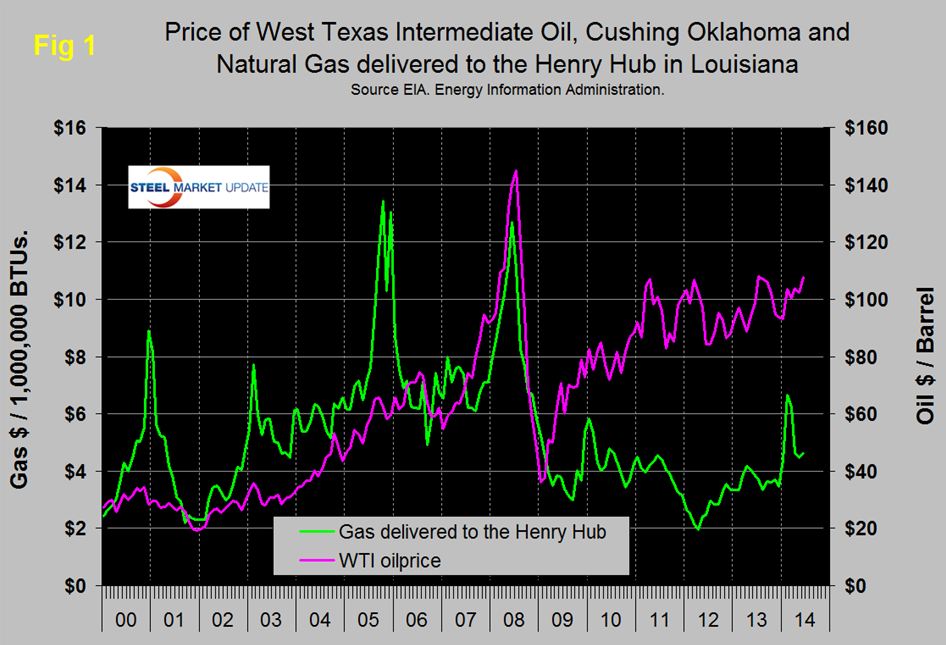
Figure 1 shows historical gas and oil prices since January 2000. West Texas Intermediate closed at $107.08 and Brent at $115.19 on June 19th. In 10 days prior to the 19th WTI increased by $1.99 and Brent by $4.64 as the ISIS situation in Iraq increased market uncertainty. Oil and gas prices have both been trending up since mid-2012.
The United States exported 268,000 barrels per day (b/d) of crude oil in April (the latest data available from the U.S. Census Bureau), the highest level of exports in 15 years. Exports have increased sharply since the start of 2013 and have exceeded 200,000 b/d in five of the past six months. The increase in crude exports is largely the result of rising U.S. crude production, which was 8.2 million b/d in March.
As onshore crude oil production in the United States increased over the past few years, producers have increasingly moved crude oil out of production areas by rail. Producers in North Dakota, in particular, have used rail to ship crude oil to refineries and midstream companies at newly built unloading terminals on the East Coast and West Coast. The number of rail carloads of crude oil began rising in 2012, as production in the Bakken Shale and other shale plays grew. According to the North Dakota Pipeline Authority, Bakken rail outflow capacity totaled 965,000 barrels per day (bbl/d) at the end of 2013, compared to 515,000 bbl/d of pipeline capacity. While some refineries are being built or planned for the area, most Bakken crude oil will continue to be moved out of the region to be processed at refineries in other parts of the country.
![]() Domestic crude oil supply to East Coast refineries has increased with rising U.S. crude oil production in the Bakken area and expansion of crude-by-rail infrastructure. Imports from foreign countries into the East Coast of light sweet crude oil, which is of a quality similar to Bakken crude, have declined as a result of increased receipts of Bakken crude. Some East Coast refineries have on-site rail unloading terminals, while other refineries receive crude by barge after it has been moved by rail to an unloading terminal.
Domestic crude oil supply to East Coast refineries has increased with rising U.S. crude oil production in the Bakken area and expansion of crude-by-rail infrastructure. Imports from foreign countries into the East Coast of light sweet crude oil, which is of a quality similar to Bakken crude, have declined as a result of increased receipts of Bakken crude. Some East Coast refineries have on-site rail unloading terminals, while other refineries receive crude by barge after it has been moved by rail to an unloading terminal.
Of the natural gas consumed in the United States in 2011, about 95 percent was produced domestically; thus, the supply of natural gas is not as dependent on foreign producers as is the supply of crude oil, and the delivery system is less subject to interruption. The availability of large quantities of shale gas should enable the United States to consume a predominantly domestic supply of gas for many years and produce more natural gas than it consumes. The U.S. Energy Information Administration’s Annual Energy Outlook 2013 Early Release projects U.S. natural gas production to increase from 23.0 trillion cubic feet in 2011 to 33.1 trillion cubic feet in 2040, a 44 percent increase. Almost all of this increase in domestic natural gas production is due to projected growth in shale gas production, which grows from 7.8 trillion cubic feet in 2011 to 16.7 trillion cubic feet in 2040.
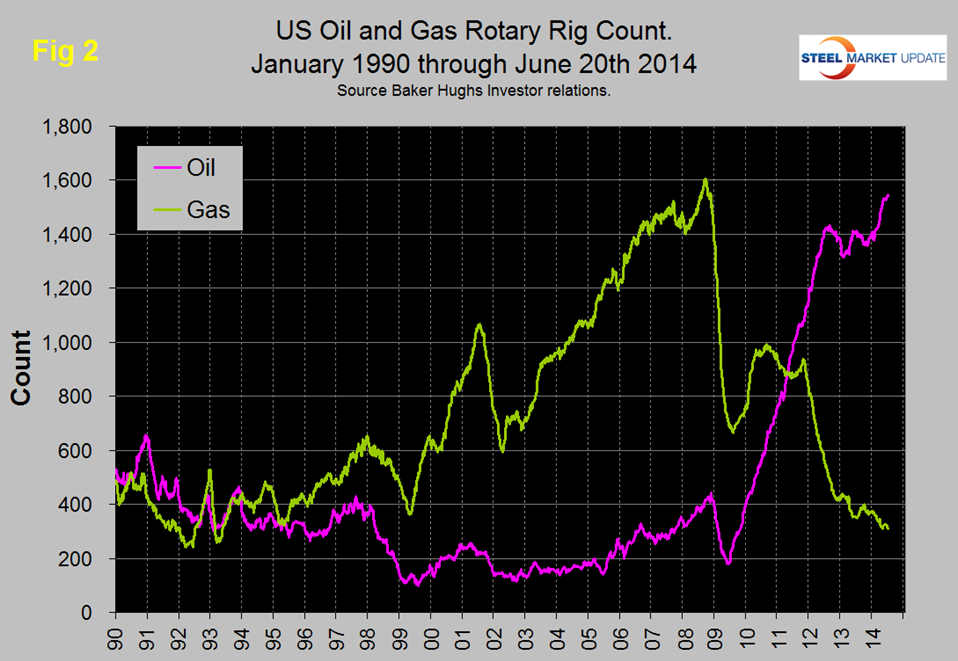
Figure 2 shows the Baker Hughes North American Rotary Rig Count which is a weekly census of the number of drilling rigs actively exploring for or developing oil or natural gas in the United States and Canada. Rigs are considered active from the time they break ground until the time they reach their target depth and may be establishing a new well or sidetracking an existing one. The Baker Hughes Rotary Rig count includes only those rigs that are significant consumers of oilfield services and supplies.
Figure 2 shows that the oil rig count which had been trending flat for almost two years has taken off again and is now at the highest level in over 2 ½ decades. The gas rig count is still trending down and is currently 80.6 percent below the peak of September 2008.
The total number of operating rigs is now 1858, an increase of 27 since we last published this analysis on April 17th. Land rigs increased by 20 in this time frame to 1799 and off shore by 7 to 59. Of the off shore wells, 57 are operating in the Gulf with a split of 45 oil and 12 gas. In June 20th 67.3 percent of drilling was horizontal, up from single digits prior to May 2004.
On a regional basis the big three states for operating rigs are Texas at 886, up by 4 since April 17th, Oklahoma at 200, up by 13 and North Dakota at 170, down by 8.
Off shore drilling has now recovered from the Deep Water Horizon oil spill in April 2010 but is still less than half what it was in January 2000. The National Oceanic and Atmospheric Administration (NOAA) is predicting a relatively mild hurricane season, but even a quiet season like last year can lead to disruptions to offshore crude oil and natural gas production in the Gulf of Mexico. EIA recently analyzed the potential for Gulf shut-in production during the upcoming months, given NOAA’s outlook for hurricane activity. EIA’s mean estimate of offshore production outages during the current hurricane season totals 12 million barrels (bbls) of crude oil and 30 billion cubic feet (Bcf) of natural gas, more than three and four times higher than last year, respectively.
On June 16th 265 rigs were operating in Canada of which 166 were oil and 99 were gas. 263 were on land and 2 off shore. 88% of the Canadian rigs were operating in Alberta and Saskatchewan.
The evolution of the North American energy market is good news for future steel demand. We believe that market trends for natural gas will eventually result in higher prices and a virtuous spiral in production as supply stimulates demand from such industries as power generation and direct reduced iron among many others. Also the restrictions on LNG exports are likely to be relaxed in the face of threats and restrictive actions by Gazprom.
This article was written by Peter Wright of Steel Market Analysis. Peter is a contributing writer for Steel Market Update and will be a speaker/moderator at our upcoming Steel Summit Conference on September 3 & 4, 2014 in Atlanta. The energy markets are important to the steel industry and another one of our speakers: Tim Stevenson of Cargill will address that subject during the Steel Summit Conference. We also will have Pat Ottensmeyer, Vice President of the Kansas City Southern Railroad who will be able to speak to the issues regarding tank cars and gondolas. Details about the Steel Summit Conference can be found on our website or by contacting our office at: 800-432-3475. Sponsorship opportunities and booths are available as well.


