Prices

April 6, 2014
Premium Flat, Long & Semi-Finished Import Analysis
Written by Peter Wright
The following is a report which is normally provided to only our Premium Level members. It is a detailed analysis of flat rolled, long products and semi-finished imports through the month of March 2014. Written by Peter Wright, we analyze how accurate license data is and provide a table using three month moving averages to correctly pick up the trend by product. If you are interested in this type of report you may want to consider becoming a Premium Level member.
Long, flat and semi-finished imports through March 2014. Licensed data for March was updated on April 1st after which the Commerce Department began to report April volume through the Steel Import Monitoring system. The first tonnage for April was released on April 3rd. The SMU publishes several import reports ranging from this very early look using licensed data to the very detailed analysis of final volumes by district of entry and source nation. The early looks, the latest of which you are reading now have been based on three month moving averages, (3MMA) using for example March licensed data, February preliminary data and January final data. Our belief was that this would dilute any inaccuracies in the licensed data and give the best early look at import volume in the first few days of the next month.
In order to assess the validity of this approach we began in January to examine just how accurate the license data is in predicting what would arrive in a given month. We discovered that in January the final receipts were only 0.4 percent less than the final volume though there were significant differences for individual products. For example the final volume of hot band was 13 percent less than the licensed tonnage.
This week we compared the preliminary February volume with February licenses, (February final won’t be available until late April), and got an unpleasant surprise. The preliminary tonnage was 17.3 percent more than the licensed volume. We always expected that differences would exist because the reporting mechanism doesn’t take account of where the material is at the time the license is released however this difference is more than we anticipated.
Again using hot band as an example of an individual product the difference swung the other way with 21.4 percent more tonnage in the preliminary February receipts than had been licensed. We expect that these differences will average out over a longer time period and are monitoring 2014 YTD to confirm this.
The biggest contributor to the February discrepancy was in semi-finished for which 260,000 tonnes, (40.3 percent) more tonnage was received than had been licensed. Please note that we have no reason to question the overall licensing system which we believe to have been of tremendous value as an early warning system. The only issue is the month in which the tonnage arrives. We will continue to report on our investigation into the relationship between licensed tonnage and month of arrival in this newsletter. Stay tuned.
Meanwhile, back at the ranch we will continue with the March analysis in the same way we have been doing and hope that your confidence in the result isn’t shaken so badly that you stop reading!
Figure 1 shows the 3MMA through March licenses for semi-finished, flat and long products. Flat includes all hot and cold rolled sheet and strip plus all coated sheet products plus both discrete and coiled plate. The anticipated import surge has begun for each of these major categories. It’s interesting that the percentage increase in the 3MMA shown in Figure 1 was greater than the single month of March / February because December which had been a low volume month was dropped from the equation. This supports the view that in spite of our concerns about licensed / month accuracy we are still on the right track.
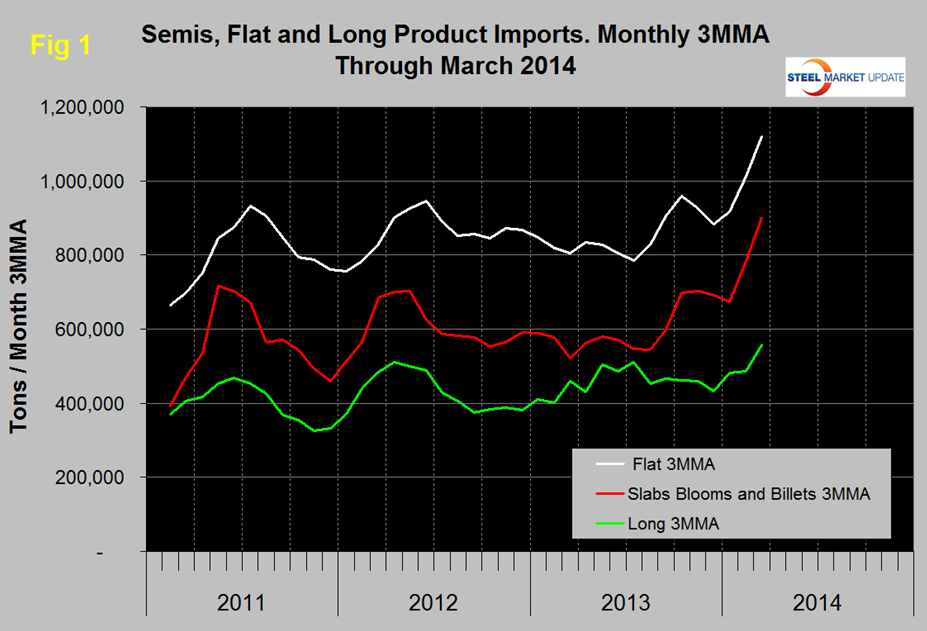
Figure 2 shows the trend of sheet and strip products since January 2011. Only tin plate and electro-galvanized sheet have been spared from the current surge.
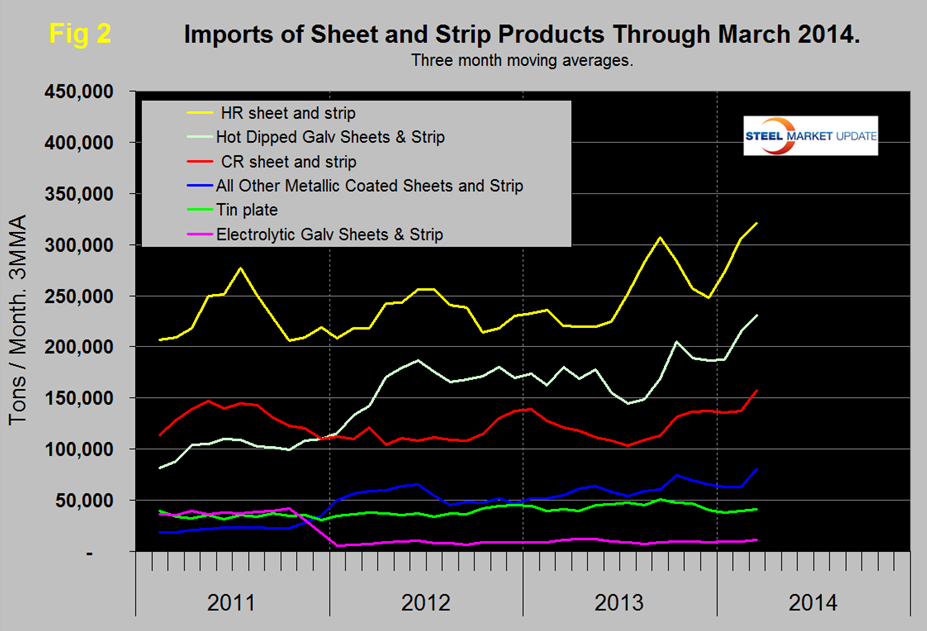
Table 1 provides a detailed import analysis and compares the average monthly tonnage of the three months through March, with both the same period last year and with three months through December. The total tonnage of all hot worked products averaged 2,101,814 tons per month in three months through March, up by 14.6 percent year / year and by 3.2 percent from Q4 2013. Semi-finished imports were up by 35.6 percent y / y and by 11.6 percent from Q4 2013. Table 1 shows the tonnage and percent change for all the major product groups and for sheet products in detail. The average monthly tonnage of sheet products in three months through March increased by 140,759 tons or 21.7 percent year over year.
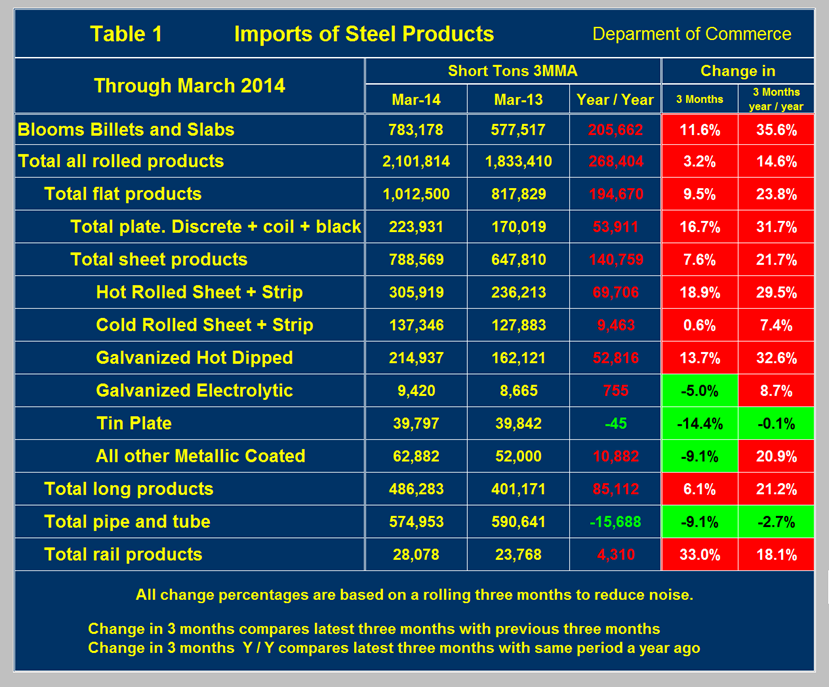
Long products, led by a surge in re-bar imports fared similarly to flat rolled in this analysis. Imports of pipe and tube declined in both time period comparisons. Rail products surged by 33 percent in Q1 2014 compared to Q4 2013.