

Prices

March 4, 2014
Imports of Sheet & Strip Through February 2014
Written by Peter Wright
Steel Market Update covers subjects in a variety of ways for our specific member groups. In the article below, Peter Wright provides a deeper analysis of preliminary steel import license numbers for flat rolled steel products which normally goes to our Premium Level customers:
This month we decided to start this piece with a review of the difference between licensed and preliminary import numbers using January 2014 as the base. This is a follow up on David Phelps’ recent article in Steel Market Update. To clarify the timing of these reports, we will use January as an example. The licensed data is issued weekly on Tuesdays and the final January licensed data was available on February 4th. January preliminary data came out on the 26th of February; this is the first estimate of what actually arrived. Final January data will be released on about March 10th.
The total of all carbon and low alloy products in January according to the preliminary estimate was 2,795,506 tons which was 1.4 percent less than the licensed tonnage for that month. A very impressive result for the Steel Import Monitoring System, (licenses). However the predictive performance of licenses was less stellar for individual products. For sheet products the differences between preliminary and licensed were as follows; negative means that less came in than was licensed in that month. HR -16.6 percent, CR +2.04 percent, HDG +2.48 percent, EG +9.52 percent and other metallic coated -0.25 percent.
This is a little disappointing, particularly for hot rolled in this particular month, but even so we believe it is valid to use the licensed tonnage in our import review for two reasons. First, timing is important. We need to have a pretty good idea of total volumes as early as possible.
Secondly, in this analysis we use a three month rolling average tonnage to dilute any inaccuracies in the licensed data. In the following graph and table the February data point is the average of February licenses, January preliminary tonnage and December final tonnage. In this way we believe we can get a good idea of the direction of each product as quickly and as accurately as possible. Please note that the very detailed analysis of tonnage by source and port of entry published in the SMU premium product is based solely on final tonnages, so the next detailed report will be for January and will be prepared on or about March 10th.
Figure 1 shows that hot rolled has been trending up slightly for two years but hot dipped galvanized has more than doubled since October 2011. Cold rolled has been trending more or less flat. All other metallic coated and tin plate have been trending up and electro galvanized has been exactly flat for over two years.
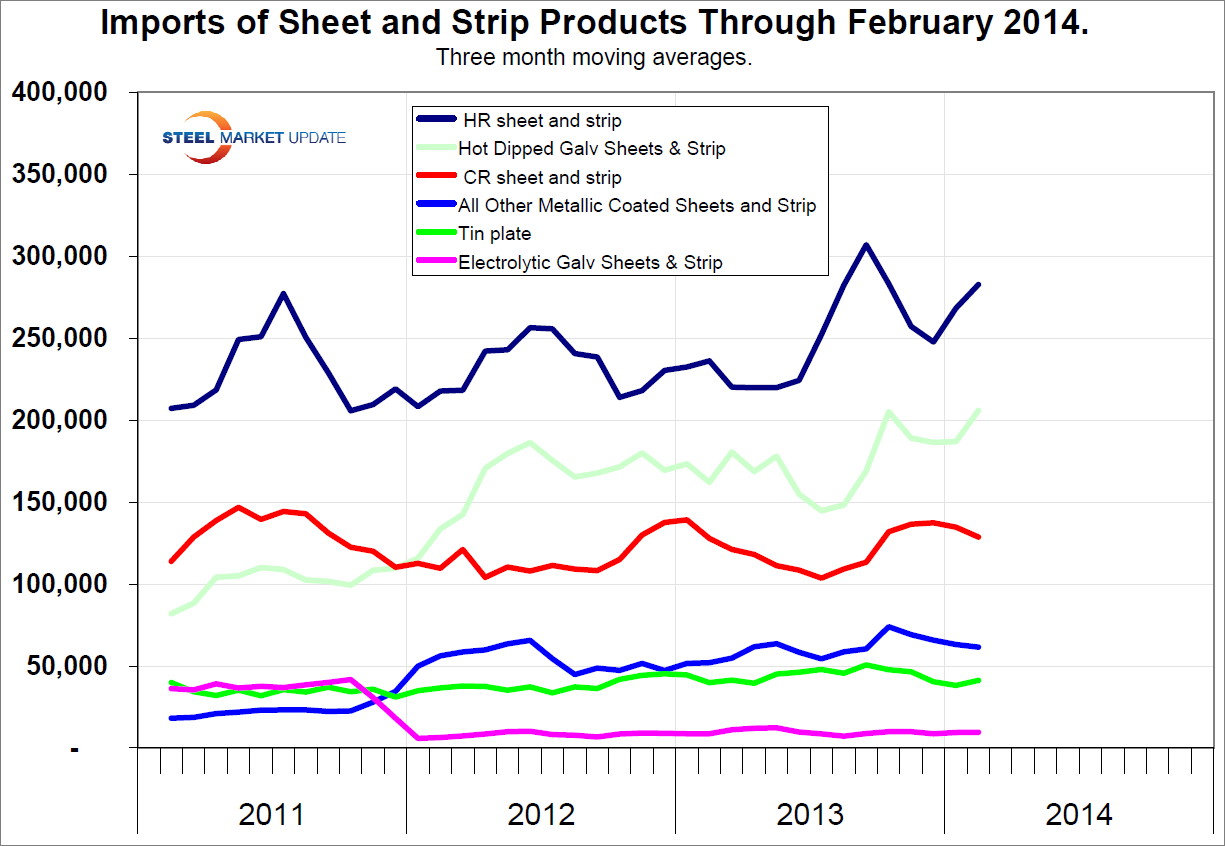
Table 1 provides a more detailed import analysis over a shorter time frame. It compares the average monthly tonnage of the three months through February, with both the same period last year and with three months through November.
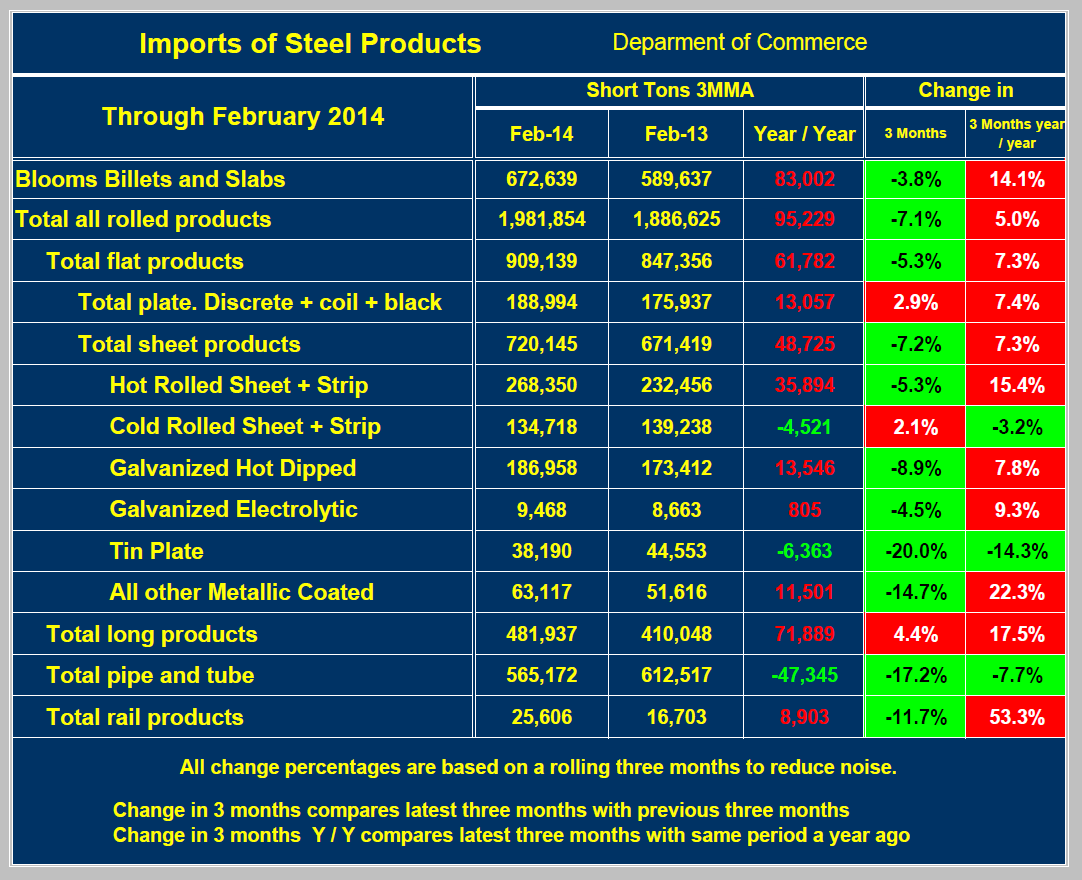
The total tonnage of all hot worked products averaged 1,981,854 tons per month in three months through February, down by 7.17 percent from September through November but up by 5.0 percent from the period November through January a year ago. Table 1 shows the tonnage and percent change for all the major product groups and for sheet products in detail. The anticipated import surge may have started. Total sheet and strip imports bottomed out in June on a 3MMA basis last year and have since increased by 19.6 percent.


