Market Data

January 21, 2014
China Economic Statistics through December 2013
Written by Peter Wright
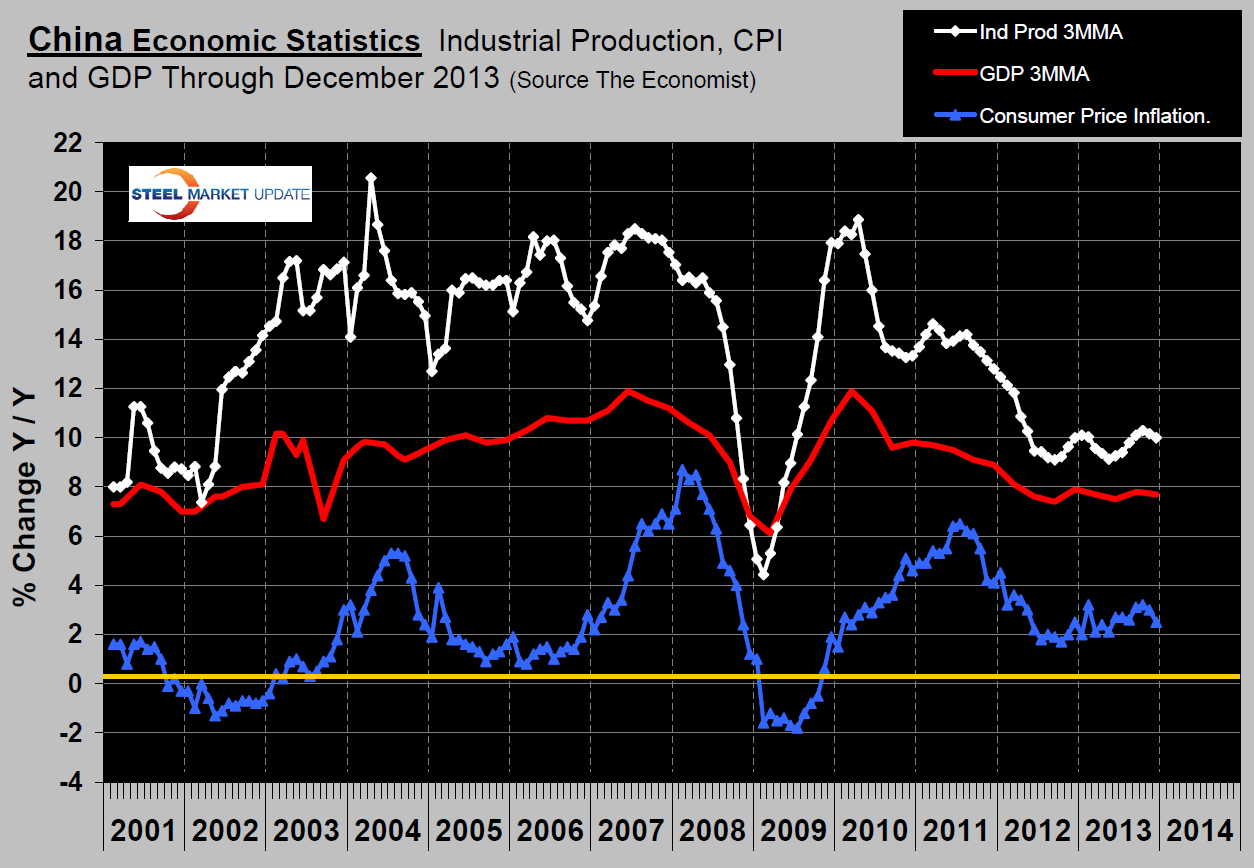
The Chinese economy grew by 7.7 percent year-over-year (y/y) in the fourth quarter and by 7.7 percent in 2013 as a whole (Figure 1). The GDP growth rate has been in the range 7.4 percent to 7.9 percent for the last seven quarters. The Chinese economy is performing in line with the government’s goals at the macro level. The primary sector, agriculture and mining grew slower than the rest of the economy in the final quarter of the year. The industrial sector (mostly manufacturing and construction) is growing at about the same pace as the broader economy.
China’s Consumer Price Index went up by 2.5 percent y/y in December, with food prices growing 4.1 percent and non-food prices growing 1.7 percent. In 2013 as a whole, the CPI grew by 2.6 percent on average. China’s Producer Price Index (PPI) fell by 1.4 percent in December y/y. The purchase prices of raw materials fell by 1.4 percent y/y in December. In 2013 as a whole, PPI dropped by 1.9 percent.
The three month moving average of the growth of industrial production has been fairly steady since May of 2012. Growth since September has been at the top end of this range, ending the year at 10.0 percent. Moody’s expects industrial output to grow at a slower pace, nearer to 9 percent in 2014 as authorities focus on rebalancing the economy toward domestic consumption. Bright spots are strong global demand for new tech products such as smart phones and tablets. Rising incomes and improving living standards are supporting car sales, which are also being helped along by government subsidies for fuel-efficient car purchases, which should continue through 2015. According to statistics from China Association of Automobile Manufacturers, in the whole year of 2103 China produced and sold 22.1 million and 22.0 million units, up by 14.76 percent and 13.87 percent y/y respectively. The organization also forecast that auto output and sales would go up by 8 percent-10 percent to about 24m units in 2014. China’s manufacturing sector will be sufficient to keep GDP growth at around 7.5 percent in 2014, receiving support from stronger external demand in the U.S. and Europe.
According to the data from the General Administration of Customs, the Chinese trade surplus was around B$25.641 in December of 2013. Total trade value was B$389.84, up by 6.2 percent y/y. Import value rose 8.3 percent y/y to B$182.1 and the export value increased by 4.3 percent y/y to B$207.7. In the whole year of 2013, the trade surplus was B$259.8, with import and export value of T$1.95 and T$2.21 respectively.
The Customs Administration reported that China’s export of steel products was 62.34Mt in 2013 as a whole, up by 11.9 percent y/y. The import of iron ore was 819.41Mt in 2013, up by 10.2 percent y/y, and the average import price was $129.03/t, up by 0.22 percent y/y. According to the recent report by the Chinese Iron and Steel Association (CISA), the price of iron ore will fluctuate downwards in the near future based on the weak demand for steel products and the reduction of steel production. The prices of imported iron ore and domestic steel products have displayed different or even contrary trends recently as a result of the monopoly power of the big 3 global iron ore suppliers. CISA’s prediction of declining iron ore prices aligns with the Goldman Sachs forecast of $80/dmt in 2015. The inventory of imported iron ore at steel mills and major ports is such that the supply of iron ore is predicted to exceed the demand continually in the near future. The higher price of iron ore has relentlessly squeezed the profit of steelmakers. According to date from CISA, the daily output of crude steel in December of 2013 was lower than that in the previous month.
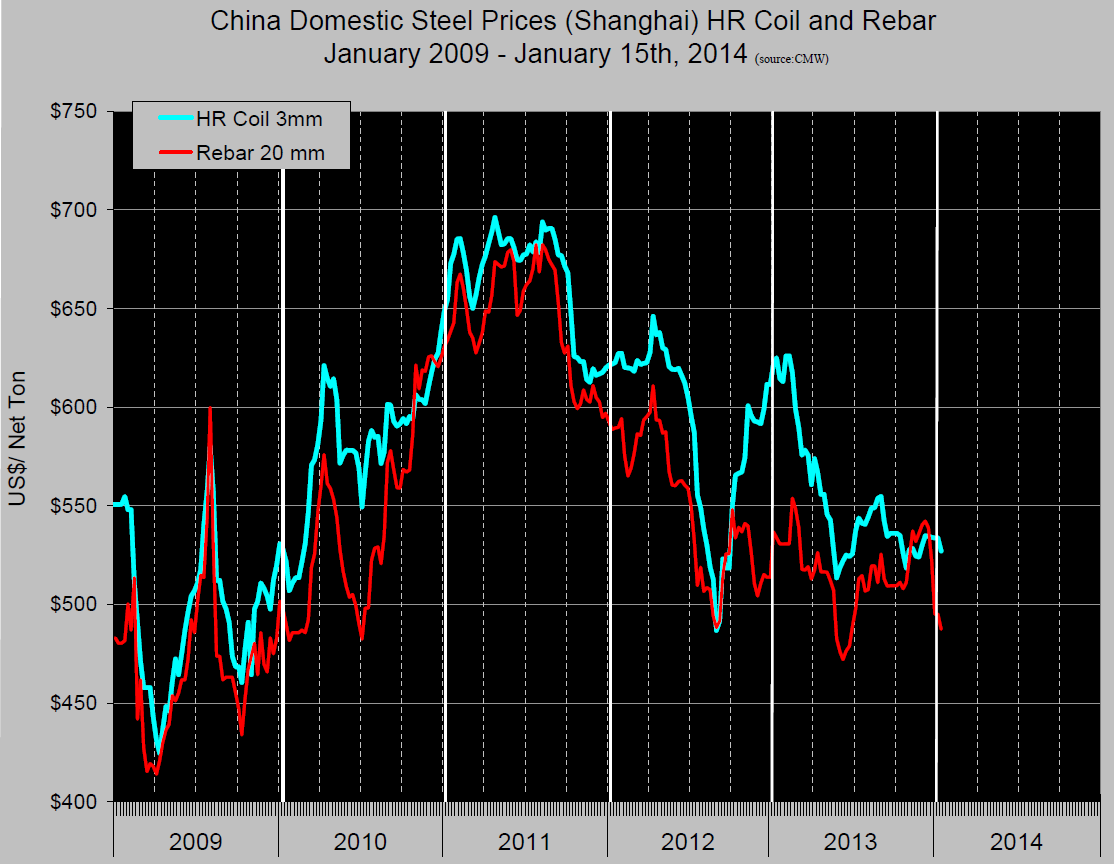
Chinese domestic prices have been declining since Q3 2011 with a few blips along the way (Figure 2). The price of hot rolled coil has declined from $696 / ton on May 4th 2011 to $527 on January 15th 2014, a decline of 24.3 percent. Prices are per short ton delivered Shanghai and include VAT. Rebar has experienced a sharp decline in the last few weeks and is down by 28.6 percent since August 17th 2011. (Sources: China Metals Weekly, Moody’s Economy.com and Goldman Sachs)


