

Prices

January 13, 2014
Net Steel Trade through November 2013
Written by Peter Wright
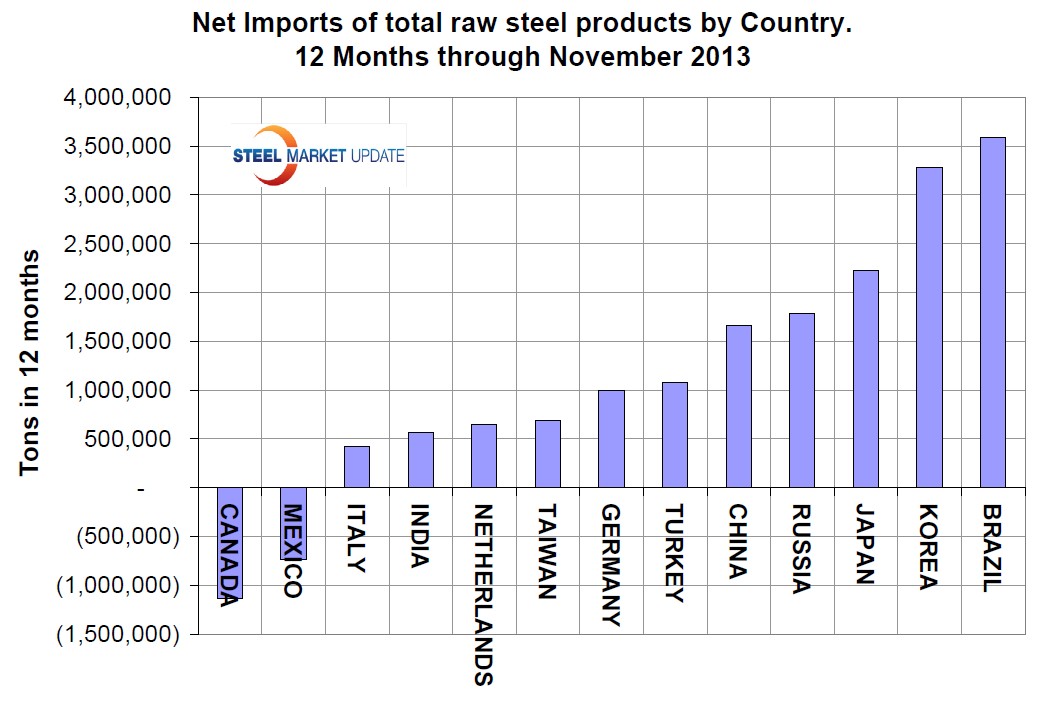
In the 12 months through November the US imported 29,129,427 tons of all steel products including semi finished, exported 11,594,574 tons for a net steel trade deficit of 17,534,853 tons. The major net importer was Brazil with 3,591,401 tons. Canada and Mexico both imported more from the US than they exported to the US resulting in a US trade surplus of 1,138,039 and 738,343 to those nations respectively (Figure 1).
The US steel industry pays a lot of attention to imports, rightly so, but at SMU we believe a net trade analysis is also important because it shows how much trade pressure or relief is being experienced by individual products.
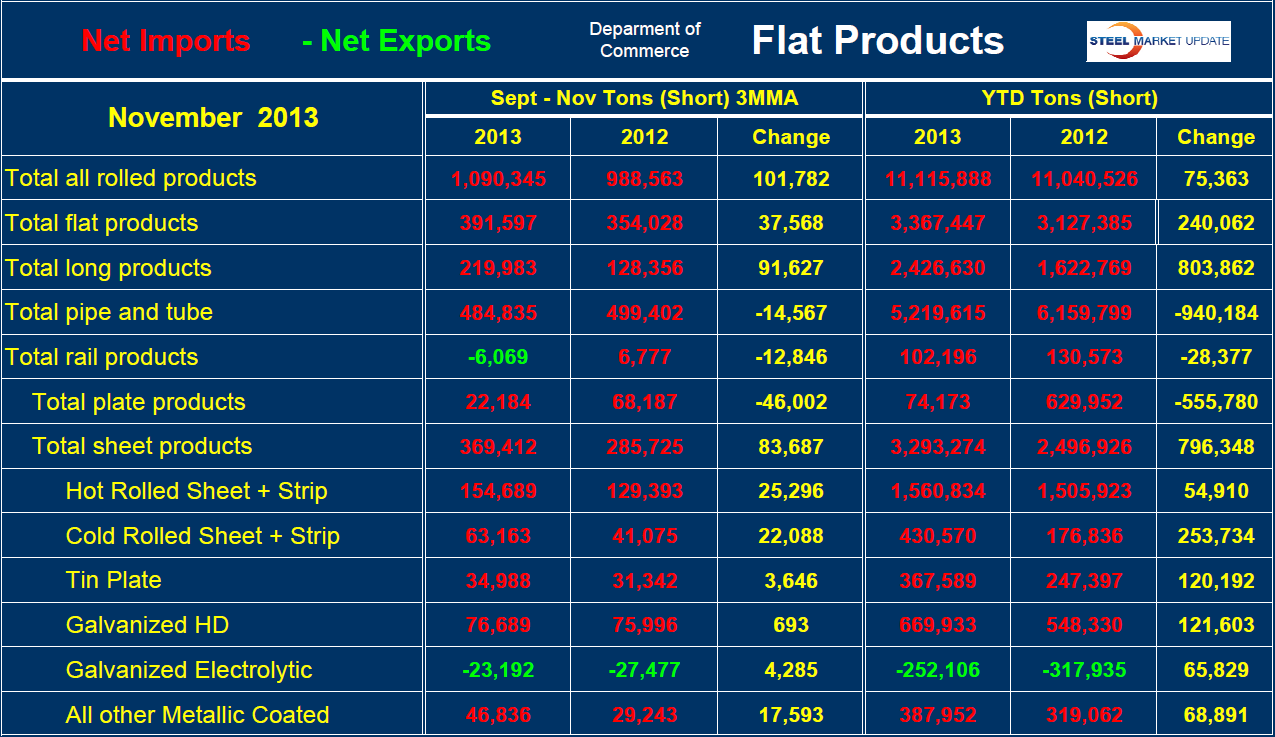
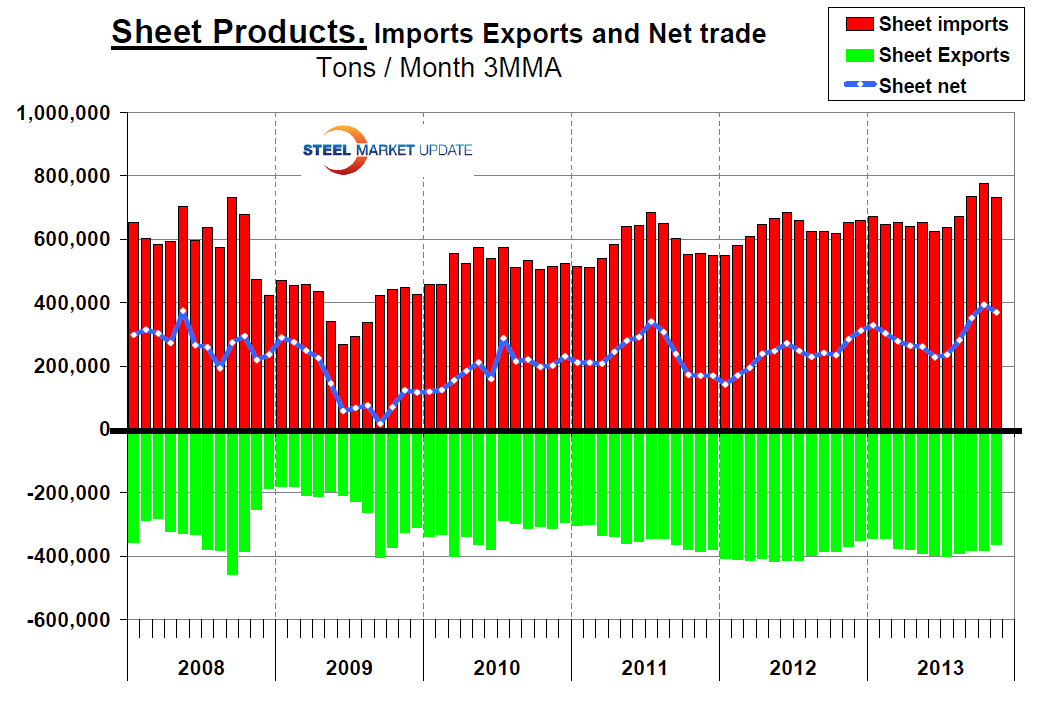
Table 1 shows net steel imports through November for all steel product groups and for sheet products in detail. The table is organized to show the year over year change in three months through November and year to date. In both time comparisons, net imports increased in 2013 for total flat and total long products. The only products having a net trade surplus in three months through November were rail and electro galvanized sheet. Plate experienced a decline in net imports of 46,000 tons in September through November but sheet products in total increased by almost 84,000 tons. Looking at sheet products in detail shows that hot rolled, cold rolled and other metallic coated, (Galvalume) all experienced a deteriorating trade balance in 2013 with an increase in net imports. Tin plate and HDG were little changed. On a year to date year over year comparison, electro galvanized was the only product to maintain a trade surplus which was a substantial 252,000 tons. Figure 2 is an examination of the net trade of sheet products over a longer time period on a rolling three month basis. It confirms the year over year change described above but also indicates that net imports in three months through November decreased slightly from the period three months through October. At SMU we try to look at information like this from all directions to get a comprehensive view but this data does illustrate that different conclusions can be reached if only one time slice is considered.
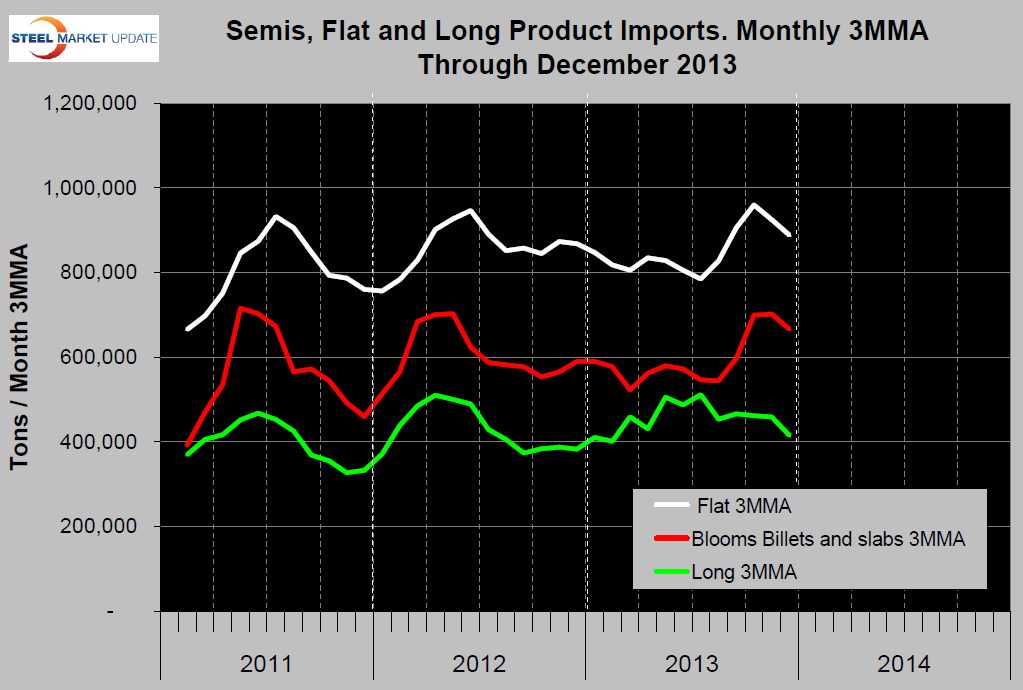
Licensed import data for December combined with final data for earlier months, on a three month moving average basis indicated that total flat rolled imports were down in both November and December (Figure 3). This statement is true for total sheet products, plate and all individual sheet products except cold rolled which moved in the opposite direction. Total long products and semi finished were down in December after being little changed in November.


