Market Data

January 13, 2014
Currency Update in January
Written by Peter Wright
The Federal Reserve publishes a trade weighted index of the value of the US$ against a basket of the currencies of our major trading partners weekly and monthly. The H.10 weekly release contains daily rates of exchange of major foreign currencies against the U.S. dollar. The data are noon buying rates in New York for cable transfers payable in the listed currencies. The rates have been certified by the Federal Reserve Bank of New York for customs purposes as required by section 522 of the amended Tariff Act of 1930. Steel Market Update uses this information to construct a currency comparison for multiple countries.
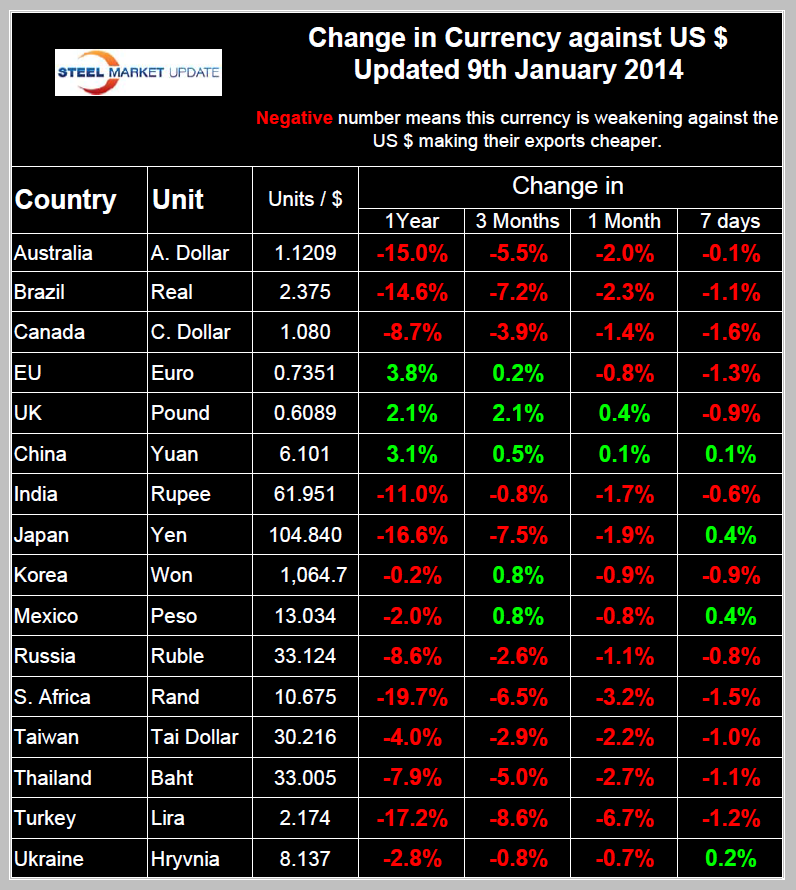
The Broad Index has been strengthening steadily for 18 months and is now up by 8.9 percent since May 2nd 2011. In the last 12 months through January 9th the BI is up by 3.6 percent. This widely reported data is useless for the consideration of iron ore and finished steel product trade. Simply put, steel trading currencies have a life of their own and are wildly more volatile than the BI. On a simple arithmetic (non weighted) basis the currencies of the steel and iron ore trading nations have declined by more than twice the BI with Australia, Brazil, India, Japan, South Africa and Turkey all having experienced double digit declines. Table 1 summarizes the currency fluctuations of 16 nations over 1 year, 3 month, 1 month and 7 day periods to give both a sense of the magnitude and direction of change. Numbers in this table are predominantly red indicating weakening against the greenback. This means that the US is more desirable as an export destination and that US exports are more expensive on the global market thus moving net steel trade in a negative direction. The only currencies that have strengthened against the US$ in the last year are the Euro, the Pound and the Yuan.
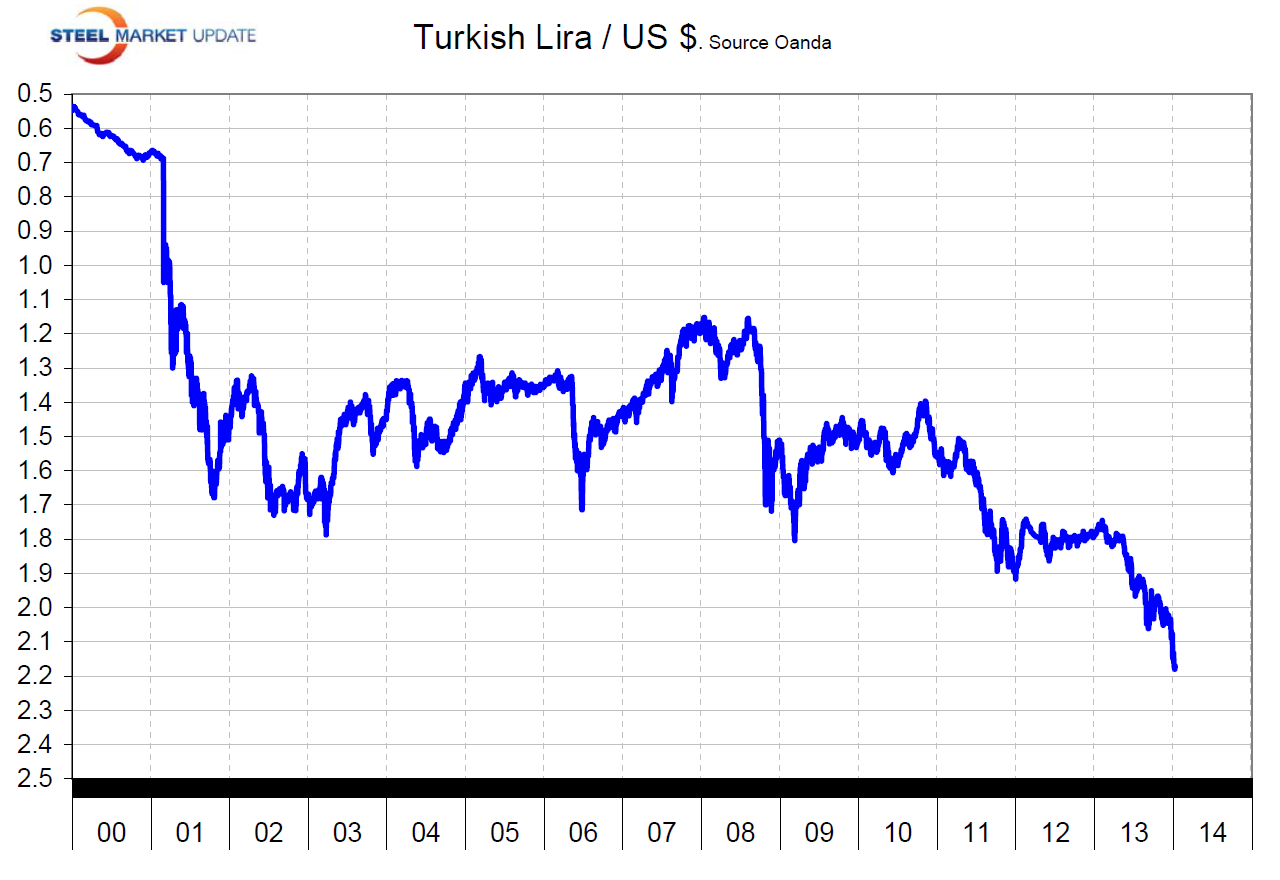
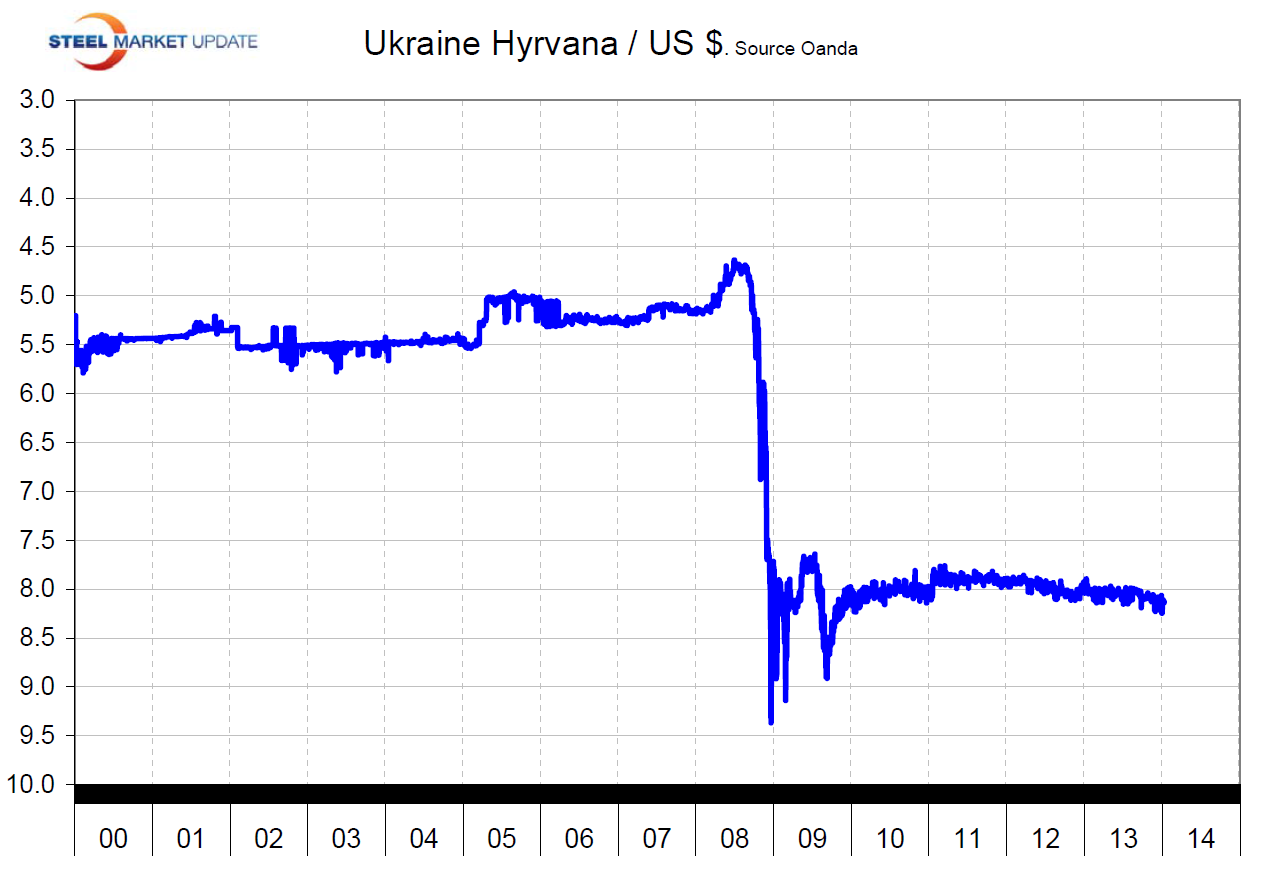
 The most significant changes in recent months have been to the Turkish Lira, down by 35.7 percent since November 5th 2010 and the decline is acceleration (Figure 1). The Australian $ is down 15 percent in the last year, all of which occurred in the last nine months. The Canadian $ has been declining for over a year and is now worth only 93 US cents. The Real has declined steadily for 2.5 years from 1.5 to 2.375 to the US$. The Euro has been strengthening for the last 18 months, (Go figure!). The Yuan has been strengthening for 18 months and is now poised to break through the 6.0 level. The Rupee has been stable for 4 months after the huge decline in mid 2013. The Yen has resumed its decline and is now back to over 100 to the US$. The Mexican Peso has been fairly stable for the last 6 months after its 2nd Q 2013 decline. The Ukrainian Hryvnia is interesting. Ukraine exports about 90 percent of its steel production, not much of which arrives in the US but the long term behavior of this currency illustrates what happens when a peg becomes unsustainable (Figure 2). We are reminded of Argentina in the 1990s and the situation within Europe today where high deficit nations are pegged to the Euro.
 Steel Market Update has long term graphs available on request for the Broad Index and all 16 of the currencies reviewed in this report.
Most US steel exports are destined for our NAFTA partners, the US $ has strengthened 8.7 percent against the C $ and 2 percent against the Peso in the last year. On January 1st last year the Canadian $ was at parity. In spits of NAFTA trade agreements our partner countries have no obligation to favor US products so a strengthening of the dollar has a direct negative influence on the desirability of our products in the rest of North America.


