

Market Data

December 22, 2013
GDP Growth Q3 2013- Third Estimate
Written by Peter Wright
The first estimate of Q3 GDP growth from the Bureau of Economic Analysis surprised on the upside with a growth of 2.82 percent annualized, the second estimate came in at 3.6 percent and the third at 4.1 percent, well within the range that results in the growth of steel demand. GDP in Q3 2013 was 1.97 percent higher than in Q3 2012. The major reason for the continual upward revision of third quarter data was the contribution of business inventory growth.
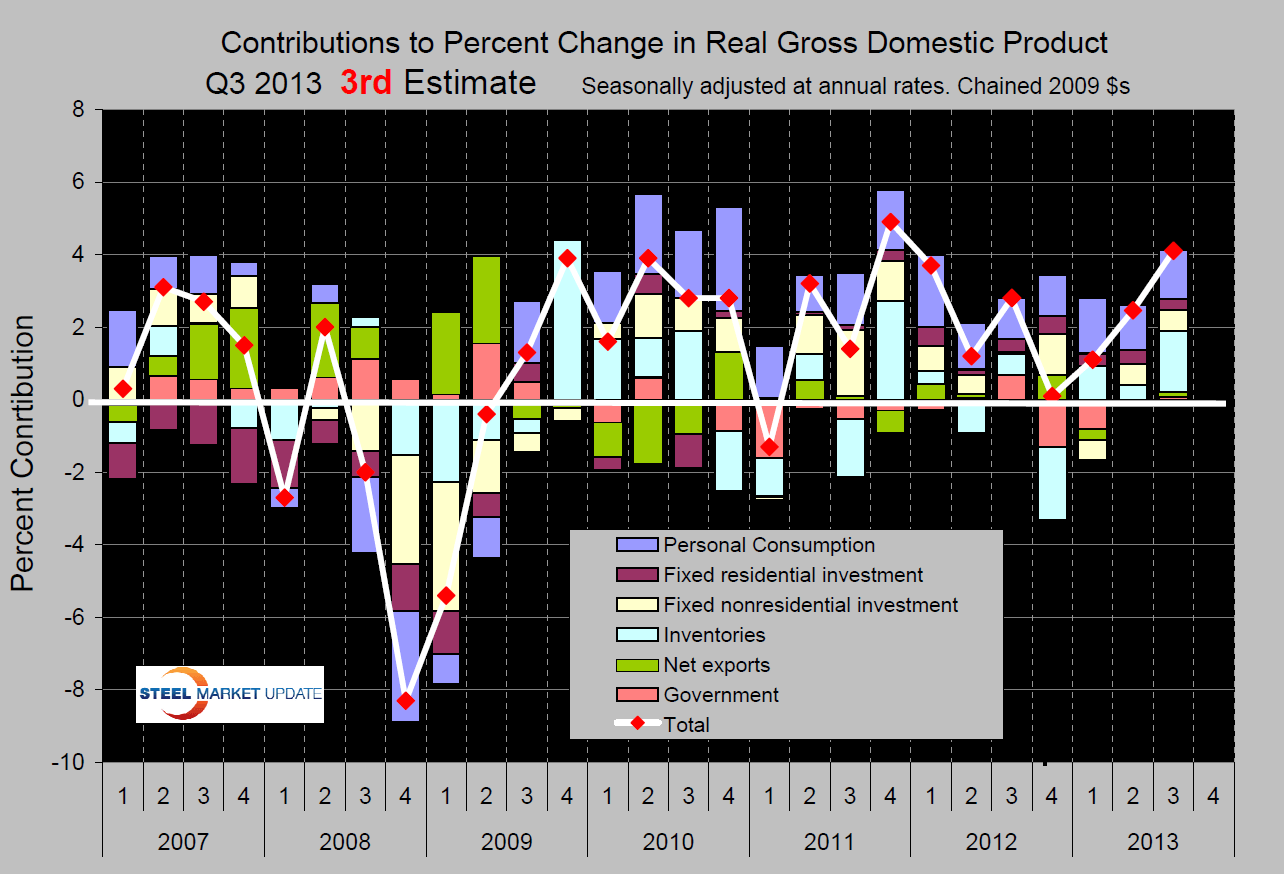 Figure 1 shows the SMU graphical analysis of contributors to GDP quarterly since Q1 2007. Compared to Q2 the major change was the contribution of business inventories which amounted to 0.41 percent in Q2 and 1.67 percent in Q3. Inventory contribution has been the most volatile component in the past but has not necessarily resulted in much of a change in total growth when inventories declined. Not surprisingly a strong inventory component in one quarter tends to promote growth in subsequent quarters. Durable goods continued to have a strong performance which supports the monthly Commerce Department data.
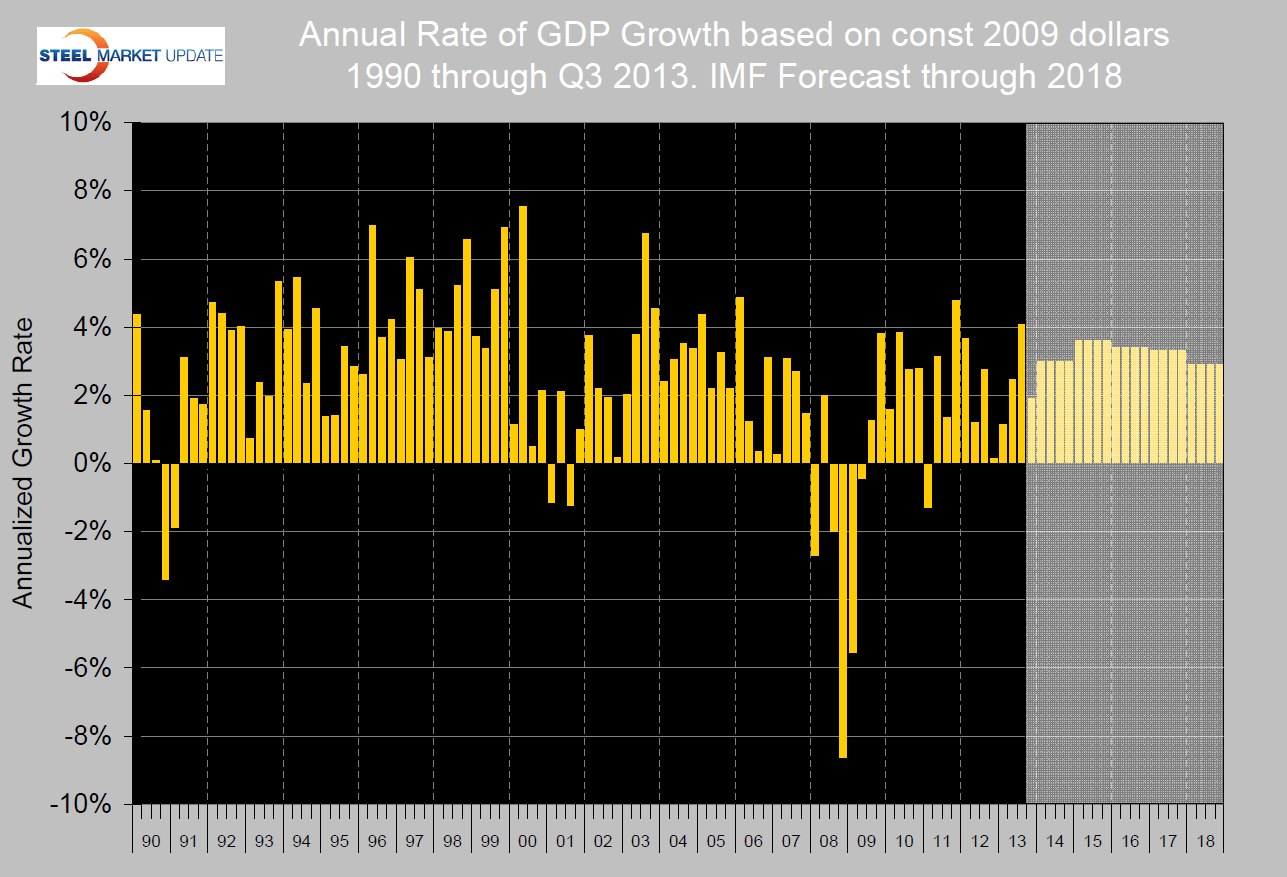
Figure 2 shows the growth of GDP quarterly since Q1 1990 with the IMF forecast through Q4 2018. Third quarter GDP growth beat the IMF expectation which was 1.9 percent and increased for the third straight quarter.
The following is an extract from Friday’s BEA report.
 “Real gross domestic product — the output of goods and services produced by labor and property located in the United States — increased at an annual rate of 4.1 percent in the third quarter of 2013 (that is, from the second quarter to the third quarter), according to the “third” estimate released by the Bureau of Economic Analysis. In the second quarter, real GDP increased 2.5 percent.
The increase in real GDP in the third quarter primarily reflected positive contributions from private inventory investment, PCE, nonresidential fixed investment, exports, residential fixed investment, and state and local government spending that were partly offset by a negative contribution from federal government spending. Imports, which are a subtraction in the calculation of GDP, increased.
Real personal consumption expenditures increased 2.0 percent in the third quarter, compared with an increase of 1.8 percent in the second. Durable goods increased 7.9 percent, compared with an increase of 6.2 percent. Nondurable goods increased 2.9 percent, compared with an increase of 1.6 percent. Services increased 0.7 percent, compared with an increase of 1.2 percent.
Real nonresidential fixed investment increased 4.8 percent in the third quarter, compared with an increase of 4.7 percent in the second. Nonresidential structures increased 13.4 percent, compared with an increase of 17.6 percent. Equipment increased 0.2 percent, compared with an increase of 3.3 percent. Intellectual property products increased 5.8 percent, in contrast to a decrease of 1.5 percent. Real residential fixed investment increased 10.3 percent, compared with an increase of 14.2 percent.
Real exports of goods and services increased 3.9 percent in the third quarter, compared with an increase of 8.0 percent in the second. Real imports of goods and services increased 2.4 percent, compared with an increase of 6.9 percent.
Real federal government consumption expenditures and gross investment decreased 1.5 percent in the third quarter, compared with a decrease of 1.6 percent in the second. National defense decreased 0.5 percent, compared with a decrease of 0.6 percent. Nondefense decreased 3.1 percent, the same decrease as in the second quarter. Real state and local government consumption expenditures and gross investment increased 1.7 percent, compared with an increase of 0.4 percent.
Real final sales of domestic product — GDP less change in private inventories — increased 2.5 percent in the third quarter, compared with an increase of 2.1 percent in the second.”


