Prices

August 29, 2013
Hot Rolled Futures: Bids Back Off
Written by John Packard
Financial Markets:
Since last week’s writing the SP 500 has since rallied to test the old support above at 1670 to then fail and drop to 1627 before rebounding in the last two days to 1642. As I mentioned, we are likely in a retracement move down to the 1550 target before we can find enough short cover and fresh buying to provide support. We will see how the market feels about things when we are there to know whether buying will ensue again. With the Fed looking determined to ease the easing, it’s hard to get excited about the stock market, and if it’s not going up…
Copper and Crude have gone in different directions. Copper has declined from $3.33/lb area to $3.2445/lb today. Tightness in this market from supply disruptions appears at an end and the speculative market is already pretty long. Probably continued pressure here. Crude, of course, is gyrating around due to the Syria sabre rattling. Sounds like it will be more than rattling. I should hope so after all this public posturing. Probably trying to gauge Russia’s reaction to the provocative statements before moving. Regardless Crude moved up from $2 plus on the 23rd on the initial coverage from White House and another $2 plus on the 27th as they appeared to re-iterate. Where we were $105/bbl on the 22nd we are now $108.77/lb, having reached a high of $112.20/bbl on the 27th. I f we strike the market will likely spike, but it’s unclear that the conflict has much of an effect on crude flows unless Iran tries to block the strait of Hormuz. It’s a nervous market.
Steel:
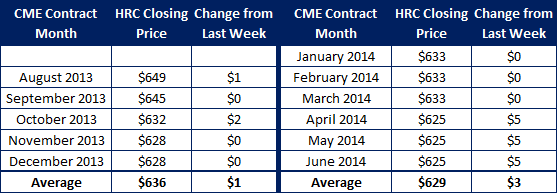
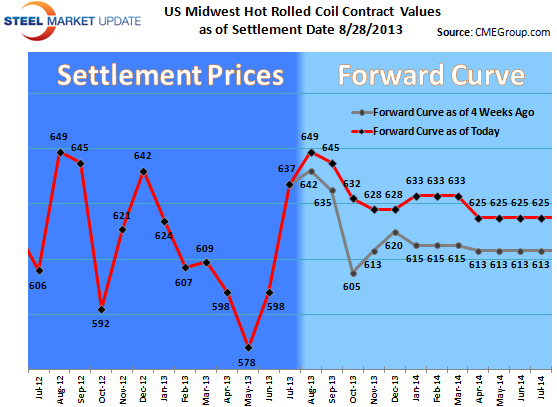
We’ve had a very light week this week in steel futures having traded only 421 lots or 8420 ST. The bulk of activity was in Jun/Aug 2014 which traded $625/ST. The forward curve is essentially unchanged from a week ago except that bids have backed off in the balance of the year. Market is weary of selling a market that has done nothing but go up for 14 weeks, but no one willing to buy it either. The CRU came out $649/ST down $2/ST. We have now essentially gone sideways for 5 weeks. Everyone watching the USS Lake Erie works negotiation to see if gets completed. This is a not immaterial 2.9 mln tons in a market where we are already back to similar capacity to May/June timeframe when we were at the at the lows on price.


Scrap:
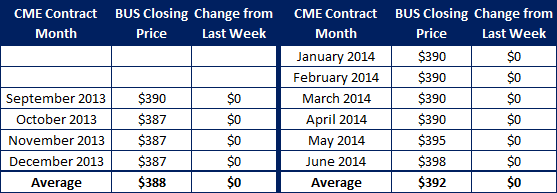
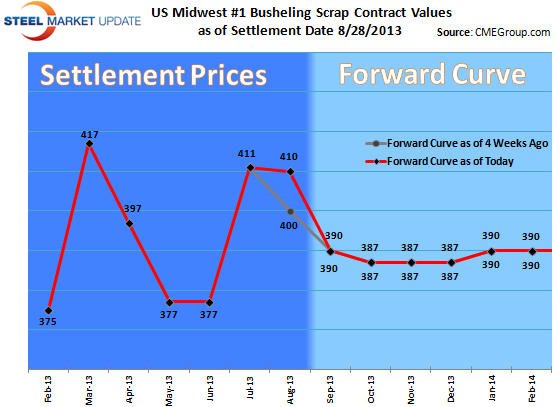
On the domestic front, what started off as a “slightly down to $10 down market” is now looking like a “definitely down $10 to maybe down $20 market”. This, for Shred, and everyone giving Primes higher marks. In this author’s experience, unusual spreads, like that between primes and shreds ($44 v. last month’s indexes) tend to revert, and I wouldn’t be surprised to see primes down as much as Shred, which would only maintain that wide spread, not reduce it. Flows may be less in some zones, but they are reported to be pretty decent in Mid West, like Detroit, and dealers risk be substituted for Shred if they don’t play ball on price. Regardless, we have a down month it looks like with Primes to come in around $390-400/T depending on region, and this will provide Mini’s an opportunity to get market share if they need it. Metal Margins are now at very healthy levels historically.
CFR Turkey appears to have peaked with that index drifting a tad lower, last $378/MT, from a high of $386/MT. The Turks have been quiet on buying in the last week as they digest where steel demand will actually surface. Last East Coast CFR sales, at around $376 zone, will likely not be repeated when the they re-appear in 2-3 weeks as their currency continues to be under pressure. This holds true for the Indian Rupee as well which has had a dramatic fall. Not positive for U.S export sales where Indian container sales have already long since been uncompetitive. In futures, we continue to be offered Q4 $375/MT area with little buying interest at present.
Iron Ore:
The market appears to be awaiting the next data that tells them whether China’s recent demand has been primarily inventory replenishment driven or real economic growth. July had a better growth figure than the prior month, which broke the downward trend. Now we need more evidence that there is some sort of growth trend in place, and not just a one month reprieve. Iron Ore is in holding mode for now not having changed much from the $137-139/MT zone on the index in the last week. Let’s call Aug either side of $137/MT, Sep either side of $134.50/MT, Q4 ’13 either side of $130.25/MT, Q1 ’14 either side of $127.25 and Cal ’14 either side of $117.25/MT. Not much change from last week.


