

Product
August 21, 2013
Galvanized Imports by Port & Country
Written by Peter Wright
This is one of an expanded series of analyses, exclusive to the Steel Market Update that is designed to provide a much more comprehensive view of actual volume of steel imports by product. This will enable a steel buyer or manager to see exactly what flat rolled steel came into his immediate vicinity and where it came from. This series of reports includes hot rolled, cold rolled, hot dipped galvanized and other metallic coated, (mainly Galvalume). We will publish these in the same format in four consecutive issues of the Steel Market Update. All volumes are in short tons. In the future, this information and the data behind it will be available to our Premium members on our new website.
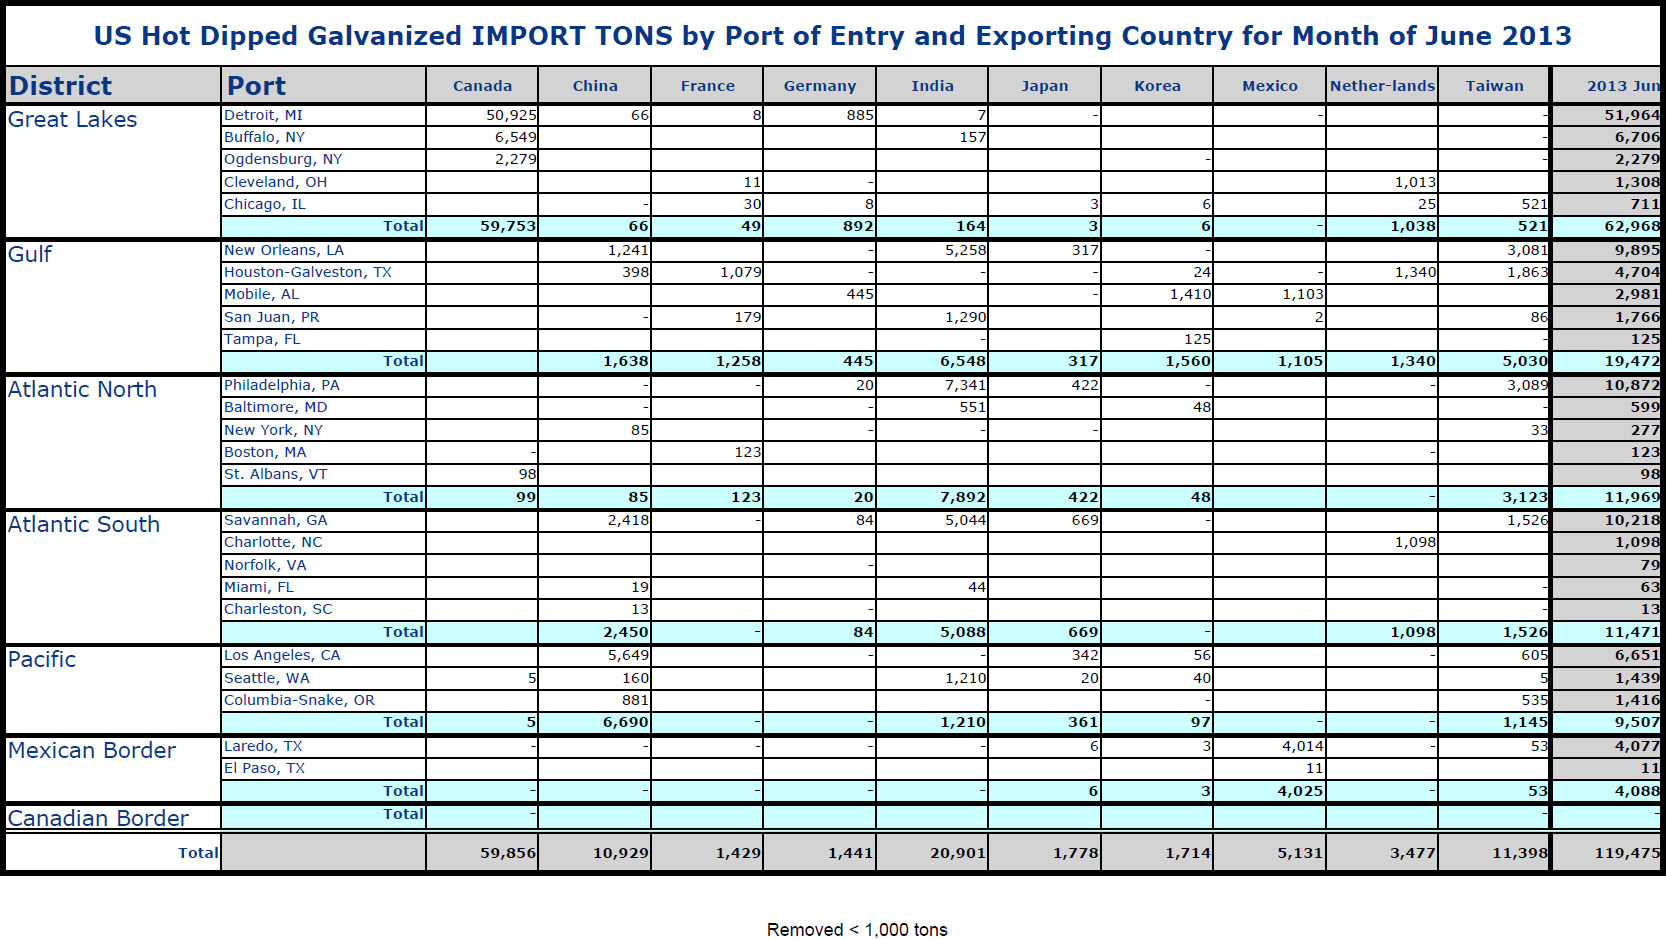
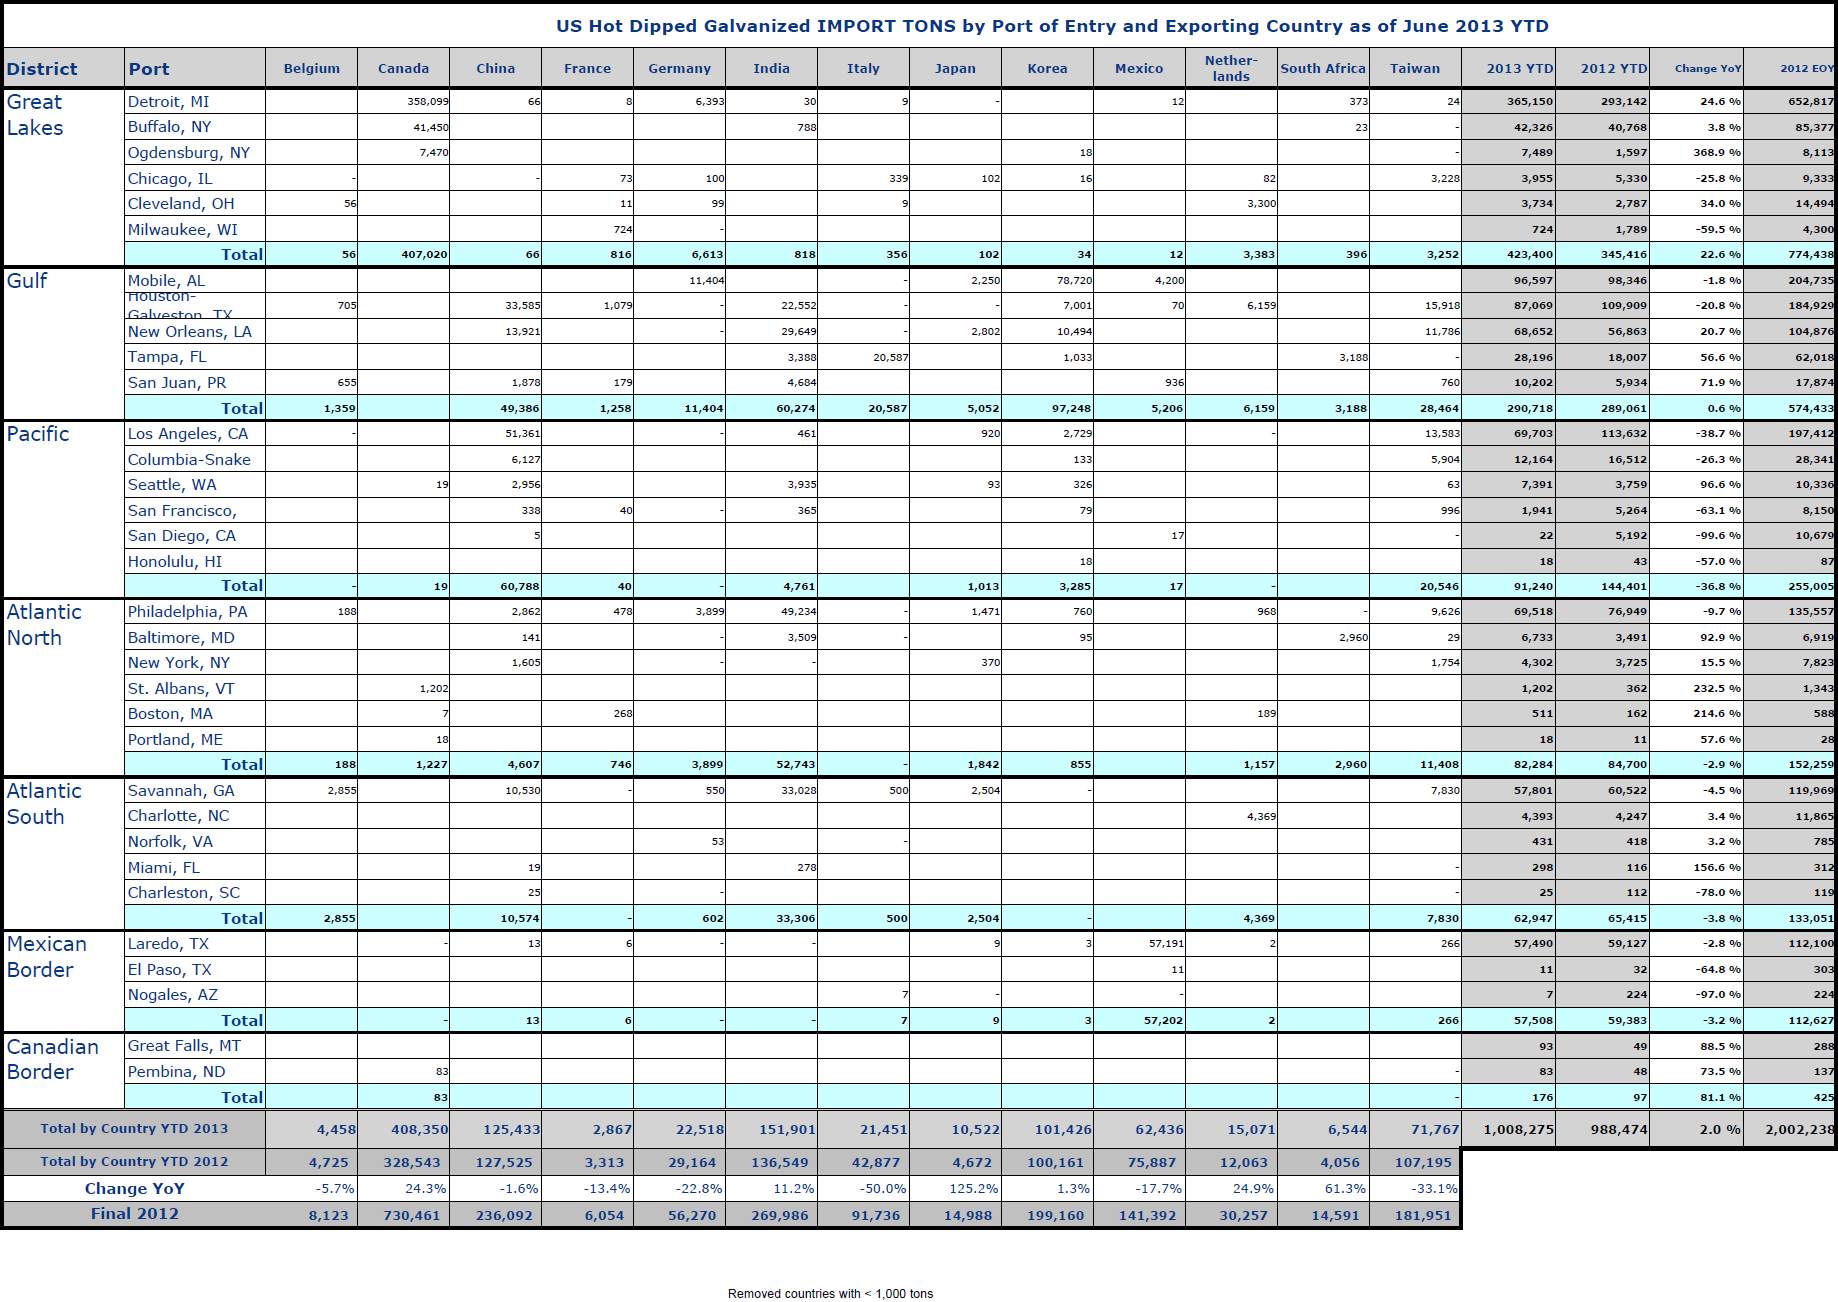
In tables 1 and 2 the smaller volume sources and ports of entry have been removed to make the tables more readable.
Total HDG import tonnage in June was 119,475, down by 35.4 percent from May and by far the lowest volume month of 2013. Even so the tonnage was up by 2.0 percent from June last year. Table 1 shows the detail by port of entry and country of origin. Canada accounted for 40.5 percent of the total tonnage with 408,350 tons. India was second with 15.1 percent followed by China with 12.4 percent. Over half the June tonnage entered through the Great Lakes with most of that into Detroit. India put 5,258 tons into New Orleans, 7,341 tons into Philadelphia and 5,044 tons into Savannah. Tables 1 and 2 are much too comprehensive for a detailed description but steel buyers can keep their suppliers honest by the judicious use of this data.
In 2013 YTD through June, 1,008,275 tons entered the US, down by 2.0 percent from the same period in 2012. Canada at 408,350 tons was up by 24.3percent compared to 2012 through June. India was a distant second at 151,901 tons followed by China at 125,433 tons. There was an increase of 22.6 percent into the Great Lakes region and a decrease of 36.8 percent into the Pacific coast. Table 2 gives detail of tons by port of entry for 2013 through June.
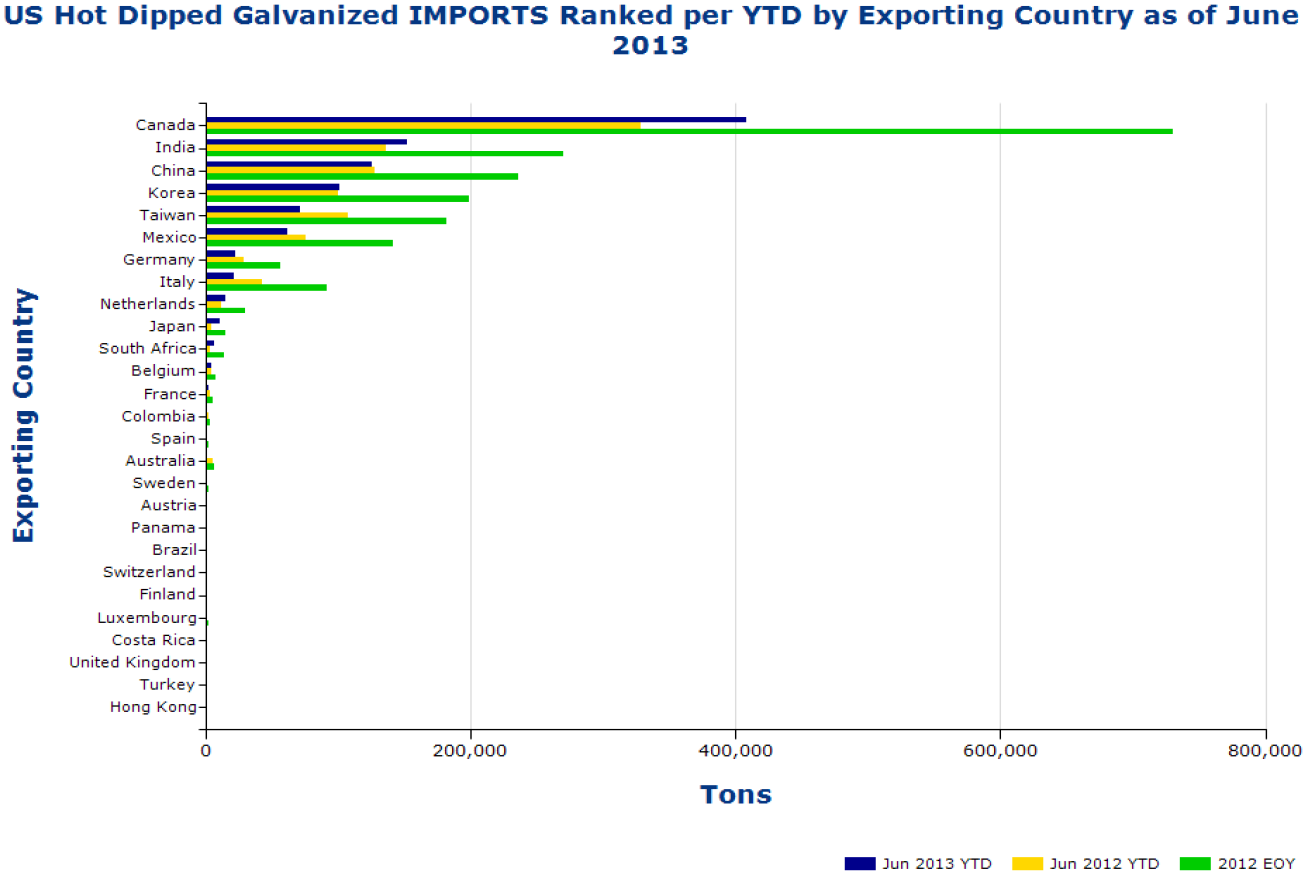
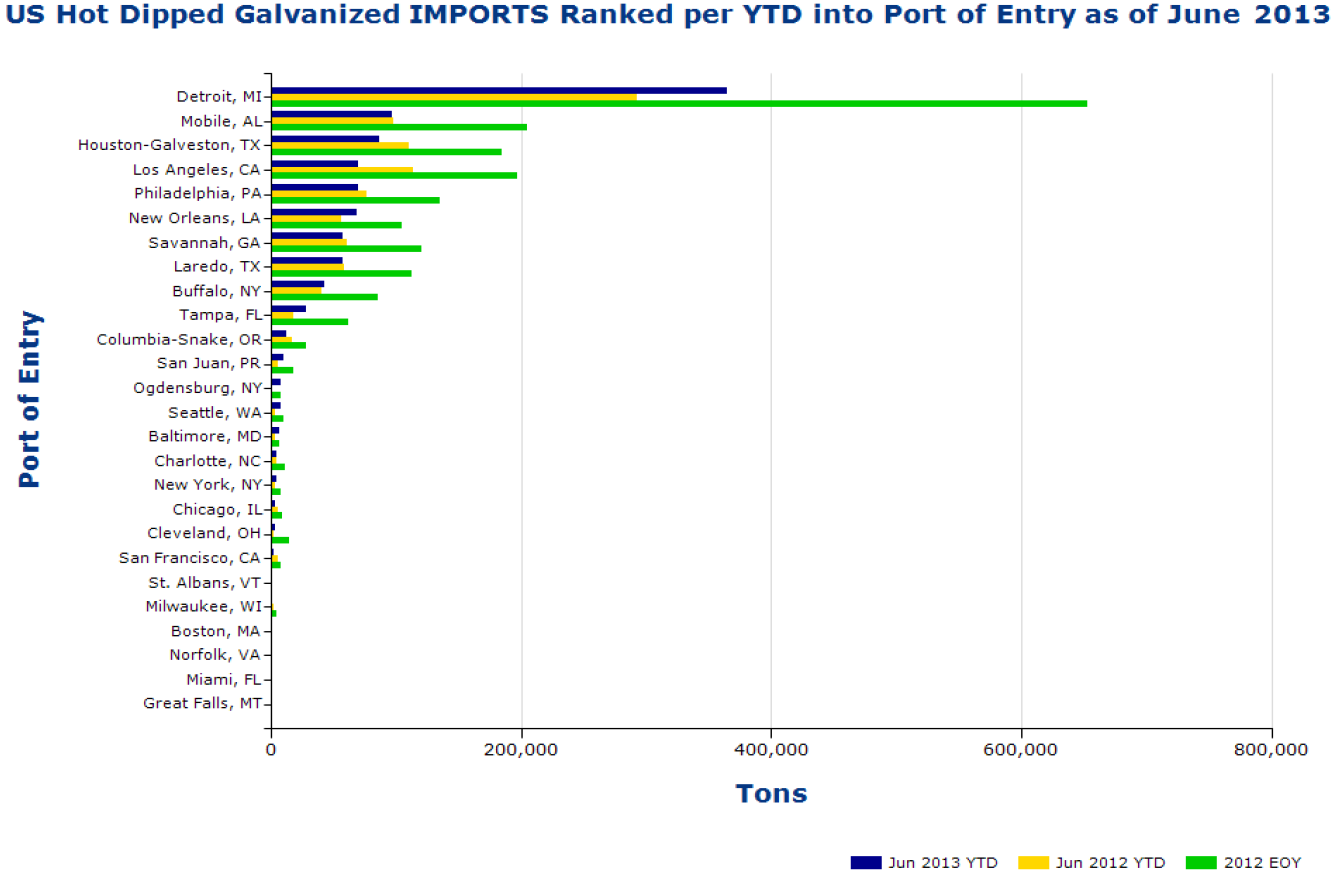
Volume YTD by source and by district of entry are shown graphically in Figures 1 and 2. The green bars indicate the final 2012 tonnage in each case. Countries and ports are ranked by the 2013 YTD tonnage. Figure 1 shows that tonnage from Canada and India is up compared to last year and Taiwan, Mexico, Germany and Italy are down. Figure 2 shows the tonnage by port. Detroit, New Orleans and Tampa are up this year and Houston and Los Angeles have seen a decrease in tonnage.


