We had an October surprise here at SMU on Wednesday. I was working from the CRU office in Pittsburgh, and the internet connection briefly went out. As luck would have it, that happened smack in the middle of a live Community Chat webinar.
Fortunately, my colleague David Schollaert stepped in, Zekelman Industries’ executive chairman and CEO Barry Zekelman rolled with the punches – and the show went on.
Could there be any more October surprises in store for us and for the steel market?
Tariffs and duties galore
If you listened to some recent campaign rhetoric, it might sound like there could be a series of them. Former President Donald Trump has said that, if re-elected, he might impose 50% tariffs on all imports. And perhaps three- or even four-digit tariffs on vehicles imported from Mexico. That would come on top of sweeping tax cuts.
Can he do that? We learned in Trump’s first term that the king-like powers US presidents have in trade matters can be used not only to create trade deals, as was originally envisioned. They can be used to break them too. We also learned that Trump wouldn’t hesitate to catch even the domestic market by surprise. That’s what he he did in the spring of 2018, when he hit US allies and foes alike with Section 232 national security tariffs.
Zekelman, like Trump, thinks that such measures will promote growth by bringing manufacturing jobs back to the US. And that the growth from that, combined with revenue from tariffs (even if they’re eventually negotiated lower), should fill in any budget holes left by tax cuts. More than a few mainstream experts would disagree with that calculus. But I think one thing we can all agree on is that such measures are not riding to steel’s rescue in the short term.
On a basic level, the next US president won’t be inaugurated until Jan. 20. And even more standard trade measures – like the AD/CVD case on coated sheet – probably won’t have a big impact until late Q4’24 or early Q1’25.
What happens in the meantime?
One theory: Prices remain sticky
I’ve heard from some buyers who are fishing for hot-rolled coil (HR) around $600 per short ton (st). And I’ve also heard from mills who have received those offers but aren’t willing to go that low.
Part of this is a regional story. In general, we’ve seen lower prices from certain mills in the Midwest and Canada. That comes even as EAFs in the South are trying to hold roughly around Nucor’s published price of $720/st.
One mill source told me that prices were sliding from the $700s/st to the $600s/st and that volumes were less robust than just a couple of weeks ago. But if there is one area where volumes are up, it’s the number of buyers “coming out of the woodwork” and angling for year-end deals, he said.
“They are looking for $30-31 (per cwt), skipping everything in between. There seems to be an expectation that domestics mills do, or will have, availability for late November and all of December,” he said.
Such buyers think that the market has gotten softer. He said his company couldn’t support such low numbers. “My sense is actual demand is the same as it was the last month. And inventories are being drawn down a bit. But the perception is that mills will be hungry. Because they will come out of maintenance and have more tons available,” the mill source said.
One end-user source was on roughly the same page. Certain mills have been slow to come out of maintenance. And he reasoned that while prices might continue to come down, they won’t collapse as they have in past cycles.
“You can’t have a crash. We’re not at some crazy high number where a couple of hundred come out of it,” he said.
And what comes down will eventually rise again. “Everyone is getting out at the same time. Everyone will come back at the same time. It’s the herd,” the end-user source said.
Another theory: The year-end deals cometh
But not all buyers are on the same page. One Midwest service center source said it’s not just perception that mills are hungry. “The North has been cheaper for a while. … And what’s going to change? Outages are complete. Lead times are at year end. And demand is not better – it’s significantly worse.”
As for $600/st, he said, “We’re all fishing for it. And someone is going to blink. It’s a (healthy) margin. And it keeps turning the wheel turning on your mill.”
Another Midwest service center source agreed. He ticked through the markets his company served. He said automotive (at least among some Detroit-area automakers) was slow, as was agriculture, and truck trailer. He described construction as a “mixed bag” – strong in some sectors, weaker in others.
Turning to the galvanized market, the second Midwest service center source said base prices as low as $860-870/st were readily available for even smaller spot orders. And he questioned whether prices in the low $800s or even high $700s might soon be in the market. That would track roughly with the $200/st spread mills have tried to maintain between HR and base prices for tandem products.
He wasn’t personally aware of spot numbers like that. But he said he’d seen revised contract terms that achieved roughly the same effect. “With some of the mills, rather than lower the (spot) number, they are saying, ‘OK, you have a max of X (contract tons). And you can now have X+ with a 6-8% discount.”
Note that 6-8% is a standard contract discount to spot prices.
“But who wants to load up on steel in November or December unless you’ve got a great deal?” he asked. “We are pretty convinced that this party is over.”
Tampa Steel Conference
Speaking of the winter months, don’t forget to reserve your spot away in the Florida winter sun. The Tampa Steel Conference, which SMU does together with Port Tampa Bay (PTB), will be back and better than ever on Feb. 2-4, 2025. You can learn more and register here.
Steel Dynamics Inc. remains optimistic about its prospects as it ramps up flat-rolled steel operations and prepares for the production of aluminum products next year.
Executives from the Fort Wayne, Ind.-based steelmaker provided an update on the company’s operations on a conference call on Thursday held to discuss SDI’s third-quarter earnings results.
Flat-rolled steel segment
SDI’s Q3 shipments of flat-rolled steel inched 1% higher from the previous quarter to just under 2.4 million short tons (st). Compared to the year-ago quarter, flat rolled shipments were 7% higher.
During the quarter, the company shipped 942,000 st of hot-rolled steel, 118,000 st of cold-rolled sheet, and 1,335,000 st of coated products.
Sinton sheet mill
The Sinton, Texas, sheet mill has faced numerous challenges and outages. But it’s also seen significant improvements in reliability and utilization, executives on the call said.
SDI President and COO Barry Schneider said that, early in Q3, the Sinton team experienced some difficulty ramping back up after a four-day outage.
Sinton operated at 72% utilization in Q3. SDI expects that rate to increase to 75% in Q4 and to reach full production capacity in 2025.
New coating lines
SDI’s four new coating lines – two each at the mills in Sinton, Texas, and Terre Haute, Ind. – were successfully commissioned and have commenced operations.
All four of the new lines are operating at 65-75% of capacity, Schneider said on the call.
CEO Mark Millett added, “The volume throughput on those lines is a little inhibited right now because of the hot side not (being) at full capacity.”
At Sinton, “The additional lines really allow us to have a more efficient operation between our galvanized coatings and our Galvalume coatings,” Schneider said.
The new lines in Terre Haute are improving the facility’s reach into more markets. The Galvalume and prepaint offerings there have opened relationships with new, as well as existing, customers in that region, he said.
Aluminum – a new market for SDI
Next year, SDI will officially become a producer of flat-rolled aluminum products.
Millett said the company’s new facility in San Luis Potosi, Mexico, will start producing slabs in Q1’25.
And at the greenfield rolling operations in Columbus, Miss., SDI plans to commission the casthouse in Q1’25 and two downstream lines in Q2’25.
SDI expects commercial shipments at the facility, also known as Aluminum Dynamics Inc. (ADI), to begin in mid-2025. The company expects the rolling mill to reach 75% of its 650,000-metric-tons-per-year capacity by the end of 2026.
“The excitement within our company, and particularly at the ADI sites, continues to grow as our teams recognize their ability to help revolutionize the US aluminum industry, as they did in steel,” Millett said.
CMC
Fourth quarter ended Aug. 31
2024
2023
Change
Net sales
$1,996.1
$2,209.2
-9.6%
Net income (loss)
$103.9
$184.2
-43.6%
Per diluted share
$0.90
$1.56
-42.3%
Full year ended Aug. 31
Net sales
$7,925.9
$8,799.5
-9.9%
Net income (loss)
$485.5
$859.7
-43.5%
Per diluted share
$4.14
$7.25
-42.9%
(in millions of dollars except per share)
Earnings Results
In its latest quarterly earnings statement, CMC reported solid demand despite increased headwinds from uncertainty regarding interest rates and the outcome of US elections.
CMC’s fiscal fourth-quarter sales dropped 9.6% from a year earlier, while net income plummeted 43.6% (see chart). For fiscal year 2024, sales were down nearly 10% from the prior year, while net income dropped 43.5%, the Irving, Texas-based longs producer and metal recycler said on Thursday.
President and CEO Peter Matt noted that the company “felt the impact of increased macroeconomic and political uncertainty.”
In North America, Q4 finished steel volumes totaled 759,000 short tons (st), down 0.7% sequentially but up 0.3% year over year (y/y). Average selling prices were down by $89/st, while the cost of scrap utilized dropped by $17/st. This resulted in steel product margins over scrap declining by $72/st compared to last year.
Rebar and merchant bar products had average selling prices of $667/st in the quarter, down 2.1% vs. the previous quarter and 2.2% lower than the year-ago quarter.
Raw material shipments in North America were 3% lower sequentially but 5% higher y/y at 360,000 st. The average selling price of raw materials was $866/st in Q4’24, a 10.7% decrease from $970/st in the prior quarter but 3.3% above Q4’23.
In Europe, where CMC operates a mill in Poland, the steel group faced challenges from increased imports and supply discipline among domestic producers. Net sales for the region improved 6% quarter on quarter but were down 19% y/y to $222.1 million. Steel shipments of 391,000 st were 32% higher sequentially and 0.5% better than the year-ago quarter.
Outlook
Matt expressed excitement about the strategic path forward despite anticipating a sequential decline in fiscal Q1’25 earnings. “Current market conditions represent a transient period of softness created by uncertainty regarding important factors that influence any major capital investment – the cost of funding and future government policy,” he commented.
He added that “clarity will emerge in the coming months,” with expectations of renewed strength in CMC’s core markets.
Expansions updates
The ramp-up of CMC’s Arizona 2 (AZ2) micro mill continues, with merchant bar quality (MBQ) commissioning progressing, the company said. It previously disclosed a full run rate target of 500,000 st, 350,000 st of rebar, and 150,000 st of merchant bar.
“We continue to feel good about our progress in increasing operating levels,” Matt said, adding that they expect to be “at or near” the targeted full run rate at the end of 2025.
Meanwhile, construction continues on CMC’s fourth micro mill in West Virginia. It remains on target to commission the 500,000-st-per-year facility late in 2025.
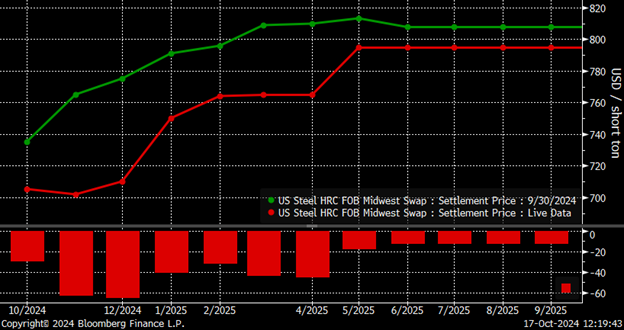
After a relatively stable and boring September, CME hot-rolled coil (HRC) futures have been on the move lower thus far in October. Since Sept. 30, the November and December futures have declined $63 and $65, respectively, with the curve’s contango steepening.
CME hot-rolled coil futures curve $/st
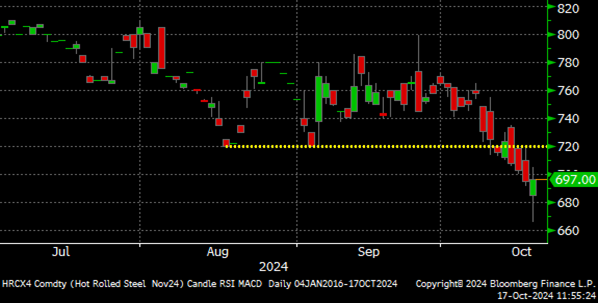
The November future traded down to a new low of $720 on Aug. 16 before rebounding to $780 only six trading sessions later. The November future traded back down once again testing the $720 low on Sept. 4 and 5 before rebounding one more time, ultimately trading to as high as $799 on Sept. 25. On Oct. 9, the November future tested the $720 low for the third time. It printed as low as $714, but then settled that day at $725, back above what was looking to be a decent support level. However, the $720 level failed to hold with the November future, having settled below $720 in each of the past four trading sessions. At 5:14 am CT on Thursday, it fell to a new intraday low, trading one lot at $666 before trading back up to settle the day up $7 at $702.
November CME HRC future $/st
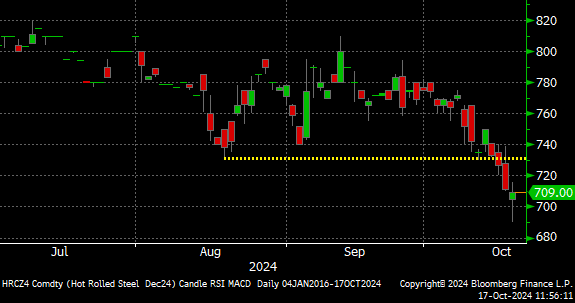
Similarly, the December future had found support around the $730 level, but like the November future, the support level failed. The December future has settled below $730 the past three sessions, trading as low as $690 late last night before moving back to about unchanged, settling at $710.
December CME HRC future $/st
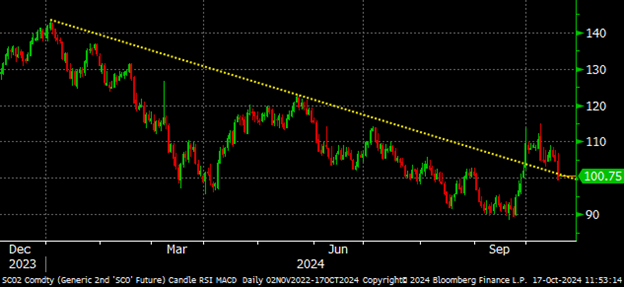
The fizzle heard round the world. One reason for this morning’s early aggressive selling was a much anticipated announcement out of China’s government with hopes it would provide concrete details with respect to their latest round of economic stimulus measures. As you can see in iron ore’s response below, the actual stimulus was ‘underwhelming.’ For now, you can cross a global Chinese stimulus led commodity rally off the bullish factors list.
Rolling 2nd month SGX iron ore future $/mt
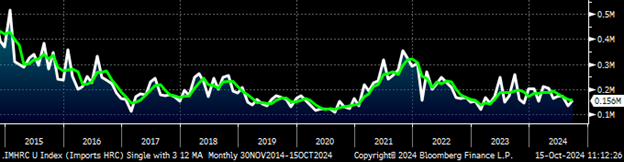
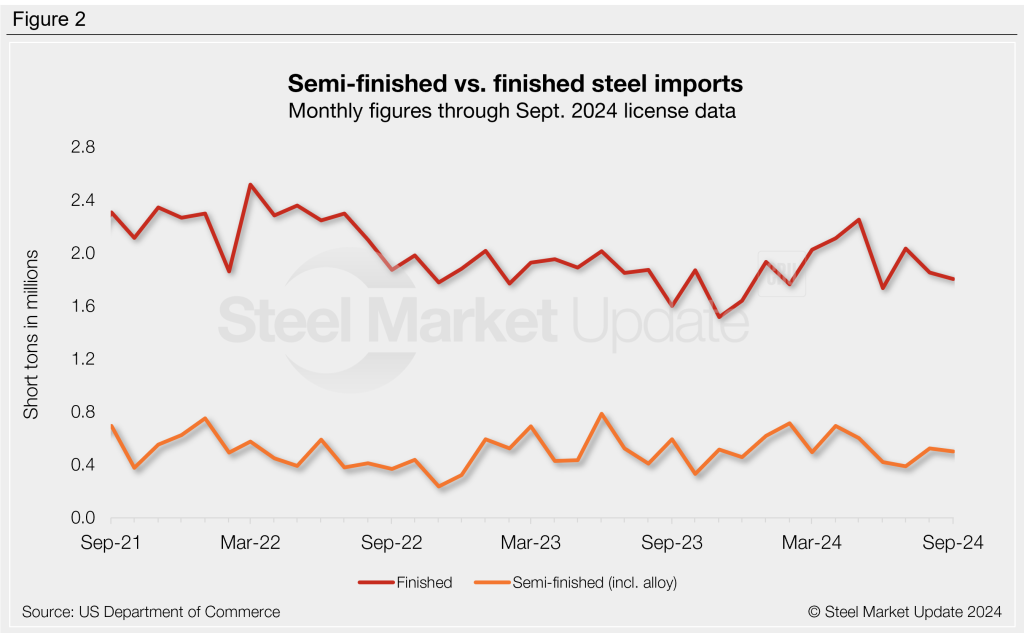
Back on the home front, perhaps the HRC market is not as bad as the futures make it seem. The initial determination in the CORE trade case is scheduled for Monday. There was a massive increase in imports of tandem products in the first half of 2024, but imports of HRC remained flat as exhibited by the three-month moving average in green. Moreover, it seems a reliable assumption that 2025’s flat rolled imports will be down notably on a year-over-year (y/y) basis due to weak market sentiment, relatively unattractive spreads for months, and uncertainty related to the CORE trade case. If that assumption proves correct, then those swing tons should move back into the hands of the domestic mills.
Imports – HRC sheets
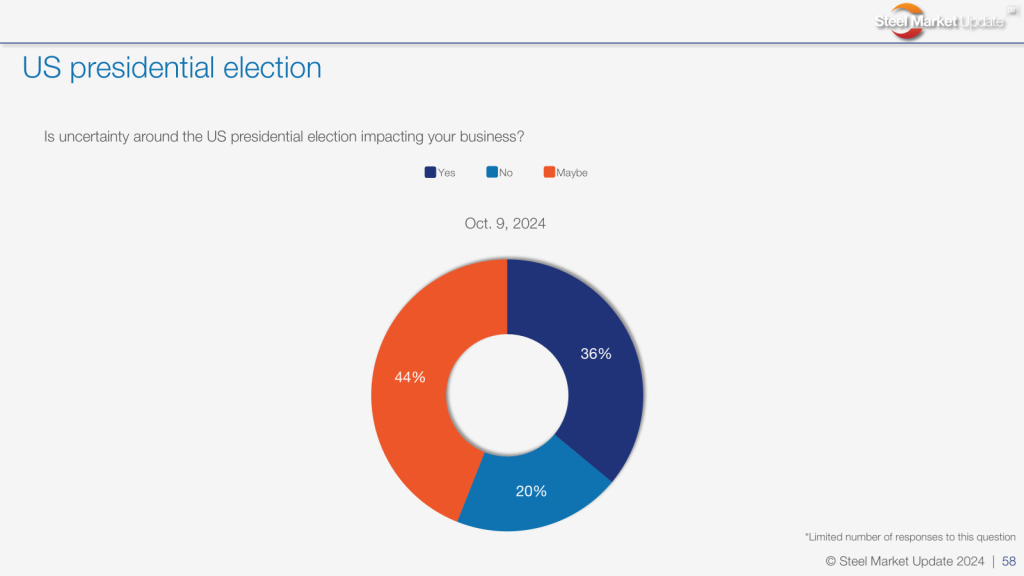
We are less than three weeks away from the 2024 presidential and congressional election and how the market has slowed. How much of the slowdown is due to members of the supply chain sitting on their hands waiting to know the outcome of the election?
Consider how much energy surrounds each and every Federal Open Market Committee (FOMC) meeting. Financial markets slow down a week or a few days ahead of the meeting. On the day of the announcement, the financial market news channels are packed with commentary and expectations of what the Fed will do. Then at 1 pm CT, the FOMC announces their decision with Mike McKee of Bloomberg or Steve Liesman at CNBC revealing the news. Financial markets react violently and then calm ahead of the 1:30 press conference. Every word of Fed Chair Jerome Powell’s comments are scrutinized as the markets swing in response to each answer. Finally, Powell wraps up the Q&A while the markets continue to react into the close as financial pundits comment on the day’s events well into the evening. All of this over whether the Fed moved interest rates by 25 basis points or 50 basis points, and what they might do at the next meeting 30 to 60 days out.
Now put the magnitude of a Fed decision in the context of what is going to happen over the next four years as determined by the winner of the US presidential race, and to a lesser extent control of congress. Regardless of who wins, there will be massive winners and losers as a result. For instance, if the Republicans win, the oil and gas industry will benefit. However, if the Democrats win, solar and wind will undoubtedly be favored. Those are easy examples, but the list of industry winners and losers depending on the outcome runs deep. Thus, it is no surprise that the steel industry and economic decision-making writ large slows down weeks before the election just like financial markets slow hours before the FOMC decision.
Furthermore, irrespective of the winner, simply knowing the outcome of the election and pushing the uncertainty aside triggers a wave of business planning and decision making. Thus, how much of the current malaise in the steel industry is due to the uncertainty surrounding the election? More importantly, how will the market react three weeks from now once that uncertainty is resolved? Will it unleash pent-up demand?
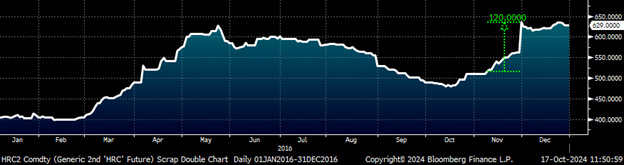
The steel price saw a pop following the past two elections in 2016 and 2020. On Nov. 8 of 2016 (election day), the rolling 2nd month Midwest HRC future settled at $515, before shooting up $120 to $635 on Nov. 30.
Rolling 2nd month CME HRC future $/st – 2016
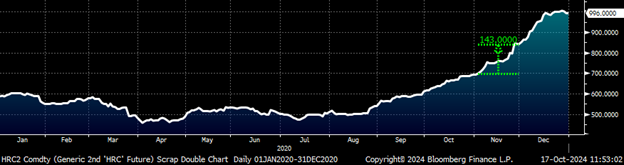
On Nov. 3, 2020 the rolling 2nd month future settled at $698. While it was Democrat Joe Biden that won this time, steel prices still jumped $143 to settle at $841 on Nov. 30.
Rolling 2nd month CME HRC future $/st – 2020
Look folks, I was born into a middle class family. Now we can debate which candidate is better for the steel industry, perhaps whether one of the candidates could be the greatest president of all time for the steel industry. Regardless of who is better for steel and regardless of who wins, we do know that human beings do not like uncertainty, that businesses do not like uncertainty. We do know that a tremendous amount of uncertainty about the next four years will be lifted on Nov. 5.
Disclaimer: The content of this article is for informational purposes only. The views in this article do not represent financial services or advice. Any opinion expressed by Mr. Feldstein should not be treated as a specific inducement to make a particular investment or follow a particular strategy, but only as an expression of his opinion. Views and forecasts expressed are as of date indicated, are subject to change without notice, may not come to be and do not represent a recommendation or offer of any particular security, strategy or investment. Strategies mentioned may not be suitable for you. You must make an independent decision regarding investments or strategies mentioned in this article. It is recommended you consider your own particular circumstances and seek the advice from a financial professional before taking action in financial markets.
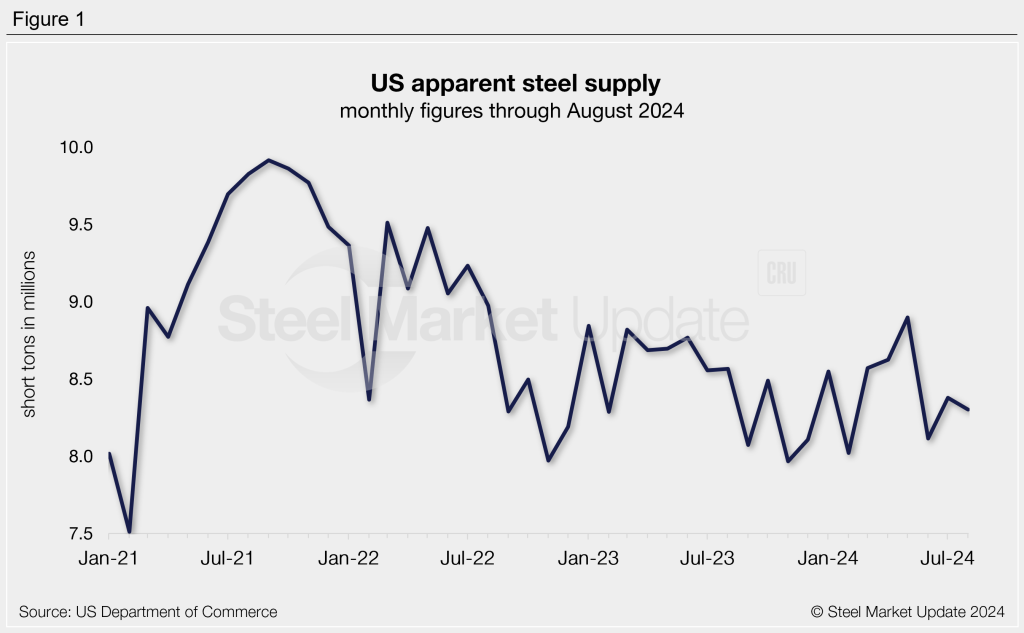
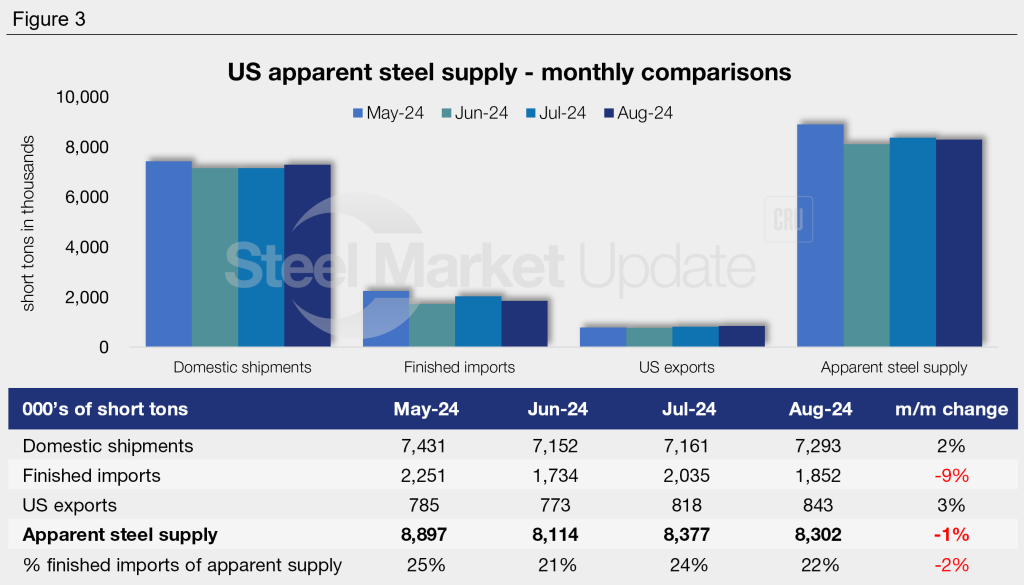
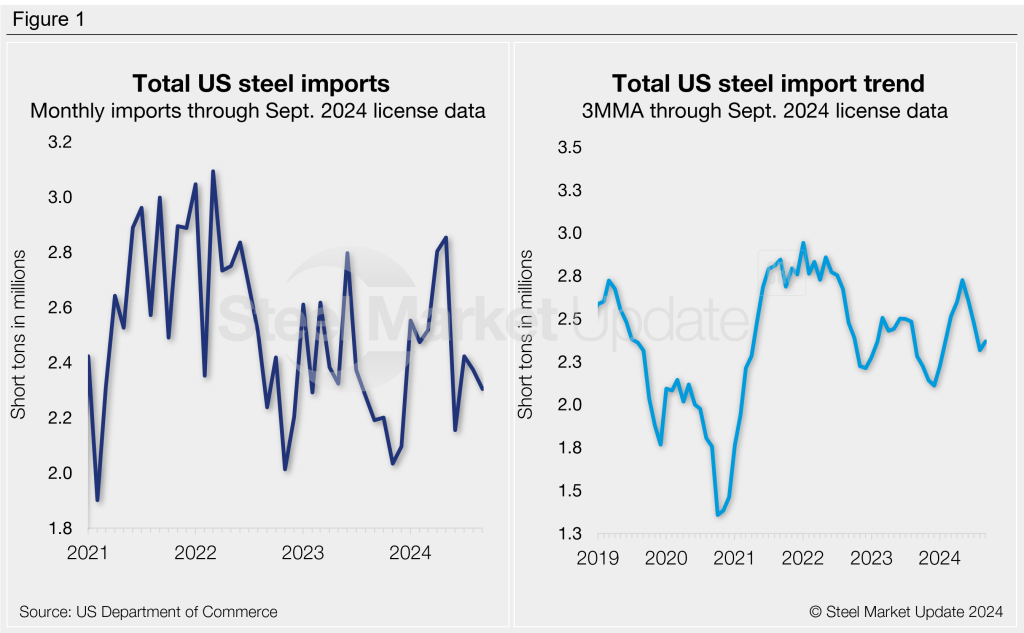
The volume of finished steel entering the US market declined in August from July, according to SMU’s analysis of data from the US Department of Commerce and the American Iron and Steel Institute (AISI). Referred to as ‘apparent steel supply,’ we calculate this monthly rate by combining domestic steel mill shipments and finished US steel imports and deducting total US steel exports.
Apparent supply registered 8.30 million short tons (st) in August. Supply declined by 1%, or 76,000 st, from the month prior and is 2% below the average monthly rate of 2024 (8.43 million st). Recall that earlier this year supply reached a 21-month high in May at 8.90 million st. This time last year apparent supply totaled 8.56 million st.
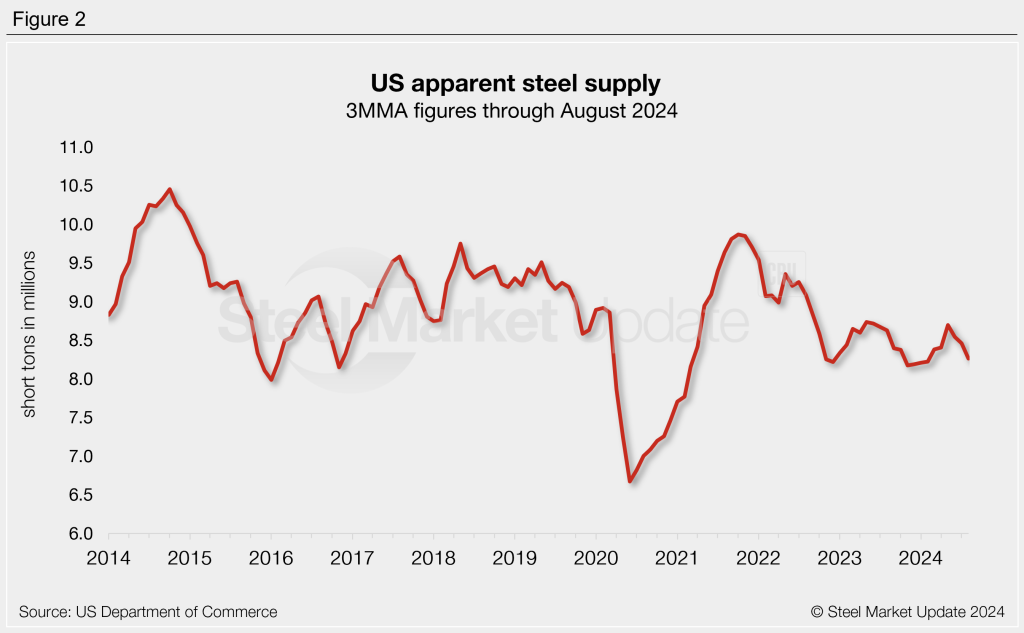
Trends
To smooth out the variability seen month to month, we can calculate supply levels on a three-month moving average (3MMA) basis to better show long-term trends. As shown in Figure 2, supply on a 3MMA basis has generally trended downward over the past three years, following the late 2021 peak of 9.87 million st. The 3MMA has eased each of the past three months, following May’s 11-month high of 8.70 million st. The August 3MMA is now down to a six-month low of 8.46 million st. Compare this to the 2023 monthly supply average of 8.49 million st and the 2022 average of 8.83 million st.
Looking across the last four months, August apparent supply is on the lower side of recent rates. Over this period we have witnessed a recovery in domestic mill shipments, fluctuating finished imports, and strengthening exports. The decline from July to August was primarily due to a 183,000-st (9%) decline in finished imports and a 24,000-st (3%) increase in exports, more than half of which was negated by a 132,000-st (2%) rise in domestic shipments.
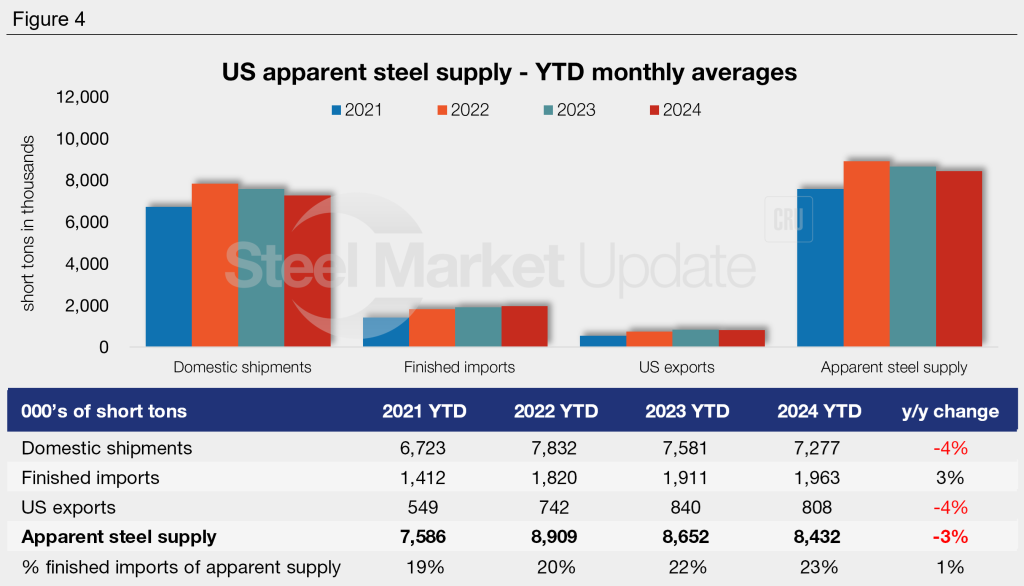
Figure 4 shows year-to-date (YTD) monthly averages for each statistic over the last four years. The average monthly supply level for the first eight months of 2024 now stands at 8.43 million st, 3% less than the same period last year. The highest YTD monthly average in our recent history was for 2022 at 8.91 million st. In this time we have seen consistent growth in finished imports, while domestic shipments and total exports have fluctuated.
To see an interactive graphic of our apparent steel supply history, click here. If you need any assistance logging into or navigating the website, contact us at info@steelmarketupdate.com.
Scrap prices ticked up in October outside of Chicago and Detroit, scrap sources told SMU.
“There is no doubt in my mind that we are past the bottom of this year’s scrap market at this point,” one scrap source said. “Whether we move higher in November or have to wait until December is the question.”
A second source said he forecast that if November goes sideways, December will be up. On the other hand, “if November goes up, most likely December will go sideways.”
The first source noted there is a sense that US demand will be better as we move past fall outages.
“It is possible that several large mill group buyers did not buy all they wanted in October,” he added. “And Turkish demand could improve between now and then.”
Regarding the Chicago and Detroit markets in October’s trade, he surmised there was enough supply in those Midwest areas to satisfy what seemed to be still lackluster demand. (See RMU’s Stephen Miller’s column here for more on October market dynamics.)
SMU’s October scrap pricing stands at:
Busheling at $390-420 per gross ton (gt), averaging $405, up $10 from September.
Shredded at $380-400/gt, averaging $390, up $15 from September.
HMS at $330-350/gt, averaging $340, up $17.50 from September.
After the settle
The first source noted that after the October trade he has seen more supply of scrap, particularly from Europe, offered to Turkish mills. He added that as a result, prices for 80/20 have fallen now $12-15/gt in just the last week.
“Waning excitement over that time about Chinese fiscal and monetary stimulus have accelerated this drop in global scrap prices,” he said. “What this means for the November ferrous trade in the US remains to be seen.”
A second source remarked that the expectation for the November/December market is to be a 60-day market as opposed to two 30-day markets.
“Suppliers are expecting another $20 increase between now and the end of the year, primarily because of lack of supply,” he said. “Consumers will most likely counter with sideways and point to lower finished steel prices and export market stalling.”
US hot-rolled (HR) coil prices slipped again this past week, mirroring movement in offshore markets. This kept domestic tags marginally higher than imports on a landed basis.
Stateside prices had been slowly pulling ahead of imports after reaching parity with import pricing in late August. Prices have been mostly stable over the past seven weeks, resulting in only negligible shifts in the US price premium.
SMU’s check of the market on Tuesday, Oct. 15, put average domestic HR tags at $690 per short ton (st), down $5/st from the week before. US hot band did rebound from July’s 20-month low, but prices have since varied little, with average prices rising just $55/st over the past nearly three months.
Domestic HR is now theoretically 4.7% more expensive than imported material. That’s nearly flat, just a touch above last week’s reading of 4.6%. While the gains have been negligible at times, prices are still up from late July, when stateside products were ~12% cheaper than imported HR.
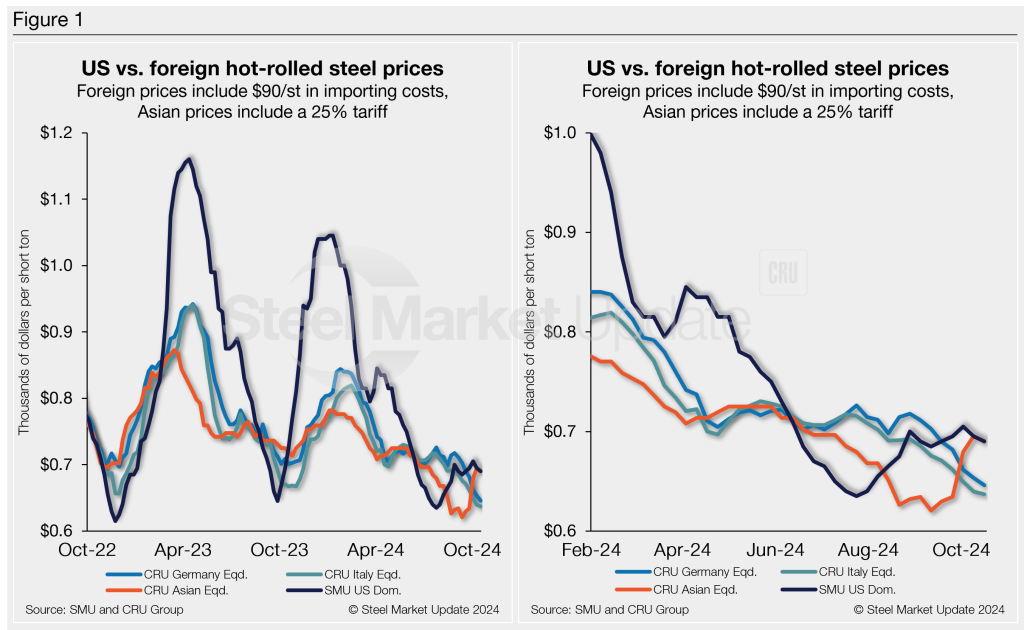
In dollar-per-ton terms, US HR is now, on average, $32/st more expensive than offshore product (see Figure 1). That’s flat compared to last week. Prices are still up $104/st from late July when US tags were ~$72/st cheaper than offshore material.
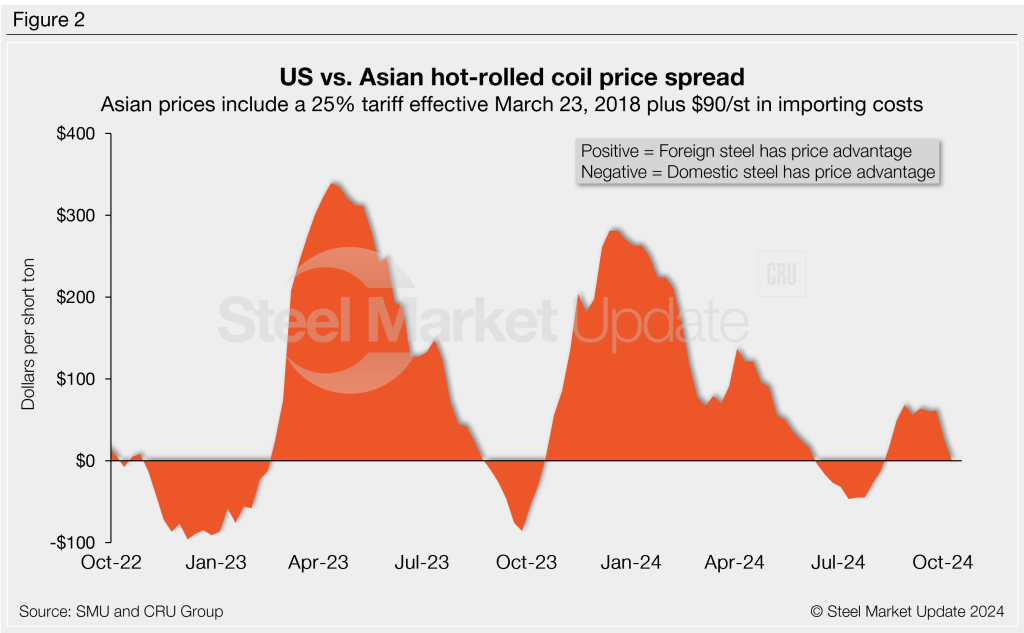
The charts below compare HR prices in the US, Germany, Italy, and Asia. The left-hand side highlights prices over the last two years. The right-hand side zooms in to show more recent trends.
Methodology
This is how SMU calculates the theoretical spread between domestic HR coil prices (FOB domestic mills) and foreign HR coil prices (delivered to US ports): We compare SMU’s weekly US HR assessment to the CRU HR weekly indices for Germany, Italy, and East and Southeast Asian ports. This is only a theoretical calculation. Import costs can vary greatly, and that can influence the true market spread.
We add $90/st to all foreign prices as a rough means of accounting for freight costs, handling, and trader margin. This gives us an approximate CIF US ports price to compare to the SMU domestic HR coil price. Buyers should use our $90/st figure as a benchmark and adjust up or down based on their own shipping and handling costs. If you import steel and want to share your thoughts on these costs, please get in touch with the author at david@steelmarketupdate.com.
Asian HRC (East and Southeast Asian ports)
As of Thursday, Oct. 17, the CRU Asian HRC price was $480/st, a $4/st decrease vs. the week prior. Adding a 25% tariff and $90/st in estimated import costs, the delivered price of Asian HRC to the US is approximately $690/st. As noted above, the latest SMU US HR price is $690/st on average.
The result: US-produced HR is theoretically even with steel imported from Asia. Despite the sideways week-over-week (w/w) margin move, it’s a far cry from late December, when US HR was $281/st more expensive than Asian products.
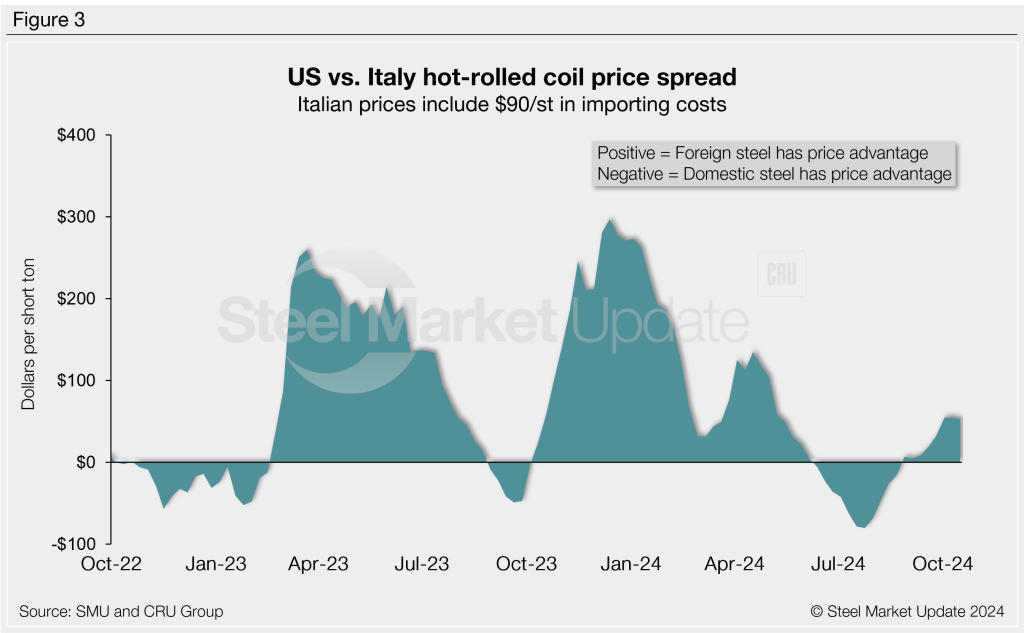
Italian HRC
Italian HR prices declined $3/st to $547/st this week, according to CRU. After adding import costs, the delivered price of Italian HR is, in theory, $637/st.
That means domestic HR coil is still theoretically $53/st more expensive than imports from Italy. That spread is unchanged w/w as both markets edged lower. Recall that US HR was $297/st more costly than Italian hot band just five months ago.
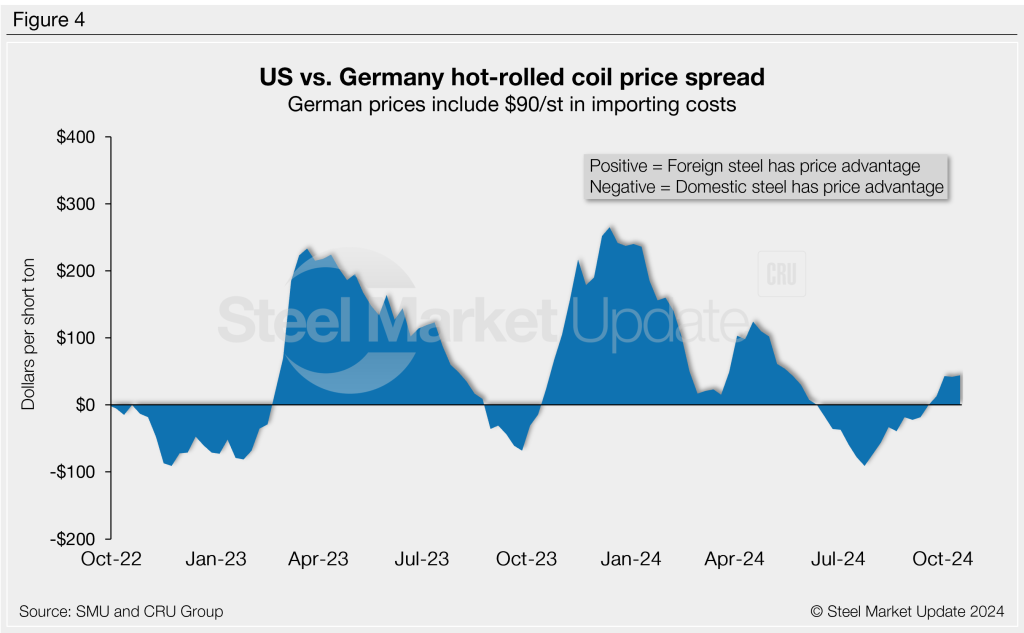
German HRC
CRU’s German HR price moved down $7/st to $556/st this week. After adding import costs, the delivered price of German HR coil is, in theory, $646/st.
The result: Domestic HR is theoretically $44/st more expensive than product imported from Germany, up $2/st w/w. Stateside hot band was at an $18/st discount just about a month ago. At points in 2023, in contrast, US HR was as much as $265/st more expensive than imported German hot band.
Notes: Freight is important when deciding whether to import foreign steel or buy from a domestic mill. Domestic prices are referenced as FOB the producing mill. Foreign prices are CIF, the port (Houston, NOLA, Savannah, Los Angeles, Camden, etc.). Inland freight, from either a domestic mill or from the port, can dramatically impact the competitiveness of both domestic and foreign steel. It’s also important to factor in lead times. In most markets, domestic steel will deliver more quickly than foreign steel. Effective Jan. 1, 2022, Section 232 tariffs no longer apply to most imports from the European Union. It has been replaced by a tariff rate quota (TRQ). Therefore, the German and Italian price comparisons in this analysis no longer include a 25% tariff. SMU still includes the 25% Section 232 tariff on prices from other countries. We do not include any antidumping (AD) or countervailing duties (CVD) in this analysis.
Barry Zekelman, executive chairman and CEO of Zekelman Industries, joined SMU for another Community Chat on Wednesday.
SMU Managing Editor Michael Cowden led the conversation, with SMU Senior Analyst David Schollaert stepping in to pinch-hit for part of the call. Hundreds of SMU community members tuned in to listen and ask questions of the steel industry titan.
Zekelman is a long-time champion for domestic steel and manufacturing and recently launched a campaign of his own, “Demand Domestic.” He encourages pride in using domestically produced products in local projects to support American workers and their communities.
Read on for some highlights of Wednesday’s conversation.
Steel prices
Chicago-based Zekelman Industries is North America’s largest independent steel pipe and tube manufacturer and, thus, a huge consumer of hot-rolled steel substrates. This gives Zekelman a unique view of the hot-rolled sheet market.
Commenting on steel prices on the chat, Zekelman believes “steel’s going to trade in a fairly narrow band for the balance of this year and for most of next.” Prices shouldn’t get “too high or out of whack” but will still be “decently profitable for the mills,” he predicted.
He pointed out that greed can sometimes drive prices higher. If companies become arrogant about their pricing, it can invite import competition that can disrupt the market, he said.
“I want to see a trade in a healthy band range, where the mills can make money, where we can produce more domestic product, where we can take care of our customers, where we can take care of our teammates and our communities, and run our plants at an efficient rate,” he stated.
“And I think we’re going to trade in that healthy range for 2025,” he added.
Reshoring manufacturing
Zekelman expressed his continued concern about the growing trade imbalance with Mexico, primarily in the steel pipe and conduit sectors.
He was critical of US companies that have relocated manufacturing to Mexico solely to take advantage of lower costs rather than to serve the Mexican market.
Talking about the need for manufacturing to return to the US, Zekelman got fired up.
He lamented that General Motors, John Deere, and other steel consumers have moved manufacturing operations to Mexico to take advantage of cheaper labor, fewer environmental regulations, and lower taxes.
But if they’re selling the products they make into the US market, they should return to the US and employ Americans to make those products using American-made materials, he said heatedly.
The 2024 election
Zekelman noted that the US must provide a good business environment for manufacturing to return. He believes raising taxes will stifle investment; growing the tax base is needed, which means getting the companies to return here and putting more Americans to work.
Never one to shy away from politics, Zekelman wasn’t mum on who he’ll be voting for in next month’s presidential election: the candidate offering lower taxes and more business-friendly policies encouraging investment and expansion to boost domestic manufacturing.
He believes that if Republican nominee Donald Trump wins the election, his first order of business will be to bring manufacturing back here. He said that would be a great jumpstart regarding the economic engine the US desperately needs.
The chief executive drew an analogy, comparing political decisions to choosing a sports coach. Rather than focusing on party lines, he believes practical solutions to personal and national concerns are needed.
“I can tell you right now: If Trump wins, I’m more bullish. If Harris wins, I’m way more cautious,” he stated.
Bright spots in demand
Looking ahead to 2025, Zekelman commented on the demand outlook for various industries. He highlighted oil, gas, and solar as key growth areas driven by increasing energy demands.
Additionally, he mentioned steel-intensive mega-projects like data centers and AI-related technology infrastructure as bright spots for steel consumption.
An audience member prodded the executive for his thoughts on nuclear energy and small modular nuclear reactors (SMRs). Zekelman said he sees both opportunities and challenges with their adoption in the manufacturing industry.
One opportunity is the reliable, efficient, clean power SMRs can provide for large industrial power consumers.
He mentioned several challenges for SMRs, including overcoming the historical stigma around nuclear power related to waste and safety, the regulatory environment, and integrating the technology into existing facilities and processes.
Nucor’s investment in SMR technology should help demonstrate the potential benefits and will help scale it for use in other industries and other areas of the economy, he said.
“I think Nucor investing in NuScale is brilliant,” he commented. “I love what they’re doing, and I applaud it.”
On Wednesday, Nov. 13, Timna Tanners, managing director of Wolfe Research, will join us for another Community Chat. Her popular talks are lively and incredibly informative, so be sure to tune in! You can register here.
Steel Dynamics Inc.
Third quarter ended Sept. 30
2024
2023
Change
Net sales
$4,341.6
$4,587.1
-5.4%
Net earnings (loss)
$317.8
$577.2
-44.9%
Per diluted share
$2.05
$3.47
-40.9%
Nine months ended Sept. 30
Net sales
$13,668.3
$14,561.9
-6.1%
Net earnings (loss)
$1,329.8
$2,026.6
-34.4%
Per diluted share
$8.46
$11.98
-29.4%
(in millions of dollars except per share)
Steel Dynamics Inc. (SDI) reported a drop in third-quarter profits driven largely by lower flat-rolled steel prices.
The Fort Wayne, Ind.-based electric-arc furnace (EAF) steelmaker also saw scrap prices slip. That happened because of softer demand from domestic mills taking planned maintenance outages.
But the company noted that prices recovered at the end of the quarter while demand remained stable. And it said it expects better times in 2025, according to commentary released with Q3 earnings results after the close of markets on Wednesday.
All told, SDI reported net income of $317.8 million in Q3’24, down 45% from $577.2 million in Q3’23 on sales that slipped 5% to $4.34 billion over the same comparison. The company shipped 3.18 million short tons (st) of steel in Q3’24, up 1% from 3.15 million st in Q3’23.
The outlook
“Based on domestic steel demand fundamentals, we are constructive regarding the outlook for 2025 metal market dynamics,” SDI Co-founder, Chairman, and CEO Mark Millett said in a statement.
“We expect steel pricing to recover with an anticipated lower domestic interest rate environment, coupled with continuing onshoring of manufacturing businesses, and the expectation of significant fixed-asset investment,” he added.
That investment comes thanks to government programs – including US infrastructure spending, the Inflation Reduction Act (IRA), and Energy Department initiatives, Millett said.
The bullish outlook for 2025 also comes thanks to a sprawling trade petition against imports of coated flat-rolled steel.
SDI noted that it is the largest producer of non-automotive coated steel. The company also pointed out that as much as 65% of its steel revenues come from value-added products such as coated sheet.
“We believe current trade actions could … reduce volumes of unfairly traded steel imports into the United States, especially for coated flat-rolled steel, which could have a significant positive impact for us,” Millett said.
Recall, too, that SDI is ramping up four new coating lines – two each at its mills in Sinton, Texas, and Terre Haute, Ind. “We have had limited benefit from these new lines so far this year, as we have been increasing production, and expect to realize the additional earnings potential in 2025,” Millett said.
Also on the operations side, Sinton, which has struggled with outages, operated at 72% of its rated capacity (outside of planned downtime), SDI said. The mill is capable of producing 3 million st per year.
Turning to nonferrous, Millett said that SDI’s new aluminum flat-rolled mill in Columbus, Miss. – where the company already operates a steel mill – remains on track to start up in mid-2025.
The latest SMU Community Chat webinar reply is now available on our website to all members. After logging in at steelmarketupdate.com, visit the community tab and look under the “previous webinars” section of the dropdown menu.
All past Community Chat webinars are also available under that selection.
If you need help accessing the webinar replay, or if your company would like to have your voice heard in our future webinars, contact info@steelmarketupdate.com.
On Monday and Tuesday of this week, SMU polled steel buyers on an array of topics, ranging from market prices, demand, and inventories to imports and evolving market events.
Rather than summarizing the comments we collected, we are sharing some of them in each buyer’s own words.
Want to share your thoughts? Contact david@steelmarketupdate.com to be included in our market questionnaires.
Steel prices remain largely steady. How do you expect prices to trend over the next three months?
“Will be steady until 2025 due to demand, and supply levels will keep pricing from spiking.”
“Should stay flat throughout the balance of the year. Fourth quarter is historically slow, and the election won’t be settled until November.”
“Steady/soft. Demand is not sufficient to impact.”
“We’ve been pretty outspoken about this rally having run out of steam. We think hot rolled will be back in the mid-to-high $600s this month.”
“Mostly flat until mid Q1.”
“Flat.”
“Steady.”
“Steady to slightly up.”
“Flat to slightly up. Probably nothing happening until January.”
“I think buyers try and press down in the next month, but prices in the two months following will increase on the strength of raw material prices, lower inventories, pent-up demand, and lack of imports.”
“Expecting them to gradually increase.”
“Plate will be up.”
“Down, slowing economy and still too much capacity.”
“We haven’t talked to a single service center or mill who is touting an improvement in demand.”
“Stable to declining, buyers are dumb and just driving down inventories because they expect prices to plummet.”
“Declining, slowing economy.”
“Slight decline.”
“Improving.”
Is inventory moving faster or slower than this time last year?
“Slower, slowing economy.”
“Slower than last year.”
“Slower because election season.”
“Slower, with so much uncertainty and the election.”
“Slightly slower.”
“About the same.”
“Steady.”
“Inventory is moving faster for us, but only because we are purposefully keeping little-to-no stock.”
“Appears faster because we are carrying less.”
“Faster as demand has improved from last year.”
Are imports more attractive than domestic material?
“For the most part, no, the price gap is not sufficient in a soft price environment.”
“They are not attractive as prices are increasing and lead times are long.”
“Import pricing is just fine, but the lead times are a problem, especially with 2025 right around the corner now.”
“Not yet, and prices in Europe appear to be turning the corner – so even less attractive.”
“No.”
“Pricing is relatively the same as domestic, but domestic is only six weeks vs. 14 weeks from offshore.”
“Import prices are always more attractive.”
“Yes, but more narrow spread.”
What’s something that’s going on in the market that nobody is talking about?
“Inventories are plummeting and imports are not on order.”
“I think there are whispers out there, but I am very concerned with general supply>demand once all of the fall outages unwind. Scary stuff really.”
“Chinese stimulus isn’t lifting their domestic demand and exports from China are down. This will keep global demand muted.”
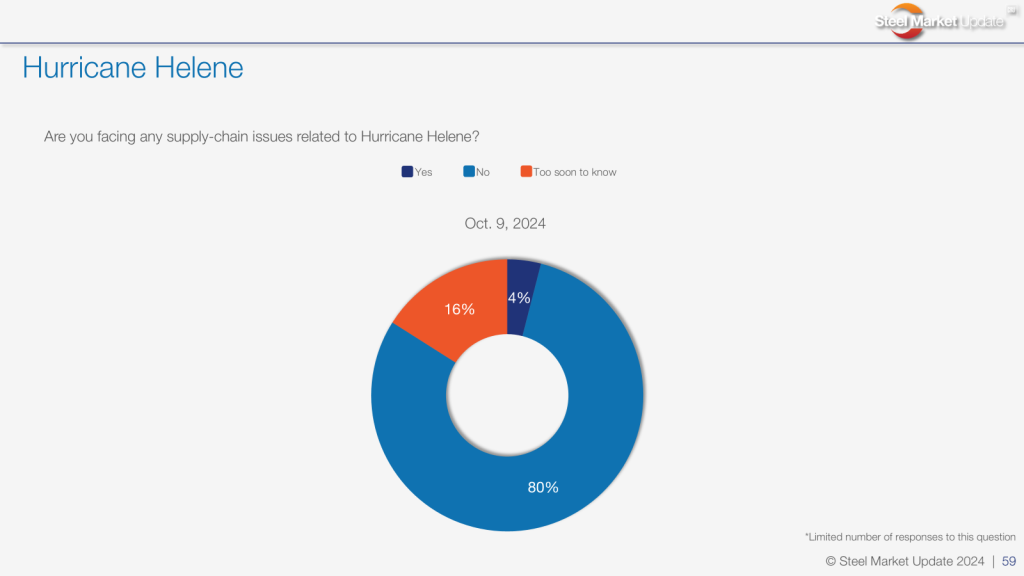
“Hurricane steel replacement estimates.”
“Evraz North American potential sale of operations.”
“Scrap going up.”
Last week, US mills entered the scrap market, albeit later in the month than usual. Now we know why. They were trying to buy sideways (whatever that means anymore). However, due to the slowing generation of industrial scrap and the limited flows of obsolescent material, namely shredder feed, the market traded up in most districts by a solid $20 per gross ton (gt) across the board. The exceptions were mills in the Detroit, Northern Indiana, and Chicago districts. Mills in these districts have hung together to thwart any increases in price over the last several months. In the Detroit area, some mills have tried to buy down in recent months, even though it was obviously the wrong price. However, this month it looks as though they all covered their needs without boosting price tags. Can they do it again next month? Most believe the jury is still out on this.
The ferrous scrap market in the US and Canada usually starts to rise in price during the last two months of the year, or at least stabilizes for a stronger January. There are several reasons for this:
Dealers try to build inventory for the winter months and do not want to sell much at lower prices.
Winter weather slows inbound flows of obsolescent grades into dealer yards.
Mills try to buy less for year-end accounting reasons in November and December.
Industrial generation slacks off due to plant closures during the holidays.
This should happen this year as well, even though scrap demand, especially in the flat-roll sector, isn’t very pronounced. This is because the October market was the first increase in pricing since January. This market was prone to have an off-the-bottom bounce at some point. If you couple this with the points above, it makes sense a firmer scrap market lies ahead even in the face of stifled demand. Usually, most mills will look to make a full buy after the new year.
Another bullish factor is the strength of the export market off the North American eastern seaboard. Prices have risen for cargoes into Turkey. The billet run from China has slowed and the stimulus there may stop it altogether soon. Rebar prices are up and so is the demand for scrap. Will it last? Not sure how much prices could rise, but Turkey will need to continue buying scrap and a significant portion of that will come from North America.
It is hard to assess what effect the damage of the recent hurricanes will have on the scrap markets. Truly, there has been a great deal of unprepared and unsorted scrap created by these storms. In the Southeastern states of Georgia, South Carolina, North Carolina, and Tennessee, the problem will be logistical. Many of the roads and bridges washed away, so it will be difficult to deliver this material to processing facilities. In Florida, this may not be as much of a problem after the flood waters recede. So, shredded may be abundant there in a shorter period of time.
Editor’s note: This column appeared first in Recycled Metals Update (RMU), SMU’s new sister publication. RMU is devoted entirely to the ferrous and nonferrous recycled metals markets. If you’d like to learn more, visit RMU’s homepage and register for a free 30-day trial.
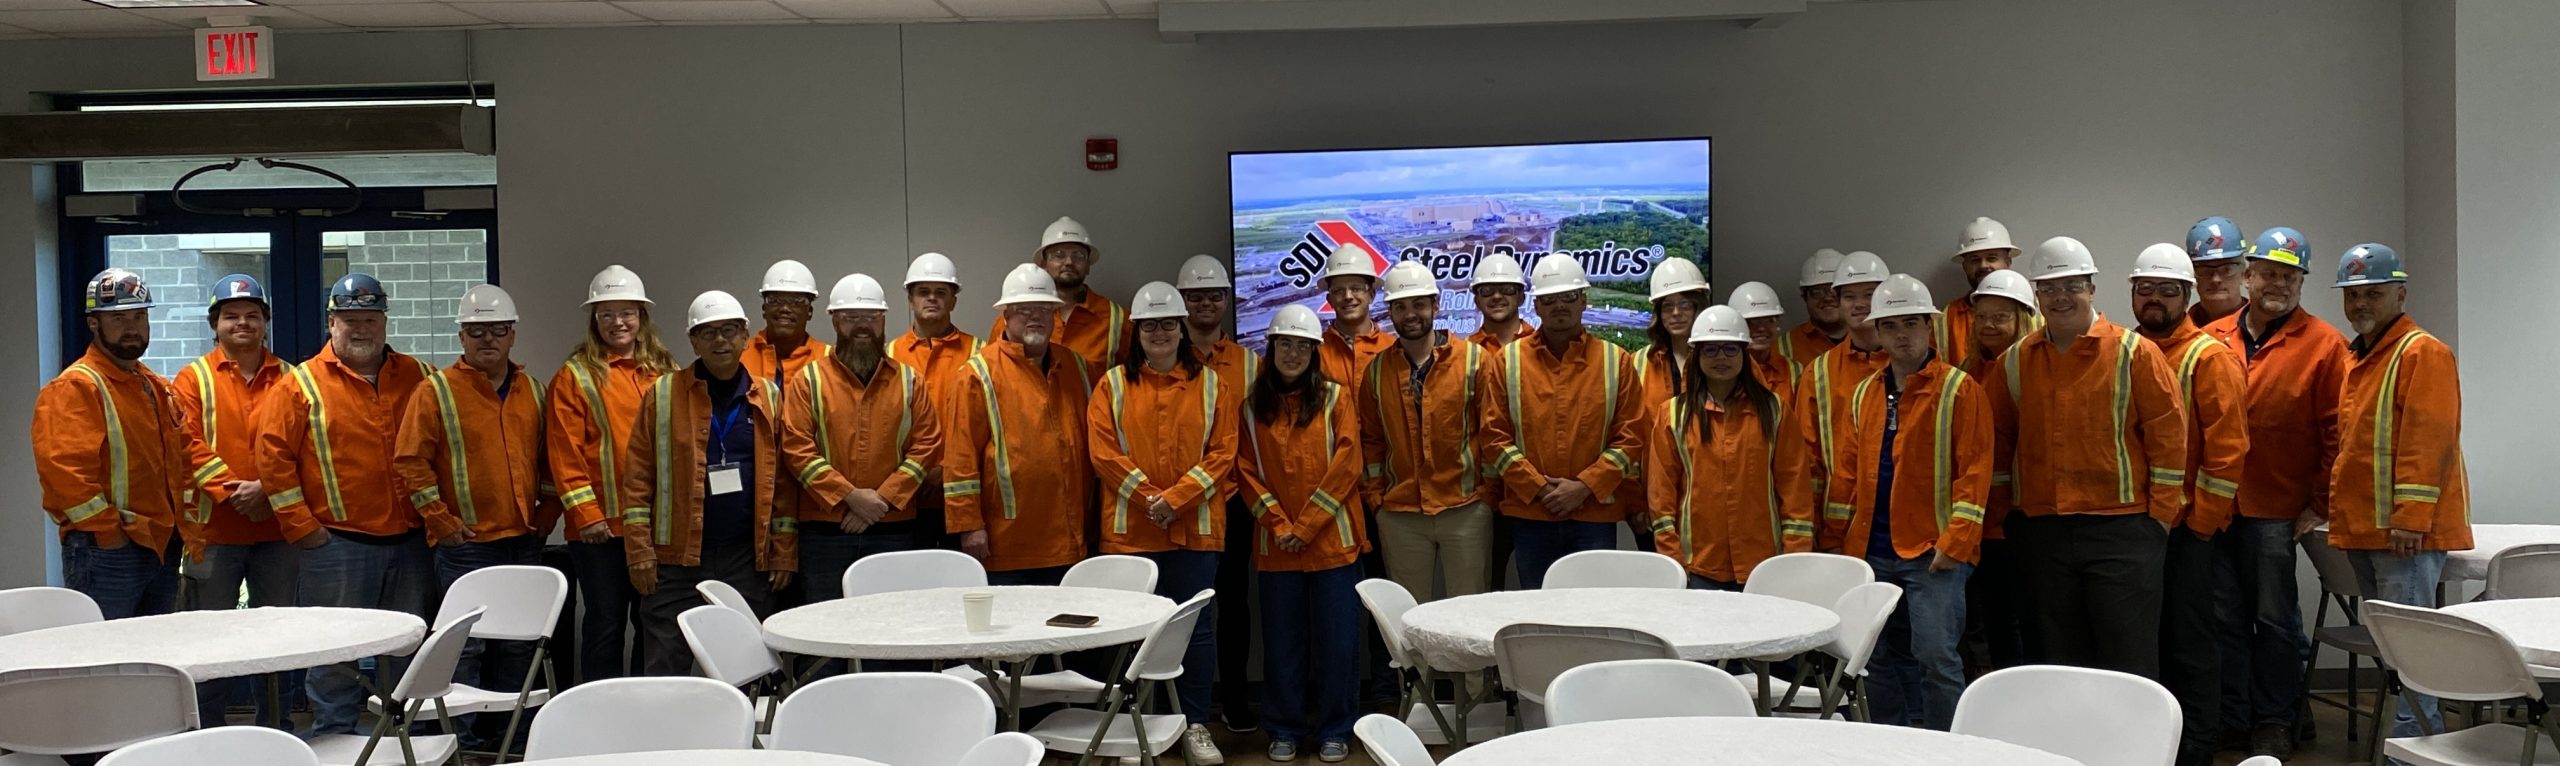
We just wrapped up another Steel 101 workshop, easily the most hands-on industry workshop on steelmaking and market fundamentals, in this humble opinion. Last week on Tuesday and Wednesday, SMU’s Steel 101 was held in Starkville, Miss.
For those in the know, it’s the home of Mississippi State University – Hail State! They sure did put up a good fight last weekend, but Georgia was still reeling from a stunning loss to Bama the week before and took care of business… but enough of that. Starkville, Miss., maybe more importantly – for those of us in steel – is just about 20 minutes west of Steel Dynamics Inc. (SDI) Columbus (more on that later).
We had roughly 40 attendees converge on the Courtyard Starkville MSU at The Mill. Hailing from all over North America, the diverse group represented the breadth of the steel industry. Some industry veterans were getting a refresher on different aspects of the market, while newbies in areas like sales and marketing wanted to familiarize themselves with all things steel.
Like our conferences, our workshops engage the supply chain from top to bottom. In Mississippi, the course was no different. It included producers, service centers, OEMs. Even the US International Trade Commission was present and eager to learn.
In the classroom
As much as I’d like to say that it’s a great course with an overview of the steel industry and steelmaking, it’s really a two-day intensive and immersive workshop.
Those attending got a front-row seat to the entire life-cycle of steel: from raw materials like scrap and ore all the way to downstream applications like automotive — and everything in between. And it’s not hard to do when you have an amazing group of instructors, who together have nearly a century of experience in the steel industry – from sales to electrical and metallurgical engineering.
A special shout-out and huge thanks to our outstanding instructors: Roger Walburn, Chuck McDaniels, Mario Briccetti, and Chris Shipp. Acquainted with just about every facet of the industry, they possess a wealth of knowledge, and a passion for sharing it.
Thank you for helping craft an immensely valuable and highly educational course.
From the basic differences between an electric-arc furnace (EAF) and a blast furnace (BF), different grades of steel, or the intricacies of steel pricing, the instructors covered it all. And, of course, there was always enough time to walk through questions and ensure the course was a dialog.
Beyond the course, there were ample networking opportunities, including happy hour and meals where attendees could mingle and get to know each other. Perhaps share a business card or LinkedIn invite. And maybe even have a little fun in the process — I heard the Starkville nightlife is rather impressive.
At the mill
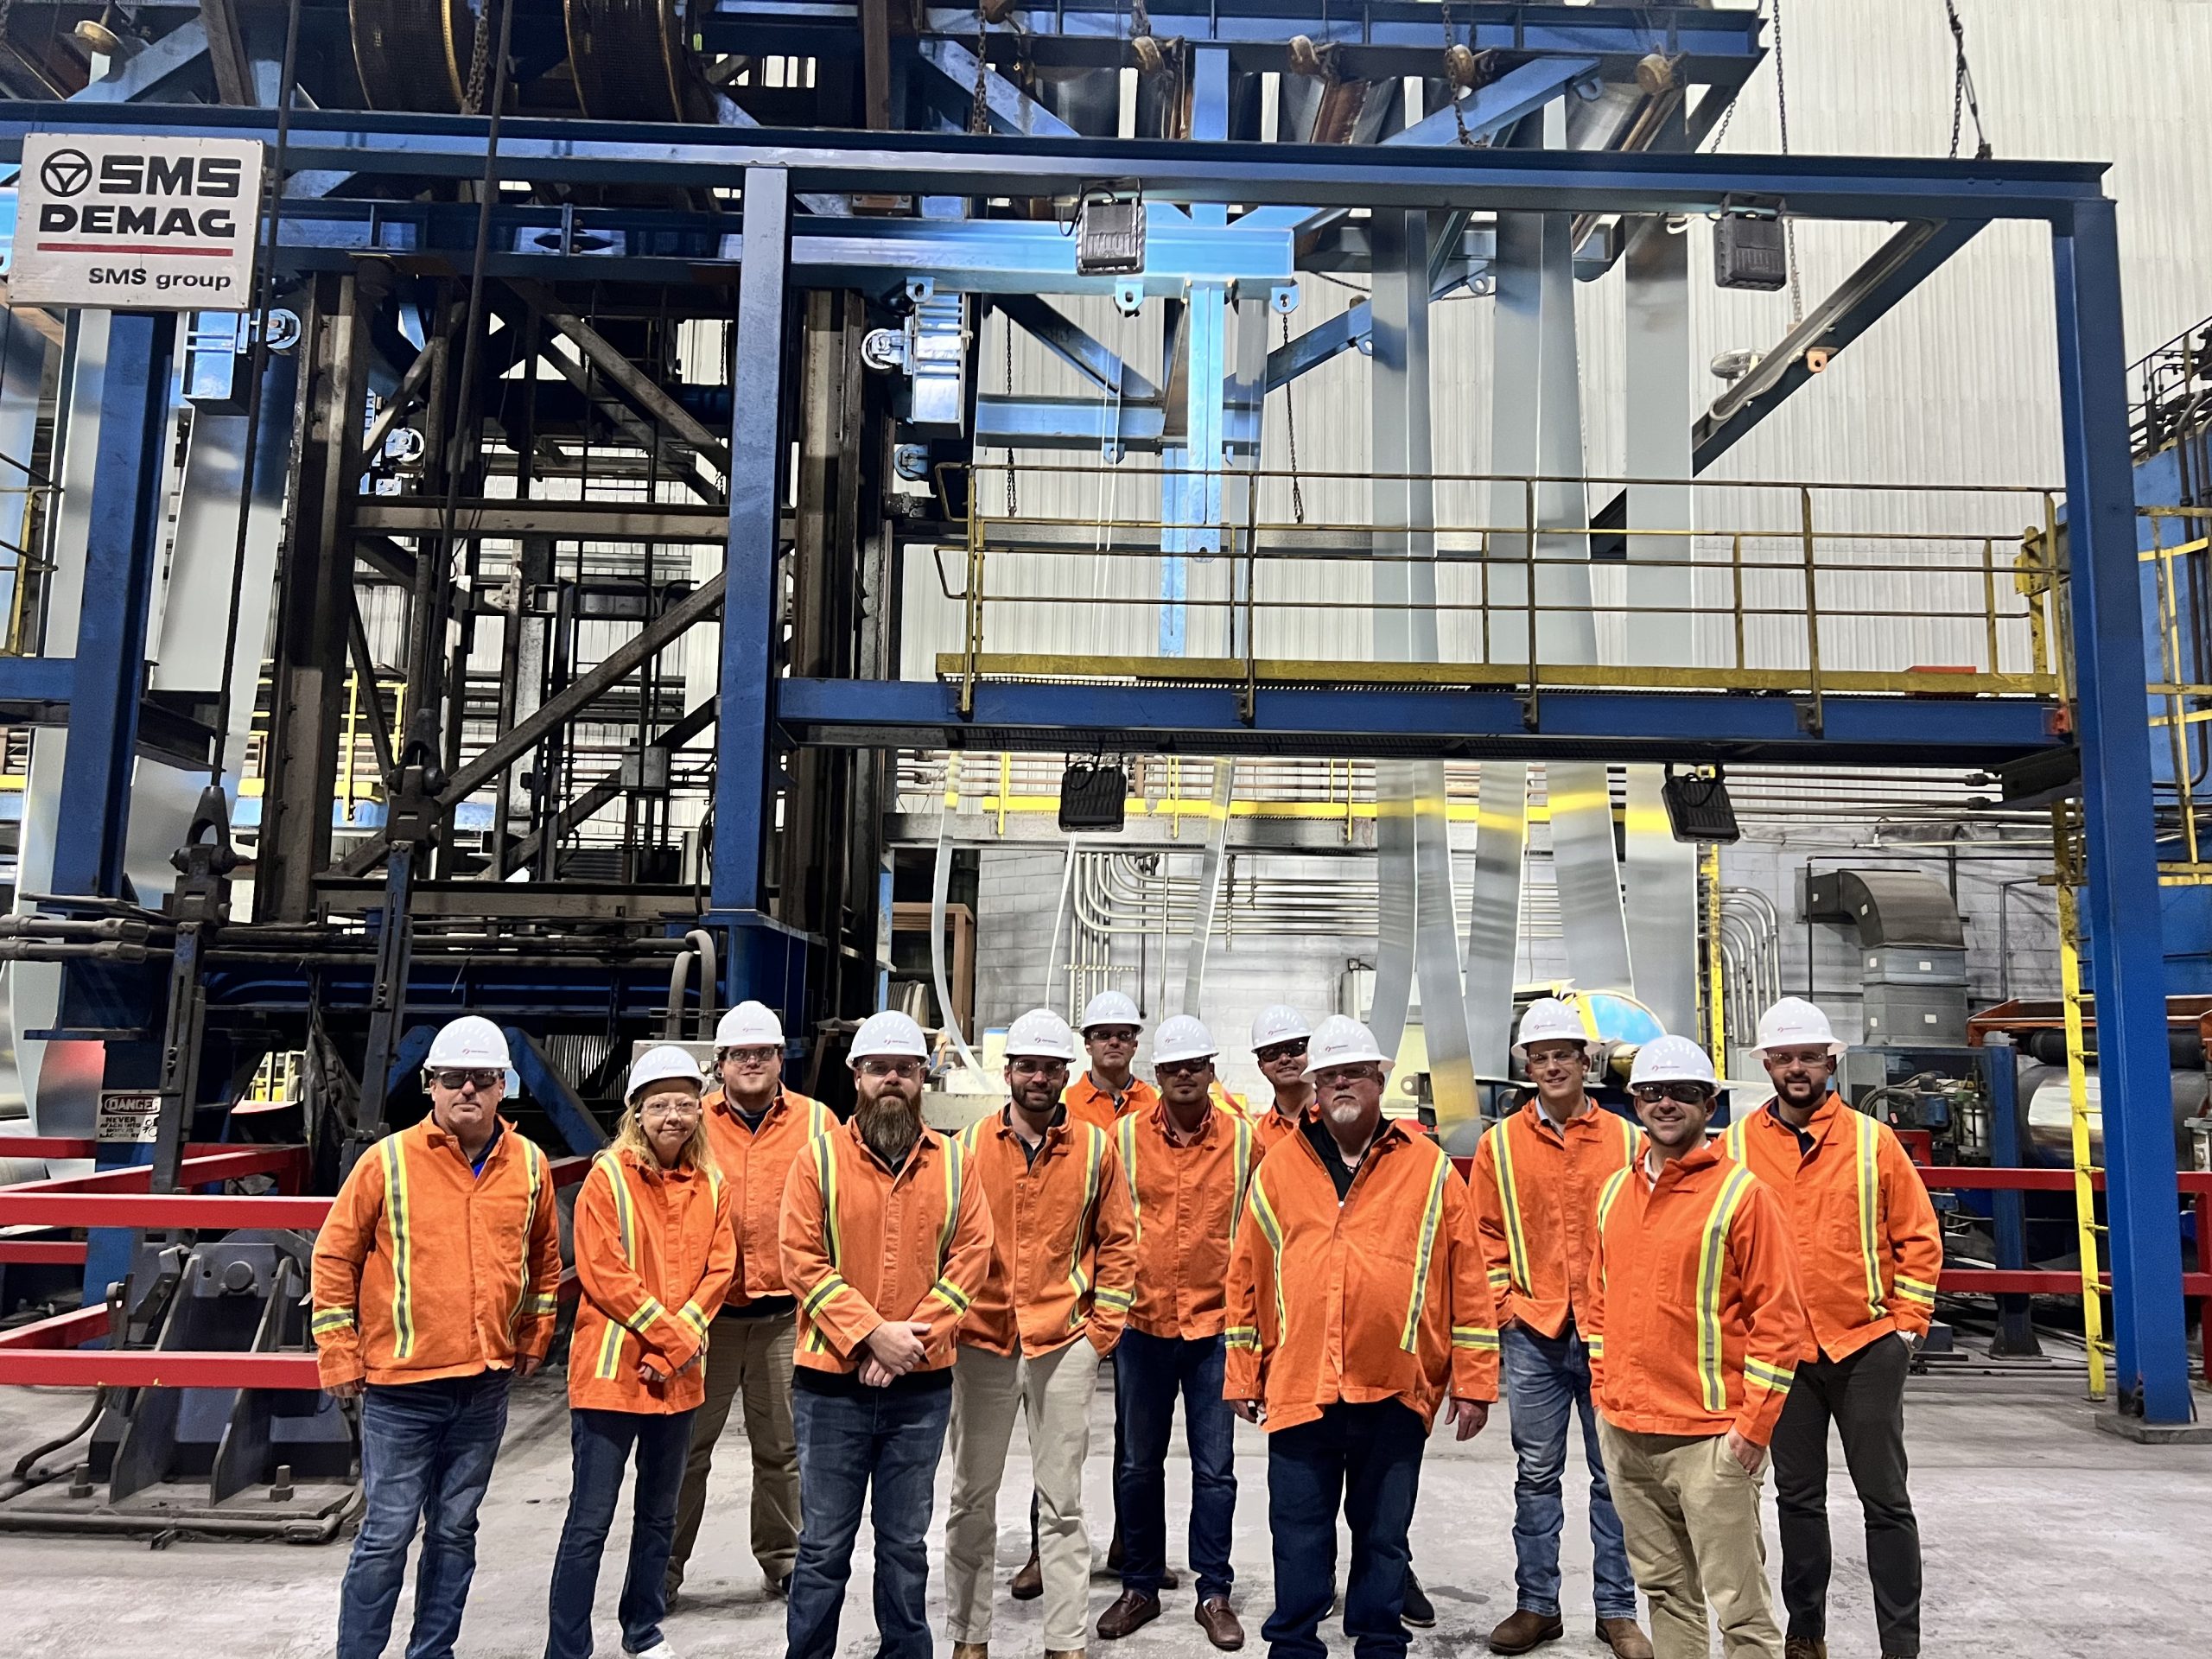
A major highlight and incredibly practical part of the course was our guided tour of SDI’s Steel Flat Roll Steel Group, Columbus Division in Columbus, Miss. They produce flat-rolled products. A quick 20-minute bus ride, and we were there. After donning our PPE, listening to a safety talk, and eating a boxed lunch, we were ready to go.
SDI metallurgists split us up into groups of 10 and took us on a two-hour guided tour. Workers explained to us the nature of their jobs as they took us upstairs, across hot rolling lines, and into pulpits. All the theoretical knowledge we learned in class turned real.
We walked the hot strip mill – from molten steel through a continuous caster, descaling, and finally to a hot-rolled coil. We walked the cold mill too! From uncoiling a cold-rolled coil to a continuous anneal, and finally through a coating pot.
It’s one thing to see a PowerPoint slide but another to be in the pulpit and to stare out the window as an EAF gets charged. Nothing quite prepares you for the sight of tons of molten metal. A pickling line might not sound impressive until you see one at work in front of you.
A huge thank you to all the SDI staff who made this awesome experience possible!
Don’t take my word for it
I won’t bore you with review after review from Starkville, but here are just a few from those who attended:
“The SMU Steel 101 Workshop was wonderful. The industry is always changing, and SMU does a great way of refreshing and incorporating new and exciting things in the industry.”
“This is the type of class I wish I had when I first started! Each section of the course was so in-depth and gave me a wealth of knowledge that will be used daily as a customer service rep. Highly recommend participating in this course if you want to have a better understanding of steel and everything that goes into production.”
“Great training for the experienced and the new additions within the steel industry. If it would be possible, I would like to attend at least once a year. Great job all!”
We typically hold a live Steel 101 two to three times a year. Our next one is set for Spring 2025 in Charleston, S.C.
We will once again converge on Hyatt Place Mount Pleasant Towne Centre, with the date set for March 11-12, 2025. The workshop includes a guided mill tour of Nucor Steel Berkeley. You can get more details here. You can register here.
Space is limited, so don’t delay! I promise you, it is “worth its weight in steel.”
And, as always, from all of us at SMU, we thank you for your continued support.
Sheet prices mostly edged lower for a second week, reverting to levels seen in the first half of September, while plate prices slipped for the third consecutive week.
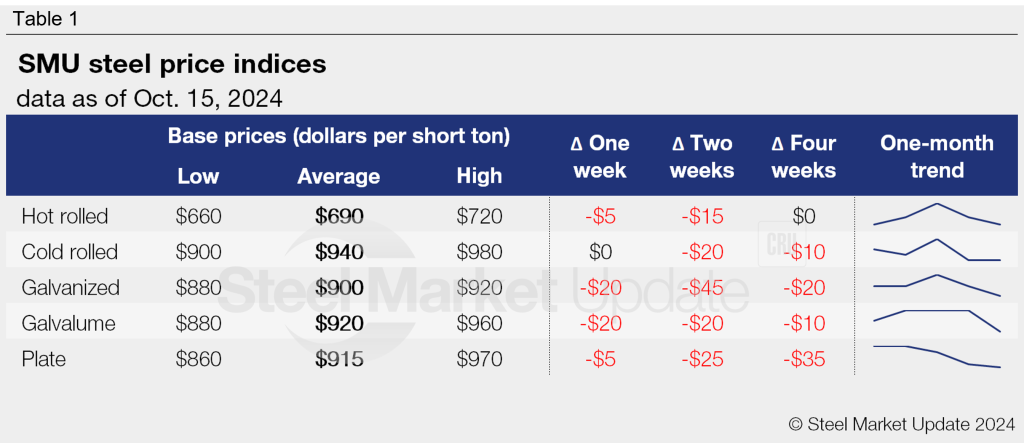
SMU price indices for hot-rolled, galvanized, Galvalume, and plate steels declined $5-20 per short ton (st) from last week. Our cold rolled index was unchanged week over week (w/w). Prices are down $15-45/st from the start of the month.
Some buyers expect prices to continue to drift lower as fall maintenance outages linger and mills entertain year-end deals. As we reported last week, mill lead times remain historically low, and most buyers report that mill prices are negotiable for new orders. Also supporting lower prices are seasonally high service center inventories, as we reported to Premium members earlier today.
SMU’s hot-rolled steel index decreased $5/st from last week to $690/st, while cold rolled held steady at $940/st. Our galvanized and Galvalume indices both slipped $20/st to $900/st and $920/st, respectively. Average plate prices eased $5/st to $915/st, a level not seen since the first week of 2021.
This week’s SMU price range is $660-720/st, averaging $690/st FOB mill, east of the Rockies. The lower end of our range is unchanged w/w, while the top end is down $10/st. Our overall average is down $5/st. Our price momentum indicator for hot-rolled sheet remains at neutral, meaning we see no clear direction for prices over the next 30 days.
Hot rolled lead times range from 3-7 weeks, averaging 5.0 weeks as of our Oct. 9 market survey.
Cold-rolled coil
SMU’s price range is unchanged from last week at $900–980/st, with an average of $940/st FOB mill, east of the Rockies. Our price momentum indicator for cold-rolled steel remains at neutral, meaning we see no clear direction for prices over the next 30 days.
Cold rolled lead times range from 4-9 weeks, averaging 6.9 weeks through our latest survey.
Galvanized coil
The SMU price range is $880–920/st, averaging $900/st FOB mill, east of the Rockies. The lower end of our range is unchanged w/w, while the top end is down $40/st. Our overall average is down $20/st. Our price momentum indicator for galvanized steel remains at neutral, meaning we see no clear direction for prices over the next 30 days.
Galvanized .060” G90 benchmark: SMU price range is $977–1,017/st, averaging $997/st FOB mill, east of the Rockies.
Galvanized lead times range from 5-10 weeks, averaging 7.1 weeks through our latest survey.
Galvalume coil
The SMU price range is $880–960/st, with an average of $920/st FOB mill, east of the Rockies. The lower end of our range is down $20/st w/w, as is the top end of our range. Our overall average is down $20/st w/w. Our price momentum indicator for Galvalume steel remains at neutral, meaning we see no clear direction for prices over the next 30 days.
Galvalume .0142” AZ50, grade 80 benchmark: SMU price range is $1,174–1,254/st, averaging $1,214/st FOB mill, east of the Rockies.
Galvalume lead times range from 6-9 weeks, averaging 7.5 weeks through our latest survey.
Plate
This week’s SMU price range is $860–970/st, averaging $915/st FOB mill. The lower end of our range is unchanged w/w, while the top end is down $10/st. Our overall average is down $5/st. Our price momentum indicator for plate remains at lower, meaning we expect prices to decline over the next 30 days.
Plate lead times range from 2-6 weeks, averaging 4.2 weeks through our latest survey.
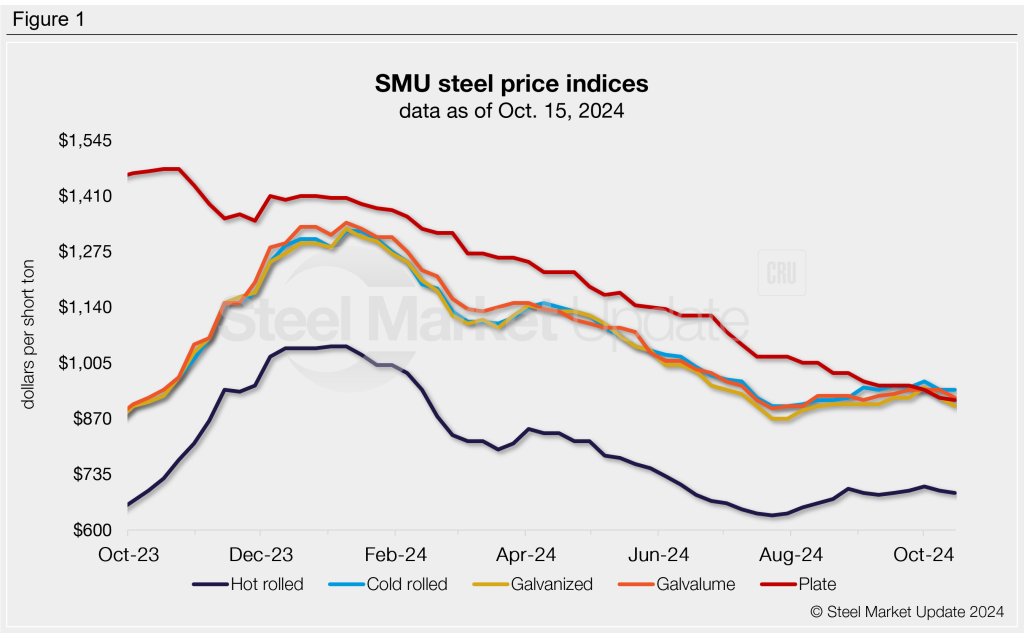
SMU note: Above is a graphic showing our hot rolled, cold rolled, galvanized, Galvalume, and plate price history. This data is also available here on our website with our interactive pricing tool. If you need help navigating the website or need to know your login information, contact us at info@steelmarketupdate.com.
Luxembourg-headquartered ArcelorMittal has entered into a 10-year commercial agreement with the Velux Group to supply the roof window maker with more sustainably produced steel.
Denmark-based Velux will gradually increase its order intake of XCarb, an ArcelorMittal product with a minimum of 75% recycled steel that uses 100% renewable electricity during production.
“The long-term agreement between our companies sends a powerful message about the importance of steel in the decarbonization of the everyday materials that we all use,” Laurent Plasman, chief marketing officer of industry, ArcelorMittal Europe – flat products, said in a statement on Tuesday.
The two companies agreed in 2023 to enter a partnership to lower the carbon footprint of the steel used in Velux roof windows by up to 70% vs. conventionally produced steel.
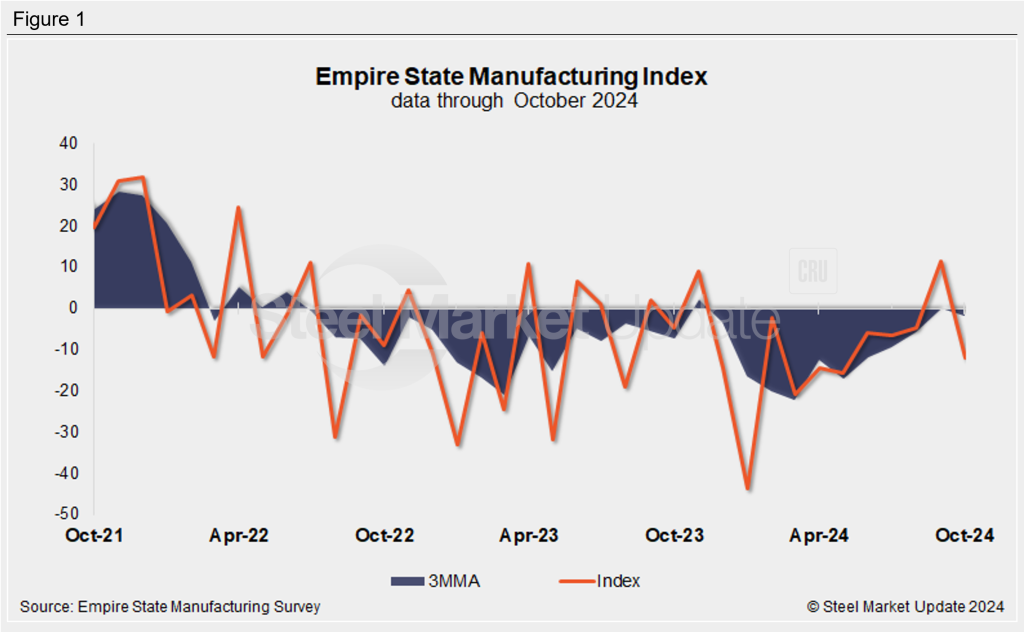
The survey from the Federal Reserve Bank of New York revealed a modest contraction in manufacturing business activity in October, with the headline general business conditions index falling back 23 points to -11.9.
Note that the bank collected survey responses from manufacturing executives between Oct. 2 and Oct. 9.
The index’s fall back into contraction territory comes after a positive reading of 11.5 in September. Before that, the index’s last positive reading was in November 2023.
“Manufacturing activity contracted modestly in New York State in October, with firms reporting that new orders declined. Despite this contraction, employment expanded for the first time in a year, though by a small degree, and optimism about the outlook grew strongly,” commented Richard Deitz, the New York Fed’s economic research advisor.
While new manufacturing orders had improved in September for the first time in months, the new orders index fell 20 points to -10.2 in October.
The shipment index also dropped back into contraction territory, with October’s reading of -2.7, down 20 points from the month prior.
Inventories also dropped, with the index declining eight points to -7.5.
Though the survey showed a decline in business activity, the Fed reported growing optimism for the near-term outlook. The future business index rose eight points to a multi-year high of 38.7. The report said over half (55%) of respondents expect an improvement in conditions over the next six months.
On a three-month moving average basis (3MMA), the index fell back from a 10-month high of 0.1 in September to -1.7 in October.
An interactive history of the Empire State Manufacturing Index is available here on our website.
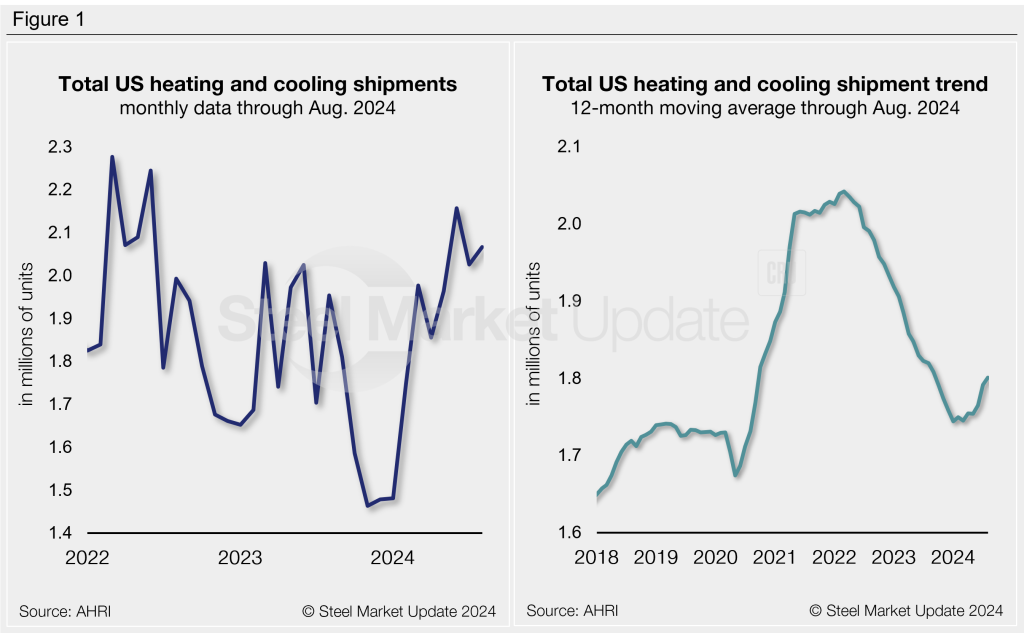
Heating and cooling equipment shipments remained near multi-year highs in August, according to the latest data released from the Air-Conditioning, Heating, and Refrigeration Institute (AHRI).
Total August shipments increased 2% month on month (m/m) to 2.07 million units (Figure 1, left). Shipments are 6% greater than the same month last year. August now represents the second-highest monthly shipment rate recorded in the last two years, just below the 2.16 million units rate recorded in June.
On an annualized 12-month moving average (12MMA) basis, shipments have trended higher since June (Figure 1, right). This follows a significant decline from mid-2022 through the start of this year, following the post-Covid surge. The 12MMA through August is up to an 11-month high of 1.80 million units, 1% less than the same period one year prior.
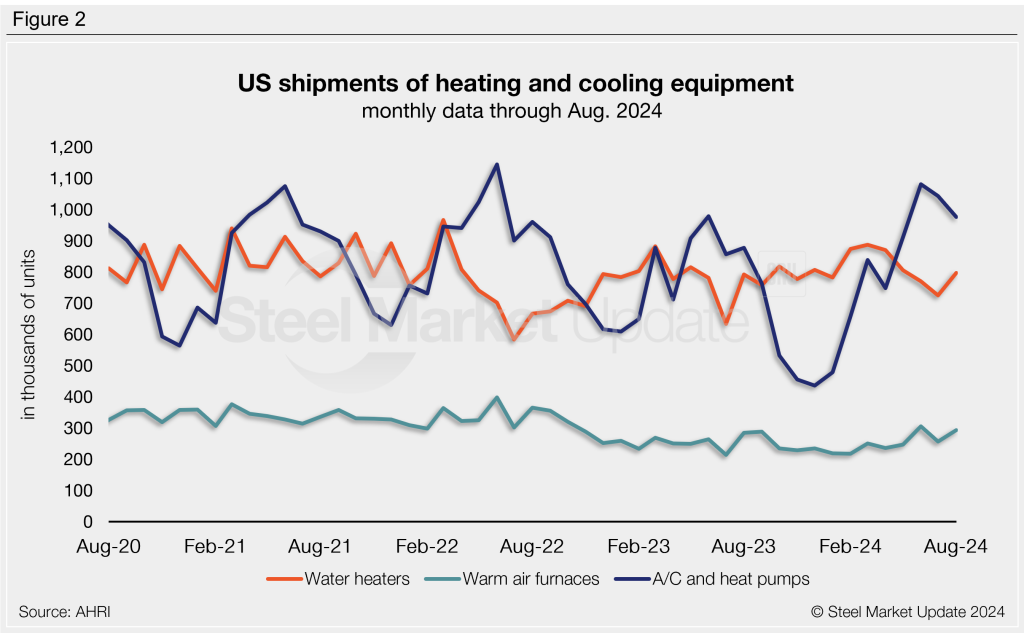
August shipments of residential and commercial storage water heaters jumped 10% m/m from July’s one-year low, now up to 797,000 units. (Recall that in March we saw a two-year high of 887,000 units). August shipments are 1% higher than levels seen one year ago. Total monthly water heater shipments have averaged 806,000 units over the past year.
Warm air furnace shipments have bounced around since reaching a 20-month high in June. Following a 16% drop in July, shipments recovered 14% m/m in August to a combined 293,000 units. This is 3% higher than levels seen one year prior. Furnace shipments have averaged 251,000 units per month across the prior 12 months.
Shipments of central air conditioners and air-source heat pumps fell 6% m/m in August to a total of 976,000 units. This follows a two-year high of 1.08 million units recorded in June. Note that air conditioner/heat pump shipments are very seasonal, with slowdowns experienced throughout the winter months as evident in Figure 2. Total air conditioner and heat pump shipments are 11% greater than the same month one year prior. Shipments have averaged 744,000 units per month across the last year.
The full press release of this data is available here on the AHRI website.
An interactive history of heating and cooling equipment shipment data is available here on our website. If you need assistance logging in to or navigating the website, please contact us at info@steelmarketupdate.com.
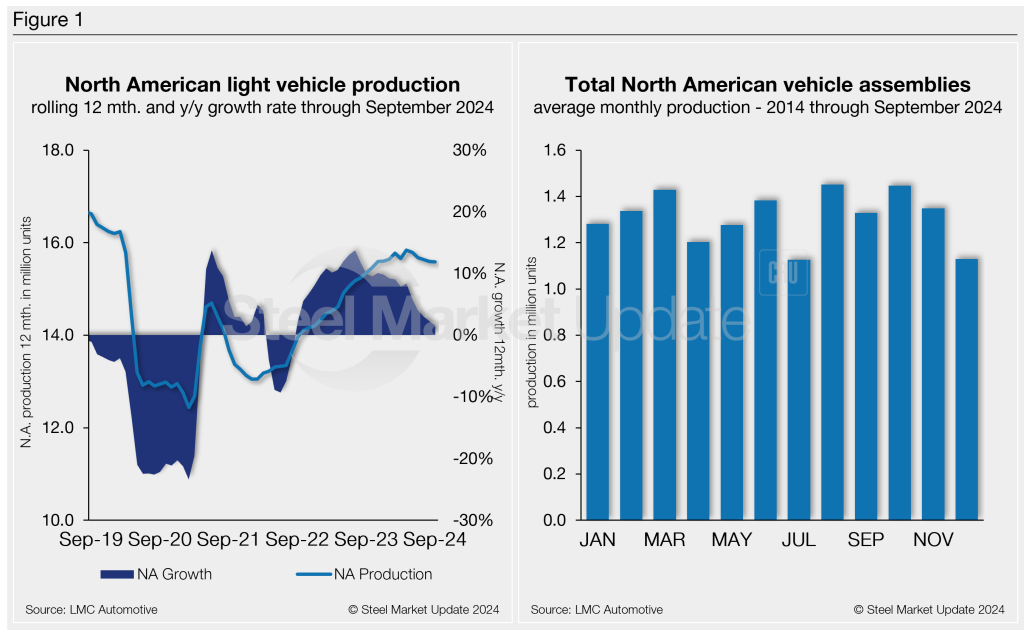
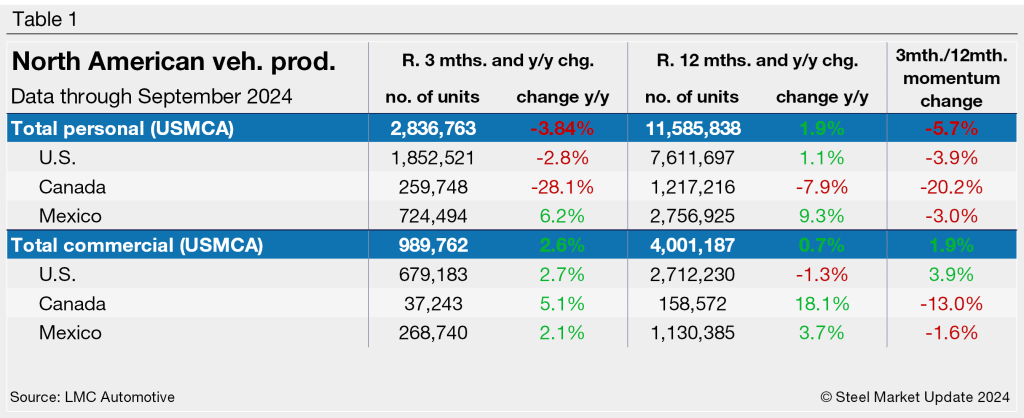
North American auto assemblies fell by nearly 7% from August, but were still ahead of July’s 20-month low. Assemblies were also down just under 1% year on year (y/y), according to LMC Automotive data.
Auto production has fluctuated some after the typical summer slowdown from scheduled outages for maintenance programs, facility updates, and model-year changeovers. After recovering in August, September’s step back in assemblies comes as carmakers continue to downgrade and adjust vehicle output to meet curtailed market demand. The trend highlights the slew of recent WARN notices and layoffs.
North American vehicle production, including personal and commercial vehicles, totaled 1.328 million units in September, a 6.7% decrease from 1.423 million units in August. It’s roughly 0.6% behind the 1.336 million units produced one year ago.
Below in Figure 1 is a five-year snapshot of North American light-vehicle production since 2019 on a rolling 12-month basis with a y/y growth rate. Also included is a five-year snapshot of the average monthly production, which includes seasonality since 2019.
A short-term snapshot of assembly by nation and vehicle type is shown in the table below. It breaks down total North American personal and commercial vehicle production into US, Canadian, and Mexican components. It also includes the three- and 12-month growth rates for each and their momentum change.
For the three months and 12 months through September, the growth rate for total personal and commercial vehicle assemblies in the USMCA region is largely negative. The momentum saw a shift due to a boost in commercial assembly vehicle segments.
Personal vehicle production
The longer-term picture of personal vehicle production across North America is shown below. The charts in Figure 2 show the total personal vehicle production for North America and the total for the US, Canada, and Mexico.
In terms of personal vehicle production, this segment saw a 7.3% m/m decline in September. Assemblies last month totaled 970,905 units, down 76,565 units vs. August. The result was not as pronounced as the same period one year ago, with just a 3.5% loss.
The US saw a 7.2% m/m production loss, with 50,174 fewer units produced in September. Mexico produced 24,428 fewer units (-9.3%), while Canada’s production was down by just 1,963, units (-2.1%).
Production share across North America was little changed. The US saw personal vehicle production share of the North American market at 65.3%, followed by Mexico and Canada at 25.5% and 9.2%, respectively.
Commercial vehicle production
Total commercial vehicle production for North America and the total for each nation within the region are shown in the first chart in Figure 3 on a rolling three-month basis. Commercial vehicle production in the US and Mexico and their y/y growth rates, as well as the production share for each nation in North America, are also shown.
North American commercial vehicle production was much better in September either. The region saw a 4.9% m/m decline with a total of 357,216 units, down 18,352 from August. Despite the lower m/m total, September’s output was 8.2% above last year.
The US saw an 11% m/m drop, with 29,766 fewer commercial vehicles assembled in September. Mexico followed, down 13.8%% (-12,387 units), and then Canada, down 6.7% (-973 units).
Despite the decline, September marked Canada’s 35th consecutive month of assembling commercial vehicles, after ceasing production for nearly two years from January 2020 through October 2021.
The market share across the region was also largely unchanged. The US total share was 68.6%, followed by Mexico with a 27.6% share, and Canada with a 3.8% share in September.
Presently, Mexico exports just under 80% of its light-vehicle production, with the US and Canada as the highest-volume destinations.
Editor’s note: This report is based on data from LMC Automotive for automotive assemblies in the US, Canada, and Mexico. The breakdown of assemblies is “Personal” (cars for personal use) and “Commercial” (light vehicles with less than 6.0 metric tons gross vehicle weight rating; heavy trucks and buses are not included).
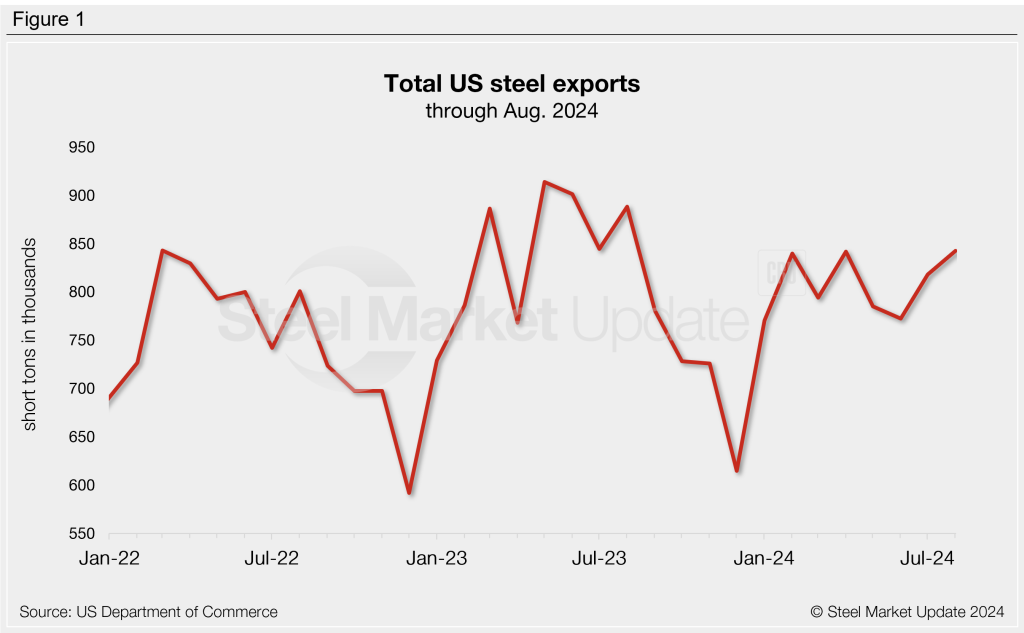
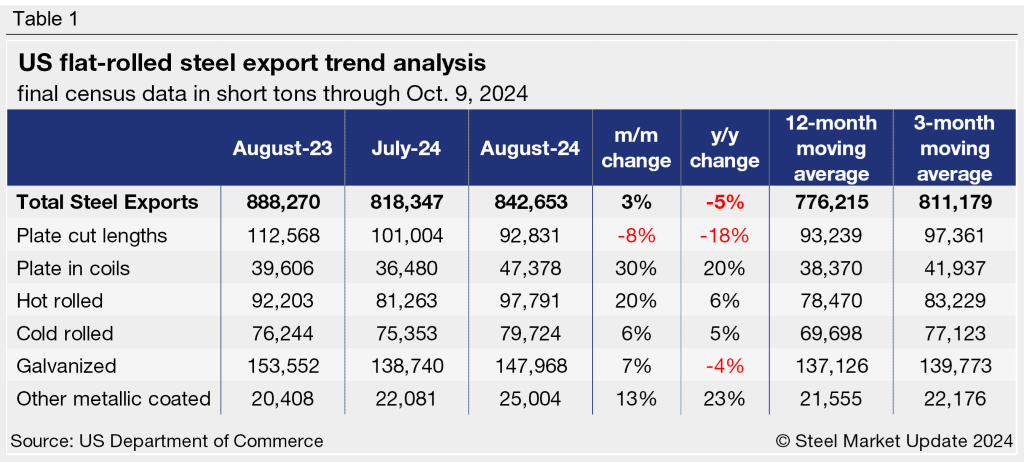
US steel exports were at a one-year high in August, according to recently released data from the US Department of Commerce. The amount of steel exiting the country rose 3% month on month (m/m) to 843,000 short tons (st), the highest monthly rate recorded since August 2023.
August exports were 4% greater than the year-to-date monthly average of 808,000 st but 5% below the YTD average of 888,000 st in August 2023.
Monthly averages
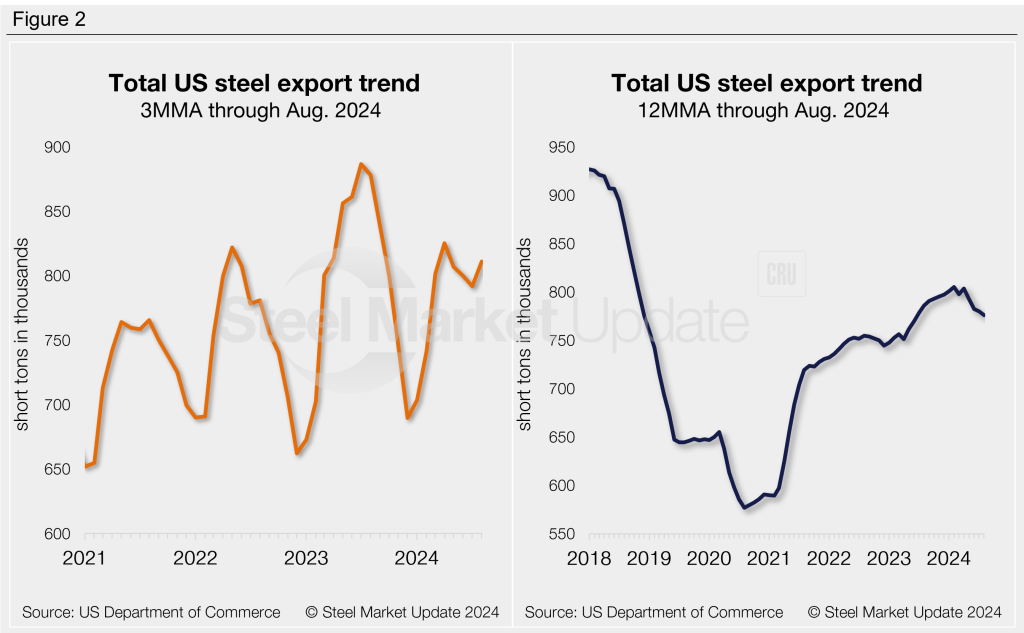
Looking at exports on a three-month moving average (3MMA) basis can smooth out month-to-month fluctuations. After peaking in August of last year, export volumes trended downward for the remainder of 2023 but changed course entering 2024. The 3MMA peaked at 825,000 st in April, then declined through July. It ticked back up in August and, although 2% below April’s high, remained relatively strong at 811,000 st.
Exports can be annualized on a 12-month moving average (12MMA) basis to further dampen month-to-month variations and highlight historical trends. From this perspective, steel exports have overall trended upward since 2020. The 12MMA reached a five-and-a-half-year high of 805,000 st in February. It has since eased but remained healthy at 776,000 st in August. That is the lowest 12MMA rate recorded in the past 14 months.
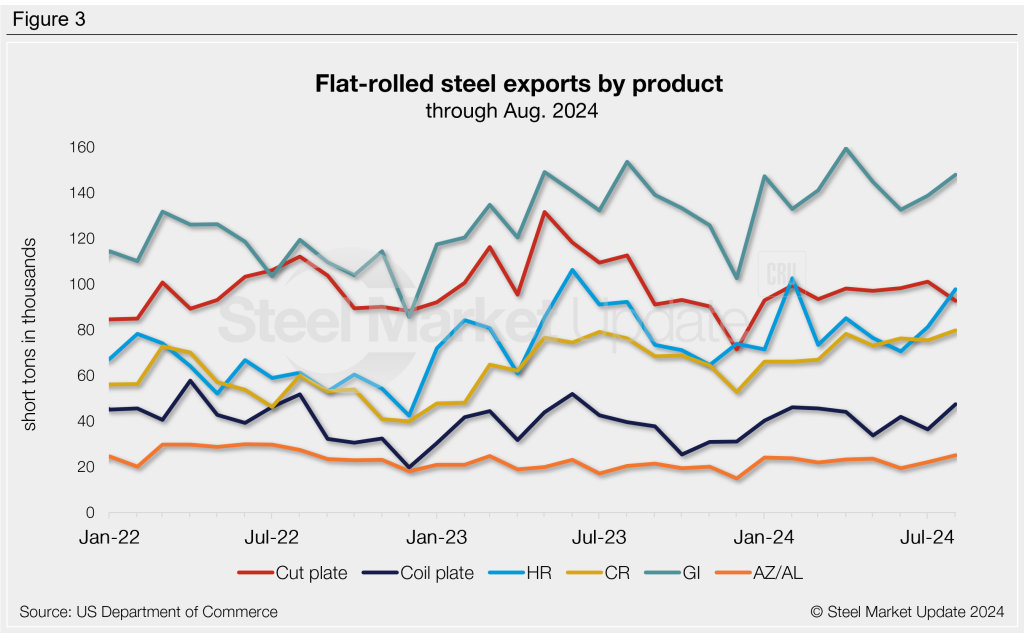
Exports by product
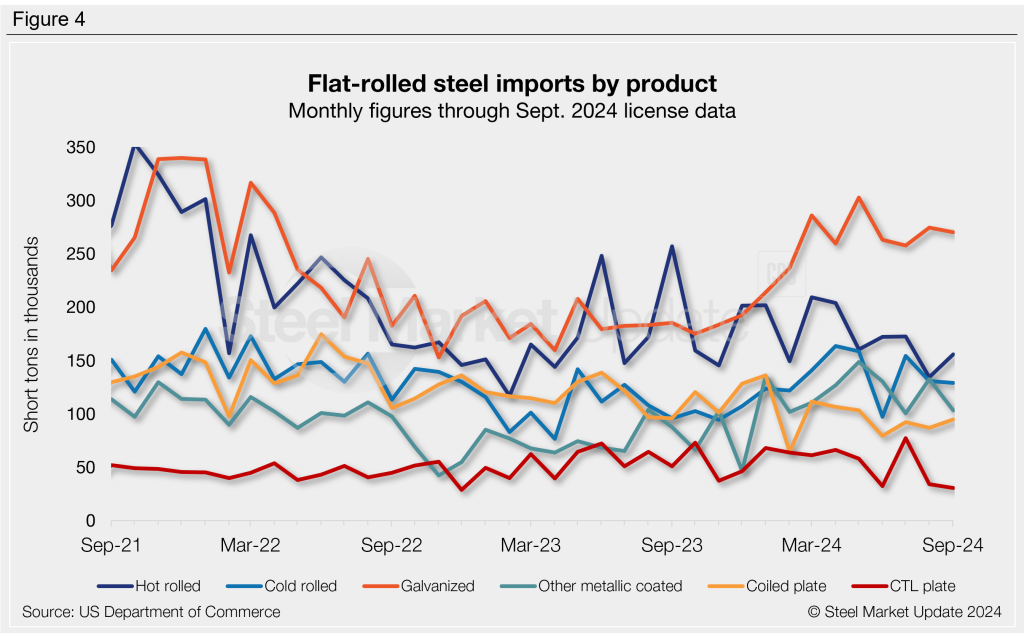
Of the major flat-rolled steel products we track, exports of all but cut-to-length plate increased from July to August. The biggest monthly movers were plate in coils (+30%), hot-rolled sheet (+20%), and other-metallic coated sheet (+13%). Three worth mentioning from August figures are: Cold-rolled sheet exports climbed to a seven-year high, other-metallic coated exports were at a two-year high, and exports of plate in coils reached a 14-month high. Check out the International Trade Administration’s Steel Mill Export Monitor to dive deeper into exports by product or country.
Compared to a year ago, August exports by product were mixed, with four products higher this year and two lower. Significant year-over-year (y/y) changes can be seen in exports of other-metallic coated sheet (+23%), plate in coils (+20%), and plate cut lengths (-18%).
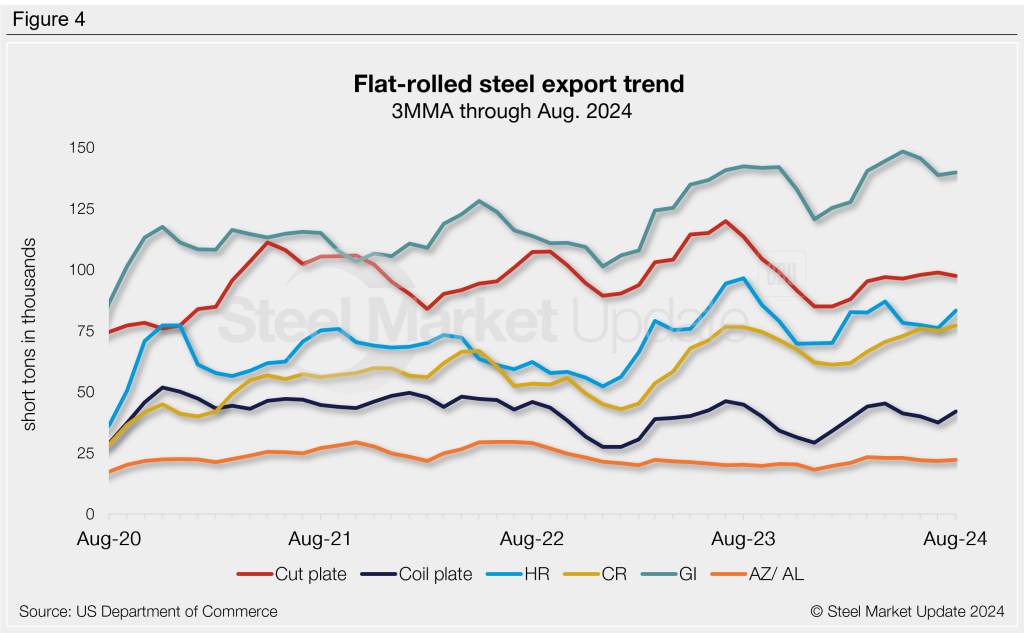
Figure 4 shows a history of exports by product on a 3MMA basis.
Note that most steel exported from the US is destined for USMCA trading partners Canada and Mexico. Over half (56%) of August exports went to Mexico, followed by 38% to Canada. The next largest recipients were the Dominican Republic, Colombia, China, and the Bahamas, at less than 1% each.
SMU members can view historical steel trade data on the Steel Exports page on our website.
Nucor’s top executive Leon Topalian has been elected vice chair of the World Steel Association (worldsteel) for the 2024-25 time period.
Topalian, the chair, president, and CEO of the Charlotte, N.C.-based steelmaker, will hold the position for one year.
A spokeswoman for Nucor celebrated the news in a statement to SMU.
“As North America’s largest steel producer, Nucor is proud to represent the American steel industry on the worldsteel executive board,” she said.
She noted Topalian looks forward to staying on the executive board as vice chair, having just completed a one-year term as chair.
“Worldsteel provides an important forum for global steelmakers to discuss issues impacting our industry, including trade and decarbonization, as well as sharing best practices in areas such as safety performance and sustainability,” she added.
Members of worldsteel represent ~85% of global steel production. The association maintains relationships with many international organizations, including the United Nations and the OECD.
On Tuesday, Worldsteel also named the following officers elected to serve for the next year:
Chair – Thachat Viswanath Narendran – CEO and managing director, India-based Tata Steel
Vice-Chair – Uğur Dalbeler – CEO, Turkey-based Çolakoğlu Metalurji A.Ş.
Treasurer – Mark Vassella, managing director and CEO, Australia-based BlueScope Steel Limited
Chair of worldstainless – Akihiko Inoue, representative director and president, Tokyo-based Nippon Steel Stainless Steel Corp.
Additionally, U.S. Steel President and CEO David Burritt was elected to the 2024-25 executive committee, worldsteel said.
For US companies, worldsteel also welcomed Beaumont, Texas-based Optimus Steel LLC as a regular member. CEO Luis Barrenechea will serve as the company’s representative at worldsteel. Optimus makes wire rod, straight plus coiled rebar, and billets at its Beaumont facility.
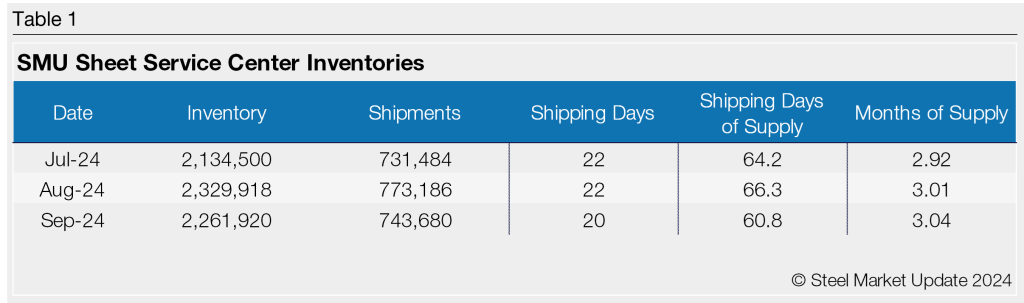
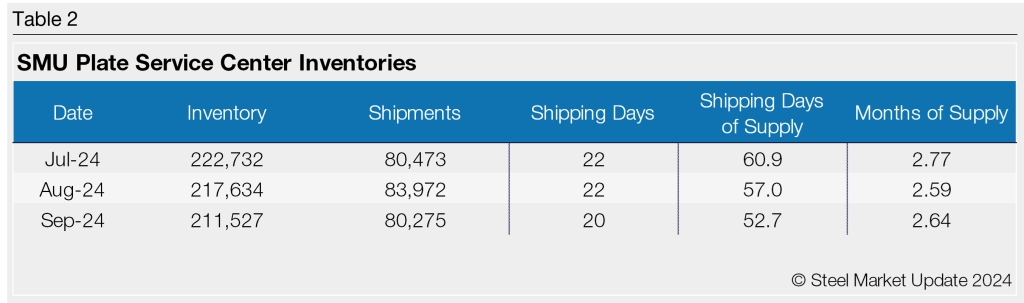
Flat rolled = 60.8 shipping days of supply
Plate = 52.7 shipping days of supply
Flat rolled
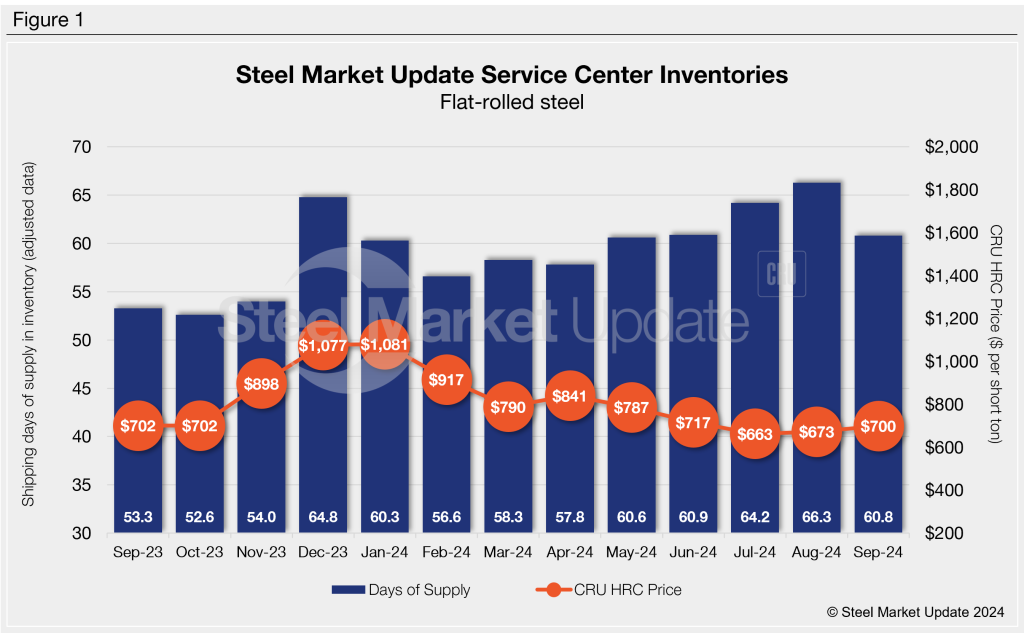
Flat-rolled steel supply at US service centers declined in September, though still seasonally high. September’s report reflects lower demand, stable lead times, and restocking early in the third quarter at a perceived bottom in prices. At the end of the month, service centers carried 60.8 shipping days of supply on an adjusted basis, according to SMU data.
This is down from 66.3 shipping days of supply in August but up from 53.3 shipping days in September 2023. Though down month-on-month (m/m), it’s still the highest September on record and one of the highest monthly figures year-to-date.
Flat-rolled steel supply in September was up marginally 3.04 months of supply, up from 3.01 months in August. September had 20 shipping days, two fewer than August. Sheet steel shipments typically hit a lull in July. The drop-off in shipments was more pronounced this year and appears not to have recovered much since.
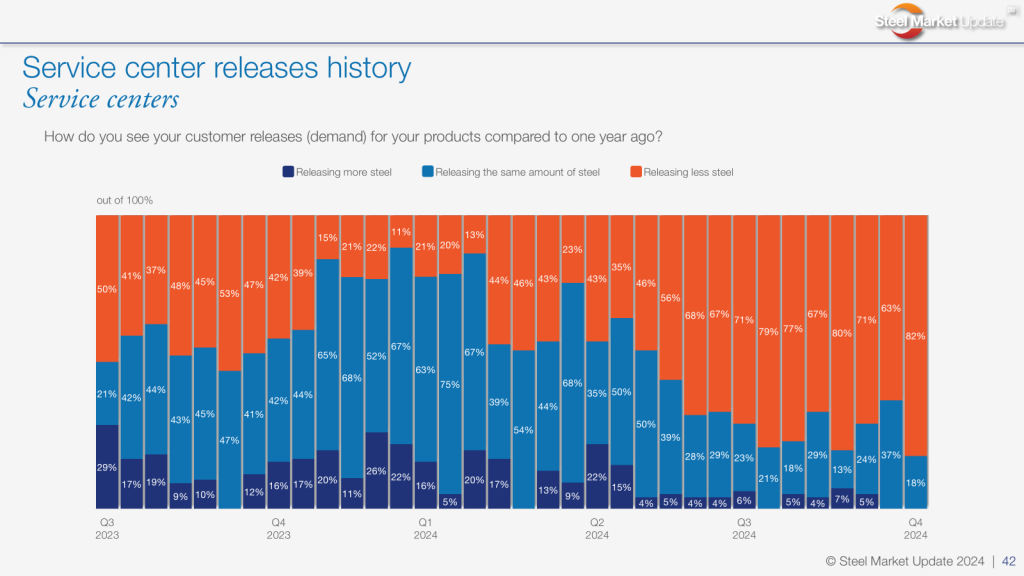
The SMU survey data through Sept. 25 reported that more than two-thirds of service centers said they were releasing less steel than a year ago, while the remaining 37% said they were releasing the same amount. Notable was no service centers said they were releasing more steel vs. September 2023.
Flat-rolled steel prices have seen marginal gains since bottoming out in July, edging up some in August and remaining largely stable in September. Mills have been publicizing higher prices, but lead times have been slow to react. The Sept. 25 SMU survey marked hot-rolled coil lead times at 4.88 weeks, down from 4.91 weeks two weeks earlier. Lead times have been unusually stable of late, averaging right around five weeks since mid-April.
Similarly, the SMU survey also found that 48% of service centers described mill lead times for new orders as “shorter than normal,” while another 47% saw them as “normal.” Service center inventories ballooned at the end of July, with marginal relief to close out Q3.
The perception that prices were at or near a bottom at the end of July drove many service centers to buy heavily toward the end of the month. Because of the spike in flat-rolled steel on order and the lackluster demand outlook, inventories moved higher in August, with a slight correction in September.
Despite a slew of planned mill outages in September and October, the market still seems to be oversupplied relative to demand. It’s a trend highlighted by the lack of a price boost, notwithstanding repeated efforts from mills to prop tags up.
Plate
US service center plate supply ticked down again in September due to conservative buying patterns on sluggish demand. At the end of September, service centers carried 52.7 shipping days of plate supply on an adjusted basis, down from 57 shipping days of supply in August. Plate inventories represented 2.64 months of supply in September, up from 2.59 months of supply in August. In September 2023, service centers carried 63.5 shipping days of plate supply, representing 3.18 months of supply.
Plate mill lead times are much shorter this year, down roughly 30% from a year ago. The SMU survey from Sept. 25 found plate mill lead times of 4.0 weeks, basically flat from a month prior. The survey a year ago reported plate mill lead times of 5.73 weeks. Ramped-up capacity earlier in the year and weaker-than-expected demand have kept the US plate market oversupplied.
With prices falling and weak demand, service centers have worked to destock, remaining diligent in managing inventory levels. But with shorter lead times, there has been little incentive to restock. As a result, material on order remains very low for plate. At the end of September, service centers had 24.5 shipping days of plate supply on order, down from 26 in August.
While inventories appear more than sufficient to meet immediate demand, the slight gain of material on order to close out Q3 may suggest a decline in inventories in October.
Keep in mind that plate on-order in September was up 1.3% m/m but down 30% y/y. Inventories were down more than 10% vs. September 2023. And, while the daily shipping rate saw a boost of 17% m/m and 8% y/y, it was 5% lower year to date.
The increased shipping rate is likely a result of SSAB pulling forward an outage and could, therefore, be reversed in October. Regardless, inventories remain lean and should be watched closely. Pricing could react quickly to any shift in demand as inventories and material on order are below normal levels.
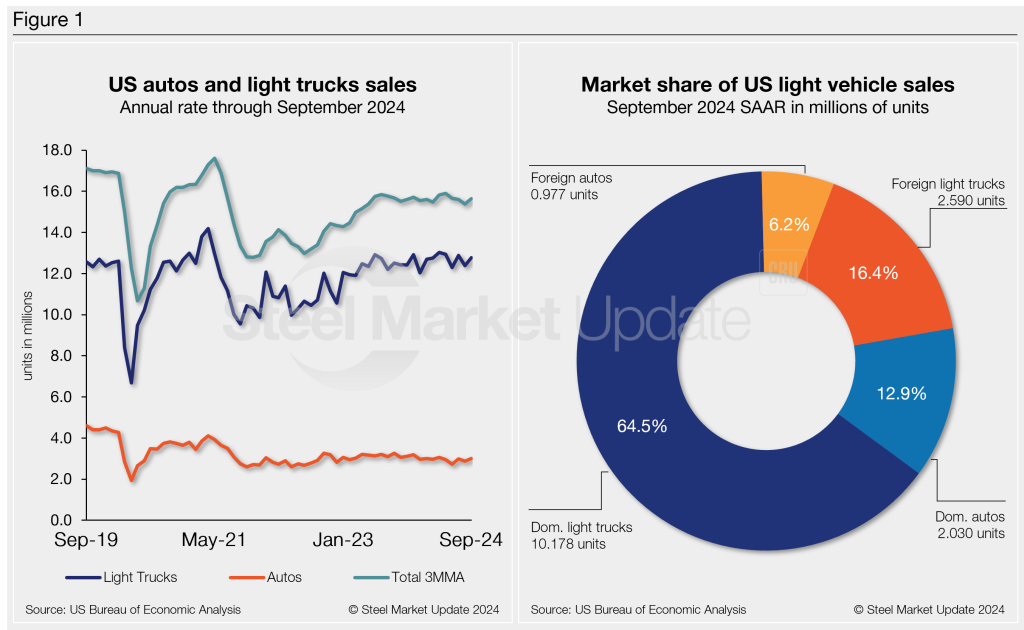
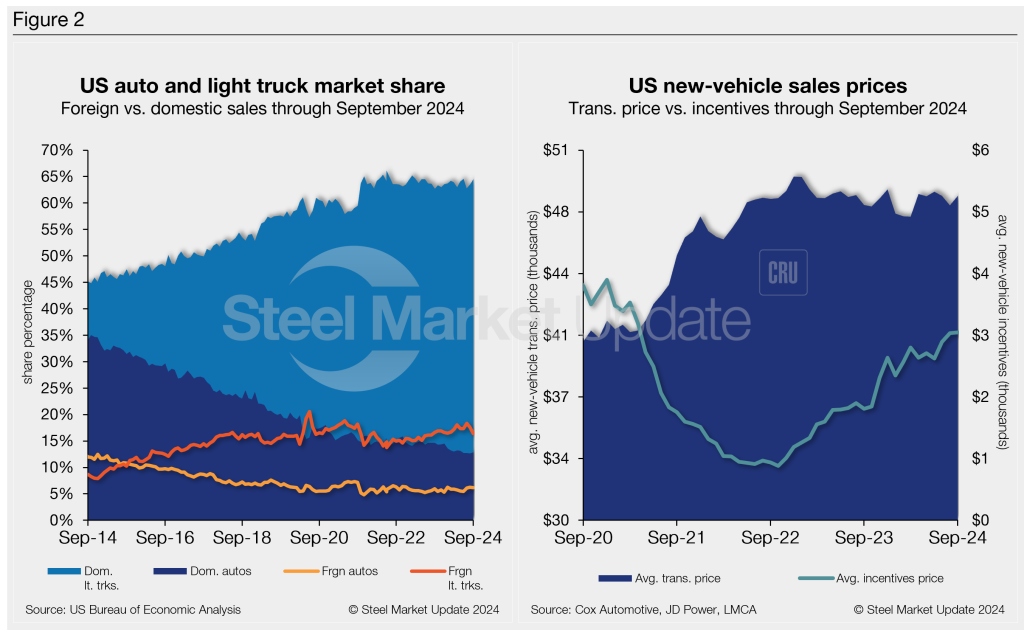
US light-vehicle (LV) sales fell to an unadjusted 1.17 million units in September, down 12.8% from a year ago, the US Bureau of Economic Analysis (BEA) reported. Despite the year-on-year (y/y) drop, domestic LV sales rose 3.3% month on month (m/m).
On an annualized basis, LV sales were 15.8 million units in September, up from 15.3 million units the month prior and slightly ahead of a consensus forecast of 15.7 million units.
Market conditions continue trending positively, though at a modest rate. The seasonally adjusted annualized rate (SAAR) of sales in the third quarter was 15.6 million units, the second straight quarter of negligible y/y growth.
High financing costs are still weighing on sales. However, the half percentage-point cut by the Fed in September, combined with additional cuts over the coming year, should boost sales moving into 2025.
Auto sales fell 18.5% y/y, while light-truck sales declined 11.3% from last year. Light trucks again accounted for 81% of September’s total sales, slightly above its 80% share last year.
September’s average daily selling rate (DSR) was 50,866 vehicles – calculated over 23 days – down 1.4% from the 51,576-unit daily rate one year ago.
Figure 1 below shows the long-term picture of US sales of autos and lightweight trucks from 2019 through September 2024. Additionally, it includes the market share sales breakdown of last month’s 15.8 million vehicles at a seasonally adjusted annual rate.
While auto production has recovered from the pandemic, it remains behind 2019 levels. The trend continues to widely impact the new vehicle average transaction price (ATP) with a lack of base trim models.
September’s ATP of $48,397 was up 1.1% m/m and 1% (+$498) y/y, according to data from Cox Automotive.
Incentives rose just 0.4% m/m, reaching a 42-month high of $3,047. Incentives now represent roughly 6.3% of the ATP. Compared to last year, incentives are up nearly 70%, or $1,241.
The annualized selling rate of light trucks for September was 12.768 million units, up 3.1% vs. the prior month and 2% higher y/y. Annualized auto selling rates were up 4.4% m/m but 7.7% lower y/y.
Figure 2 details the US auto and light truck market share since 2014 and the divergence between average transaction prices and incentives in the US market since 2020.
Editor’s note: This report is based on data from the US Bureau of Economic Analysis (BEA), LMC Automotive, JD Power, and Cox Automotive for automotive sales in the US, Canada, and Mexico. Specifically, the report describes light-vehicle sales in the US.
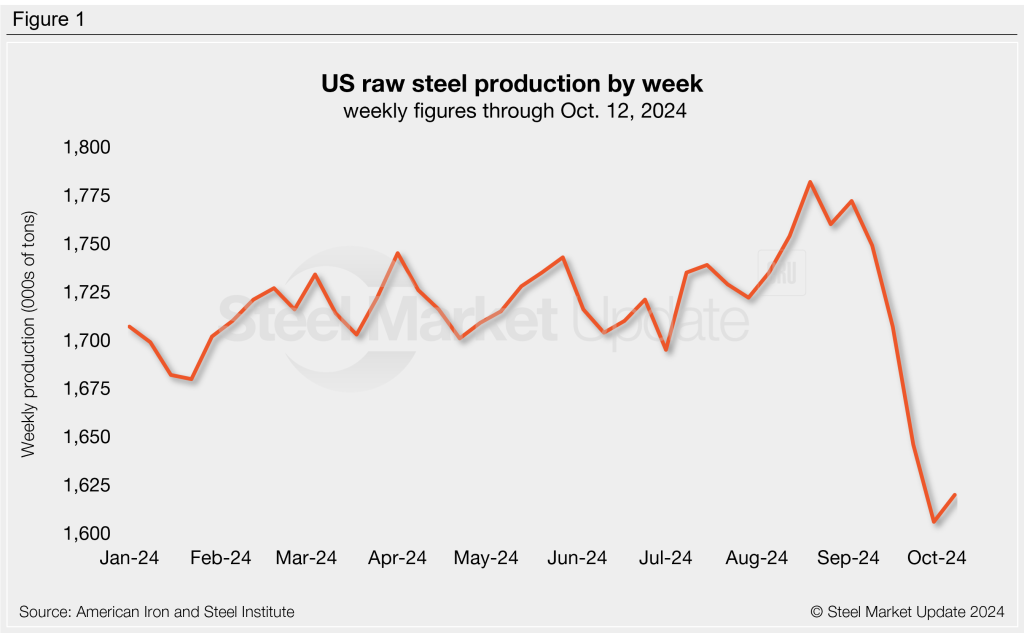
Domestic raw steel mill production slightly recovered last week, according to the latest figures released from the American Iron and Steel Institute (AISI).
Total raw steel mill output was estimated to have been 1,620,000 short tons (st) in the week ending Oct. 12. This is up 14,000 st, or 0.9%, from the prior week, when production had reached a 20-month low (Figure 1).
Raw production last week was 5.6% lower than the year-to-date weekly average of 1,716,000 st. Production is down by 2.6% compared to the same week one year prior when mill output totaled 1,664,000 st.
The mill capability utilization rate last week was 72.9%. This is up from 72.3% one week prior and up from 72.4% this time last year.
Year-to-date production is up to 69,438,000 st at a capability utilization rate of 76.5%. This is 1.7% less than the same time frame last year, when 70,673,000 st had been produced at a capability utilization rate of 76.4%.
Weekly production by region is shown below, with the weekly changes noted in parentheses:
Northeast – 108,000 st (up 5,000 st)
Great Lakes – 570,000 st (up 6,000 st)
Midwest – 213,000 st (up 11,000 st)
South – 681,000 st (down 10,000 st).
West – 48,000 st (up 2,000 st)
Editor’s note: The raw steel production tonnage provided in this report is estimated and should be used primarily to assess production trends. The monthly AISI “AIS 7” report is available by subscription and provides a more detailed summary of domestic steel production.
The Brussels, Belgium-based association said on Monday it now expects global steel demand to reach 1,751 million metric tons (mt) (1,930 million short tons) this year, down 0.9% from 2023.
Its earlier expectation of “a continued recovery in global manufacturing activity in 2024 has not materialized,” it said, with the sector instead experiencing a slump in the third quarter.
“2024 has been a difficult year for global steel demand as the global manufacturing sector continued to grapple with persistent headwinds such as declining household purchasing power, aggressive monetary tightening, and escalating geopolitical uncertainties,” Dr. Martin Theuringer, managing director of the German Steel Association and chair of worldsteel’s economics committee, said in a statement.
“The ongoing weakness in housing construction, which is driven by tight financing conditions and high costs, has further contributed to the sluggish demand for steel,” he added.
Worldsteel anticipates that steel demand will be down notably this year in China and most major developed countries. Steel demand in India, in contrast, is forecast to grow markedly both this year and in 2025. For most other major developing economies, worldsteel foresees a demand rebound after slowdowns in 2022 and 2023.
Looking ahead to 2025
Despite the ongoing challenges, worldsteel remains cautiously optimistic about a recovery in 2025.
It expects a 1.2% rebound in 2025 steel demand, down notably from the 2.7% rise it predicted earlier this year. Following three years of falling demand, a broad-based recovery is forecast for the world ex-China.
Easing financing conditions, increased public and private investments, and the green transition will drive demand for steel, worldsteel said, particularly for renewable energy projects and infrastructure development.
Additionally, it projects the expansion of electricity grids and renewable energy capacity to double steel demand for these sectors by the end of the decade, especially in China, India, and developed economies.
A more substantial recovery in residential construction in the US, EU, and South Korea is also expected in 2025, driven by an anticipated easing in fiscal policy.
The automotive sector, which saw growth in 2023, is expected to slow down in 2024 before recovering in 2025.
Developed world
Worldsteel predicts a 2.0% drop in steel demand this year in the developed world, as major economies, including the US, Japan, Korea, and Germany, face considerable declines.
However, a recovery is anticipated in 2025 “driven by the long-awaited upturn in steel demand in the EU, and modest recoveries in the US and Japan,” worldsteel noted. It projects steel demand growth of 1.9% in the developed world in 2025.
In the US, steel demand was 90.5 million mt in 2023, according to worldsteel’s figures. It foresees a 1.5% decline in US demand this year, followed by a 2.0% increase to 91.0 million mt in 2025.
China
Steel demand in China will continue to be impacted by its struggling real estate sector. According to worldsteel’s predictions, demand will drop 3.0% this year to 868.8 million mt and another 1.0% in 2025 to 860.1 million mt.
Developing world ex-China
Strong growth in India and recoveries in other major emerging markets will drive steel demand in the developing world, excluding China, worldsteel said.
Growth of 3.5% is expected this year in the developing world ex-China, and another 4.2% rise is likely in 2025.
Steel demand in India is forecast to rise 8.0% y/y to 143.4 million mt this year, with a further 8.5% increase next year.
In Mexico, worldsteel predicts a 0.9% y/y rise in steel demand to 29.3 million mt in 2024, followed by a 0.6% increase to 29.5 million mt in 2025.
The Turkish government has placed anti-dumping duties of ranging from 6.10% to 43.31% on hot-rolled steel sheet from China, India, Japan, and Russia. Meanwhile, Malaysia has announced it will investigate allegedly dumped steel wire rod from China, Indonesia, and Vietnam.
Turkey’s levies will affect around 4 million metric tons (mt) of products worth between $2 billion and $2.2 billion, Turkish Steel Producers Association Secretary-General Veysel Yayan was reported as saying by Reuters news agency.
He expected capacity utilization at domestic producers will increase after imposition of the AD duties that range from around 15% to 43% for China’s imports and 6% to 9% for those from India, Japan and Russia. The levies will be applied to the cost, insurance, and freight prices of the steel.
Turkey’s trade authorities acted after a request from domestic producers, which claimed the dumping threatened to harm the Turkish steel industry.
In Malaysia, the ministry of investment, trade and industry (Miti) says it will investigate imports of steel wire rods from China, Indonesia, and Vietnam after domestic producer Southern Steel filed a petition alleging increased volumes of the products being sold below domestic prices were causing material injury to Malaysia’s steel industry. Interested parties must request questionnaires by Oct. 25 and submit comments by Nov. 9, the Bernama news agency reported.
Editor’s note: This article was first published by CRU. To learn more about CRU’s services,clickhere.
After holding its weekly spot price for hot-rolled (HR) coil steady for three weeks at $730 per short ton (st), Nucor lowered the price this week by $10/st.
The Charlotte, N.C.-based steelmaker notified customers in a letter on Monday that this week’s base consumer spot price (CSP) for HR coil will be $720/st.
This week’s price is flat compared to a month ago. The CSP has remained within a $50/st spread since late July.
SMU’s Oct. 8 check of the market revealed HR coil prices to be in the range of $660-730/st, with an average of $695/st. Nucor’s CSP has been at the high end of SMU’s price range since the week of Sept. 8. Subscribers can track prices for steel sheet and plate using the Interactive Pricing Tool on our website.
Nucor’s letter again noted that it will continue offering 3-5 weeks lead times for HR spot purchases.
Nucor also lowered the CSP for HR coil from its West Coast joint-venture subsidiary, California Steel Industries (CSI), by $10/st from last week to $780/st.
Everybody has an opinion about politics these days. More importantly for our readers, though, every business has a bottom line. A popular question in our most recent steel buyers survey asked how uncertainty around the upcoming US presidential election could affect that line.
It turns out that many of our survey respondents had opinions to share on that (see slide 58 below). I would characterize those responses, not so scientifically, as stretching from ‘Nah’ to ‘Heck, yes.’
Based on the number of comments we received, it’s a subject on most of our readers’ minds. One of our service center respondents even said this election is making buyers plain “dumb.” Of course, we couldn’t agree.
Turning to service centers, we see that 18% of service center respondents said they are lowering spot prices to customers (slide 33). That’s a new development. And on our service center releases history slide (slide 42), we see that 82% of respondents said that they are releasing less steel, up from 63% two weeks earlier. Lower prices and demand, will the trend continue?
A less contentious subject than politics or prices is the weather. Well, the weather has been very much in the news as of late. We asked our survey participants if they were seeing any fallout to the supply chain from Hurricane Helene (slide 59). This was before Milton entered the picture. While the majority responded no, the comments give a more nuanced picture. Especially as hurricane season traditionally runs through Nov. 30, we hope we won’t have to add too many more weather questions to the mix.
So, for those of you in the business of perusing charts, crunching numbers, deciphering comments, and drawing conclusions, have at it. And if you’d like to share what you gleaned, feel free to tell us at info@steelmarketupdate.com. Below, you can find the survey slides with respondents’ comments below.
Slide 58: Is uncertainty around the US presidential election impacting your business? Why or why not?
“Our business is hooked to energy – we are either going to be ‘drill, baby, drill’ or green… .”
“Very much so. People are waiting, and each candidate has very different plans, and each could help spur business but in different ways.”
“Buyer hesitancy.”
“Indecision about the direction of the economy and spending.”
“People are still ordering and are planning for the future.”
“Money is held usually during these times so projects are put on hold.”
“Everyone is driving down their inventory and waiting; not even sure some buyers understand what they are waiting for.”
“‘Maybe’ to ‘No’ here. It won’t really impact our business, or steel pricing for that matter – short of a potential Section 232 2.0.”
“Much more affected by interest rates. Never bought into the presidential effect.”
Slide 33: Compared to two weeks ago, how is your company handling spot pricing to your customers?
“Mill prices are stable, but buyers assume because their business is soft, prices should be sliding, not the case.”
“Lowering when and where needed.”
“We are adjusting according to the inquiry.”
Slide 42: How do you see your customer releases (demand) for your products compared to one year ago?
“We still have some strong markets in construction.”
“We typically see a slowdown headed into the holidays. But this year, with the election, buyers are just dumb.”
Slide 59: Are you facing any supply-chain issues related to Hurricane Helene? (And if yes, how so?)
“The hurricane(s) are absolutely likely to have ripple effects across various industries, potentially leading to shortages, increased prices, and longer lead times for affected products and materials. The full extent of the impact may take time to fully manifest as businesses and communities work to recover from the hurricane’s devastation.”
“We aren’t. I had some concerns about a double whammy with that and the work stoppage at the ports, but that never truly materialized. All good.”
“While there may be knock-on effects, fortunately our supply base is not in the directly affected areas.”
“Transportation is an issue and will be around for a while during these events.”
Stay safe out there, and, as always, thank you for your continued interest in Steel Market Update.
The Global Forum on Steel Excess Capacity (GFSEC) reaffirmed on Oct. 8 what domestic steel producers have long known—the threat of excess steel capacity never disappeared and is evolving.
China’s steelmakers are boosting capacity and exports, echoing the 2016 global steel crisis. There is no doubt that China is successfully weaponizing excess capacity across many industries. And the fatal damage to domestic production and national security undermines the interests of all market-oriented countries. The question now is: How will GFSEC countries respond?
The limits of Section 232
While the China-driven gap between capacity and demand narrowed slightly in the late 2010s, global installed capacity always greatly exceeded global demand. China assured the world that it would curb capacity and production. Instead, it replaced and expanded existing capacity, even while demand fell. As a result, global excess capacity is forecast to grow to 630 million metric tons by 2026—the highest level since 2016.
For more than a decade, the China story was simple: State-funded steelmakers added unneeded capacity, overproduced commodity steel products, and dumped the overproduction in the United States. US steelmakers petitioned for trade remedies to address oversupply exported directly from China, and the US government implemented Section 232 duties. Countering the next round of capacity and export growth will not be so straightforward.
First, as oversupply floods their home markets, steel producers in third countries will turn to export markets. China’s net steel exports have increased each year since 2020, even as global demand has declined. These unfairly priced exports cause a chain reaction in global markets. China’s exports take market share from producers in third countries. Those producers must either meet the unsustainably low oversupply prices or offset falling home market sales with increased export sales. Inevitably, the exports find the highest demand markets and begin driving prices down, perpetuating the harm caused by China’s oversupply.
Enter the multi-country trade remedy
Multi-country trade remedy actions are increasingly needed when these third-country exports enter the United States simultaneously. Though observers who represent importer interests object to multi-country cases, it’s worth noting that this is not just a US phenomenon. Steel and other industries in many countries have also been forced to pursue trade relief from multiple third-country producers escaping import competition from China.
Second, China’s producers are not just exporting oversupply to third countries, they are setting up capacity there. As part of the Belt and Road Initiative (BRI), China provides industrial subsidies to producers outside of its borders. Chinese steelmakers have announced major capacity expansions in Thailand, Malaysia, and Vietnam (among others). These countries will increasingly become export platforms to avoid US duties on Chinese exports.
BRI breaks into the Western Hemisphere
Worse still, Chinese companies are adding capacity in the Western Hemisphere to exploit US trade arrangements. For example, when the Dominican Republic-Central America-United States Free Trade Agreement (CAFTA-DR) was negotiated and adopted, China had not yet implemented BRI. BRI is now in full swing. And China is actively pursuing geopolitical and economic opportunities in the Western Hemisphere.
In the aluminum extrusion context, China’s extruders have seized on CAFTA-DR’s trade preferences to establish production capacity in the Dominican Republic. But they use workers, raw materials, and equipment from China. These types of investments will only increase, as we’ve seen in Mexico. Foreclosing this route may require GFSEC countries to reexamine existing trade agreements.
Downstream products need protections too
Third, the prices of downstream articles produced in third countries will increasingly bake in excess capacity and oversupply. The easiest way to mask an unfairly traded product is to incorporate it into a downstream product. The dumped or subsidized input leverages down the downstream product’s overall price and escapes duties.
Preventing this tactic must be a key priority for GFSEC countries looking to “address the distortions caused by excess capacity, including with respect to the circumvention of trade measures.” It will require greater cooperation between GFSEC members to trace upstream steel articles. It will also require more widespread adoption of “melted and poured” requirements for steel and “smelted and cast” requirements for aluminum in USMCA.
Expanding Section 232-type programs to cover steel and aluminum content in derivative products will also be necessary. So too will be applying antidumping and subsidy orders to dumped steel or aluminum inputs when they are incorporated into downstream products. These concepts for trade remedies first started in certain OCTG cases we brought and have evolved in cases covering small vertical shaft engines, container chassis, and the original and current aluminum extrusions investigations.
WTO unable to uphold post-WW2 trade order
At the GFSEC Ministerial Meeting, Assistant US Trade Representative Sushan Demirjian hinted at “additional policy ideas on defining and responding to non-market policies and practices” in the coming months. New tools and self-help are essential because the non-market problem is not going away.
So long as Russia and China have influence at the WTO, post-WW2 trade rules will be impossible to reform at the WTO, and non-market excess capacity will persist. In the meantime, like-minded market economies will need to work to creatively address excess capacity, its economic impact on domestic industries, and the resulting national security challenges.
Editor’s note
This is an opinion column. The views in this article are those of experienced trade attorneys on issues of relevance to the current steel market. They do not necessarily reflect those of SMU. We welcome you to share your thoughts as well at info@steelmarketupdate.com.
Cleveland-Cliffs’s Chairman, President, and CEO Lourenco Goncalves hosted a fireside chat with US Trade Representative Katherine Tai and Acting Secretary of Labor Julie Su on Friday at the company’s plate mill in Coatesville, Pa. They were joined by Congresswoman Chrissy Houlahan (D-Pa.) and United Steelworkers (USW) Director of District 10 Bernie Hall.
Hall mentioned the legacy of steel production in the Coatesville plate facility, where workers have been melting and pouring steel for over 200 years. Operations at the plant began in 1810, and the mill has been owned by various companies, including Bethlehem Steel, the International Steel Group (ISG), and ArcelorMittal USA. The EAF mill outside of Philadelphia currently has an annual capacity of 800,000 short tons of steel plate.
Union workers take pride in their work, Hall said, noting their importance in producing steel for things important to national security, like naval vessels, and infrastructure projects like the rebuilding of the I-95 bridge in Philadelphia that collapsed last year.
The rest of the conversation covered various topics related to the steel industry, including infrastructure, legislative policies, diversity and inclusion, and collaboration between industry, union, and the government.
Industry, union, and government cooperation
Addressing an audience that included members of the USW and the United Auto Workers (UAW), Goncalves acknowledged the challenges of maintaining positive relationships in the current political climate.
He further noted how vital collaboration is between labor unions and corporations, rather than an adversarial stance between them, in supporting the workforce and local communities.
Goncalves also called attention to the significance of the Biden administration’s dedication to workers’ rights: “I believe that he has our back,” he reiterated.
Tai spoke on the importance of aligning trade and labor policies to prioritize industries like steel.
She pointed out that globalization and a focus on maximizing shareholder profits have resulted in many companies ignoring the larger costs to Americans and their communities over time. So the administration, with its worker-centered trade policy, is trying to flip the script on that, she said.
She commented that the USMCA is “flipping the script on what a trade agreement can do.” A mechanism in the pact allows the US to hold companies accountable when they offshore American production but then set up shop in Mexico. The system has allowed more than 30,000 Mexican workers to empower themselves by joining a union, she said.
“We are just beginning to even the playing field in terms of the competition between America’s workers and Mexico’s workers,” Tai added. “This is what we’re talking about, stopping the pitting of workers against each other and actually creating mechanisms that allow for workers to support each other.”
Diversity & inclusion
Additionally, the conversation touched on the administration’s commitment to fostering an inclusive environment that rewards talent across all demographics. Cliffs is doing the same, Goncalves said, commenting how diversity and inclusion shouldn’t just be goals but also an integral part of workplace culture.
A diverse workplace reflects what the United States of America really is, he remarked.
Diversity, inclusion, and representation are essential in leadership positions at companies and in Congress, said Houlahan, who is also a veteran, an engineer, and a chemistry teacher. “What we need is diversity of all forms in all places,” she stressed.
“Unions know that when you open your doors up to be truly inclusive, that’s how you build the strongest organizations that you need,” Su added.
Leadership matters
Su added one more thing: “Leadership matters.”
She pointed out that Donald Trump had promised an ‘infrastructure week’ as president, but that never materialized. Meanwhile, the Biden administration has stepped up and made infrastructure investment happen.
It’s important to have policies that translate into what’s good for the steel industry, “And in order to do that, we have to have leadership to do it,” she noted. “The progress that we’ve made will only continue with leaders who understand how to use the tools that we have in an intelligent, thoughtful way.”
Unity of vision
Tai pointed out rare parallels among the five folks having the fireside chat.
Typically, “USTR and the Department of Labor are at loggerheads,” but she and Su have been working alongside each other with a unity of vision. “It’s rare, similarly, for labor and management to have the kind of relationship that you have here at Cliffs,” she added.
“You look at the five of us up here, and what is really unity of vision around this industry, around where the direction that we want our economy to go. And I just want to say it’s rare that you have this kind of consolation, and it’s extremely special. And when brought together, it can be extremely powerful,” Tai asserted.
Concluding the event, Goncalves reiterated Cliffs’ commitment to workers and communities, expressing hope for a collaborative future.
“Count on us, and let’s continue to work together,” he stated, reinforcing that a united approach among industry leaders, unions, and the government is vital for achieving lasting economic sustainability and a stronger middle class in America.
August steel imports totaled 2.38 million short tons (st), according to final data released this week by the US Commerce Department. That was down 2% from July and is the second-lowest monthly rate recorded this year. Data collected through Oct. 6 shows September licenses totaling 2.30 million st, which would be a 3% drop from August (Figure 1, left).
Almost half of all the steel that entered the US in August came from just three countries: Canada (21%), Brazil (19%), and South Korea (11%). Other significant contributors included Mexico (7%), Vietnam (6%), and Germany (5%). Japan, Taiwan, and Romania are also worth mentioning (3-4%).
The International Trade Administration’s Steel Import Monitor is an excellent resource to explore imports by specific product or country.
Smoothing out the data
To smooth out the variability seen in monthly data and better highlight trends, we can look at imports on a three-month moving average (3MMA) basis (Figure 1, right). From this perspective, final August imports eased to a seven-month low of 2.32 million st. The 3MMA through September is currently up slightly to 2.37 million st. Recall that we saw a 22-month high 3MMA of 2.73 million st back in May.
For comparison, the average monthly import rate in 2023 was 2.35 million st, while the first eight months of 2024 have averaged 2.52 million st per month.
Semi-finished vs. finished breakdown
As shown in Figure 2, semi-finished steel imports jumped 35% from a nine-month low in July to 524,000 st in August. September’s license count is currently 4% below August at 501,000 st. For reference, semi-finished steel imports averaged 524,000 st per month last year. 2024 has seen a monthly average of 557,000 st through August figures.
Meanwhile, imports of finished steel products totaled 1.85 million st in August, a 9% drop from July. September’s license count of 1.80 million st suggests a further 3% month-on-month (m/m) decline. Finished imports averaged 1.83 million st per month in 2023, whereas the monthly average for the first eight months of 2024 now stands at 1.96 million st.
Imports by category
Figure 3 shows monthly imports by product category. Following an increase in July, flat-rolled steel imports eased 6% m/m in August to 990,000 st. The latest license data shows a likely 4% decline in September to 951,000 st.
Following a July surge, imports of long products slipped 31% in August to 371,000 st. September licenses are currently right in line with August at 373,000 st.
Pipe and tube imports rebounded 15% from July’s eight-month low to 392,000 st in August. September licenses are up another 2% to 399,000 st.
Stainless imports fell 12% from July’s two-year high, totaling 98,000 st in August. September stainless projections are currently at 79,000 st, potentially down 19% m/m.
Flat-rolled imports
Figure 4 shows flat rolled imports by popular products. The largest monthly mover from July to August was cut to length plates (-56%), followed by other-metallic coated (+32%), hot-rolled coil (-22%), and cold-rolled coil (-15%).
September licenses are mostly down across the products we track. Current data indicates significant drops are expected in tin plate (-30%), other-metallic coated (-22%), and plate cut lengths (-10%). The two products expected to rise in September are HR coil (+16%) and plate in coils (+9%).
Imports by product
Table 1 provides further detail into imports by product, highlighting high-volume steel products. Explore this steel trade data deeper on the Steel Imports page of our website.