The US government’s decision on whether it will block Nippon Steel’s acquisition of U.S. Steel on national security grounds has been pushed until after the November elections.
That’s according to a Sept. 17 Reuters report citing sources familiar with the matter who preferred to remain anonymous due to the delicacy of the situation.
Reuters said that the Committee on Foreign Investment in the US (CFIUS) allowed USS and Nippon to refile their application seeking approval for the merger.
That would reset the 90-day period CFIUS has to review the application and delay its decision on whether the deal poses a threat to national security.
If the Committee refers the case to President Biden after its review, he will have up to 15 days to decide the deal’s fate.
Nippon Steel declined to comment on this story. U.S. Steel and CFIUS did not return requests for comment.
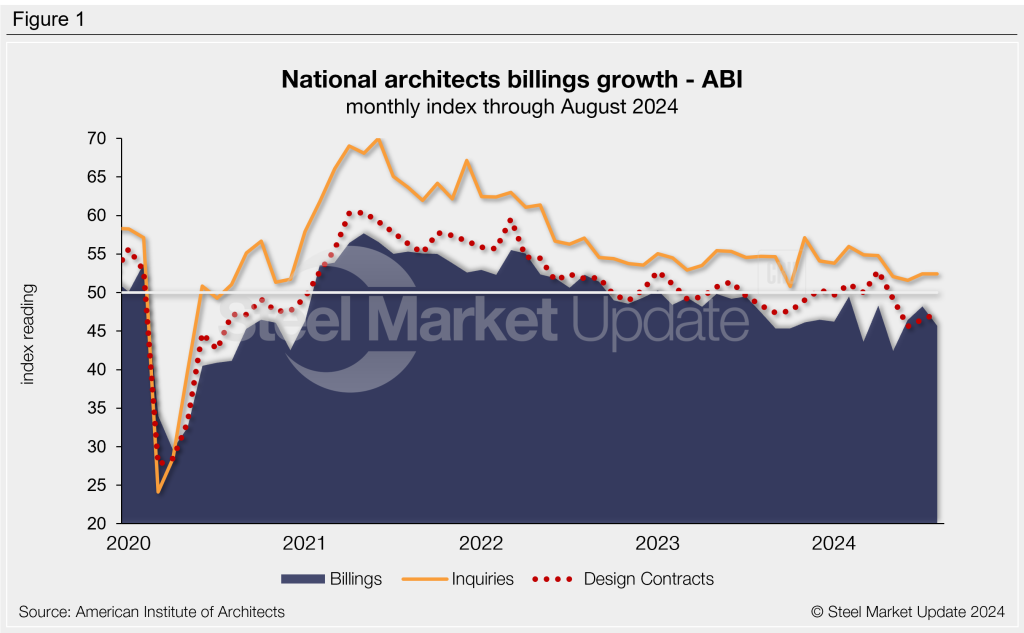
The August Architecture Billings Index (ABI) continued to indicate weak business conditions amongst architecture firms through August, according to the American Institute of Architects (AIA) and Deltek.
The August ABI eased 2.5 points from July to 45.7, the third-lowest figure recorded this year (Figure 1). The index has indicated contracting business conditions for the last 19 months. At this time last year, the index was 47.5, whereas two years prior, it was 52.3.
The ABI is a leading economic indicator for nonresidential construction activity. It can project business conditions approximately 9-12 months down the road. Any score above 50 indicates an increase in billings, while a score below that indicates a decrease.
“Unfortunately, even the impending interest rate cuts didn’t move the needle on project inquiries or new design contracts at architecture firms,” said AIA chief economist Kermit Baker. “Hopefully, once the trajectory of further cuts gets clarified, delayed projects will restart, and new projects will gather momentum.”
The project inquiries index remained optimistic in August, holding steady at 52.4. However, weakness in the design contracts index continued for a fourth consecutive month, inching up to 47.3.
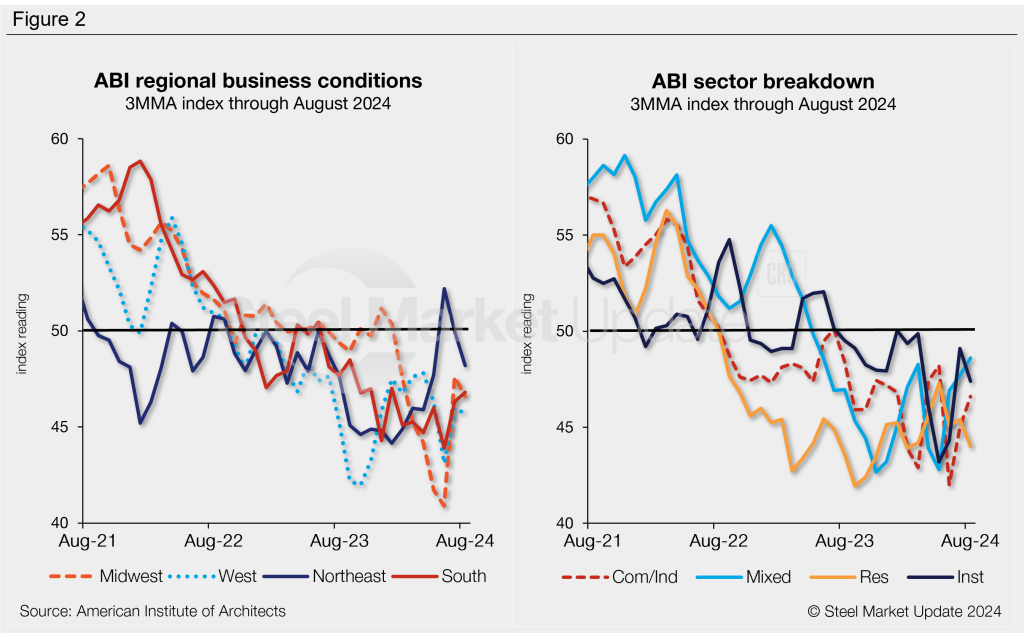
All four regional indices indicated less than stellar business conditions in August (Figure 2, left). The Southern index was the only regional index to move higher from July to August. The Northeastern regional index was the least dismal of the four.
Sector indices also continued to indicate declining billings across the board in August (Figure 2, right). Two sector indices saw some degrees of growth compared to the month prior (mixed practice and commercial/industrial), while two sectors declined further (institutional and multifamily residential).
An interactive history of the August Architecture Billings Index is available here on our website.
On Monday and Tuesday of this week, SMU polled steel buyers on various topics, ranging from market prices, demand, and inventories to imports and evolving market events.
Rather than summarizing the comments we collected, we are sharing some of them in each buyer’s own words.
Want to share your thoughts? Contact david@steelmarketupdate.com to be included in our market questionnaires.
Steel prices are still firm. How do you expect prices to trend over the next three months?
“Little up, a little down, unless something happens in the industry to push the price higher.”
“Stay firm. Mills can now manage.”
“Everything is very slow now.”
“Zig and zag, but no real movement until after the elections for sure.”
“We don’t truly see them as ‘firm.’ We haven’t been big believers in this mini-rally and we don’t see things going much higher from here.”
“About the same through 2024.”
“I think prices peak in the next couple of weeks and then fall under pressure during the holidays.”
“Relatively flat overall.”
“Flat to slightly down, unless more capacity is taken out.”
“HR will be sideways to up slightly on continued soft demand and controlled supply. Plate will be down at least one more time in 2024 then stable into Q1’25. Demand just isn’t there for plate, and supply is good.”
“Plate will be flat to maybe down slightly but expected to climb in Q4.”
“Slight migrating down for plates.”
“Capacity reductions will allow prices to inch up.”
“Prices will slowly gain momentum – many moving parts within the domestic mills.”
Is demand improving, declining, or stable?
“Still sluggish but I feel that will change with Cliffs idling a blast furnace.”
“Declining.”
“Plate is stable to slight decline.”
“Stable but at a relatively low level.”
“Somewhat stable.”
“Stable with pockets of improvement.”
“Demand is stable to declining, more driven by buyers reducing inventory on the expectation that prices will fall.”
“Declining slowly as markets wait on election and Fed rate cuts.”
“Increasing slightly due to interest rates coming down.”
“Demand is strong for us, but we are taking market share from more established folks. Everyone we talk to is still very slow.”
Is inventory moving faster or slower than this time last year?
“Slower right now as buyers expect the worst.”
“Slower, high interest rates and slowing economy.”
“Slower, customers are still reluctant to place orders.”
“Slower with less demand.”
“Slower due to slower overall demand than last year.”
“Slower due to uncertainty in the plate market.”
“Inventory is moving at a good clip, but we also aren’t stocking much extra. Very hand-to-mouth, by design.”
“About the same.”
“Steady.”
Are imports more attractive than domestic material?
“No, market is already at a very low point; it can only go up.”
“No, price gap is too thin in soft demand environment.”
“Not attractive overall.”
“Nope.”
“Imports are not until a preliminary ruling from ITC.”
“Not attractive based on what buyers expect to happen with prices in the US.”
“Getting there. A bit up in domestic and a bit more down in Europe, and we are there.”
“Yes, except China with additional tariffs. Landed cost is now cheaper than domestic but will not hit inventories for another couple months.”
“If you can stomach the lead time, you can definitely find cheaper imports (versus domestics).”
“Imports are priced better than domestic.”
“Yes, but long lead times.”
What’s something that’s going on in the market that nobody is talking about?
“Are inventories getting too low?”
“The ridiculousness of allowing Brazilian slabs and HRC to come into the USA [quota], but to block Mexican HRC made with those same Brazilian slabs.”
“Tariffs from US and Canada on Chinese steel that will take effect Oct. 1.”
“I still expect we’ll continue to see more consolidation on the service center side. This hasn’t been a great year, obviously, and the big regional players might be looking to get out.”
“Lack of imports for balance of the year.”
“Bouncing around projections and regulations along with Biden administration secretly moving duties upwards.”
“Real demand if the govt. backed/funded jobs were delayed, scaled back, or removed.”
“Evraz status.”
Cleveland-Cliffs is seeking $750 per short ton (st) for hot-rolled coil. That’s $20/st above where the steelmaker had been. It’s also $30/st higher than Nucor’s published price of $720/st.
We’ve seen prices increase incrementally this week. SMU’s HR price, for example, stands at $690/st on average, up $5/st from last week. The questions now are whether a number well above $700/st will stick, whether other mills will follow Cliffs, and whether there is enough demand to support higher prices.
Keep tabs on the negotiation rate
To help answer that, I’ll be keeping an eye out for the mill negotiation rate when we release our next full steel market survey to premium members on Friday, Sept. 27.
Why? Mills, since late July, have been steadily pushing prices higher, as you can see in our price announcement calendar. During that time, SMU’s sheet price assessments have stabilized and moved higher as well – but never quite as high as mills’ list prices.
Perhaps that’s to be expected. Most buyers continue telling us that mills remain willing to negotiate lower prices. And this week, we’ve heard from some market participants that certain mills were offering discounts just before Cliffs announced its price increase on Tuesday.
Was that a case of trying to bring in large volumes at low prices in hopes of stretching out lead times, thus giving higher prices a better shot at sticking on smaller orders?
But back to the negotiation rate. In early July, when HR prices were falling on their way down to as low as $600/st, 95% of surveyed buyers told us that mills were willing to negotiate on HRC. Mills aren’t as willing to negotiate now as they were then. Nonetheless, 71% of buyers told us last week that their mill suppliers remained open to cutting deals.
If numbers significantly north of $700/st are to gain traction, the negotiation rate should go down. Case in point: Prices sustained a rally in Q4 of last year. In late November of 2023, only 29% of buyers surveyed said mills were willing to negotiate lower HR prices. The negotiation rates were even lower for cold rolled (8%) and galvanized (16%).
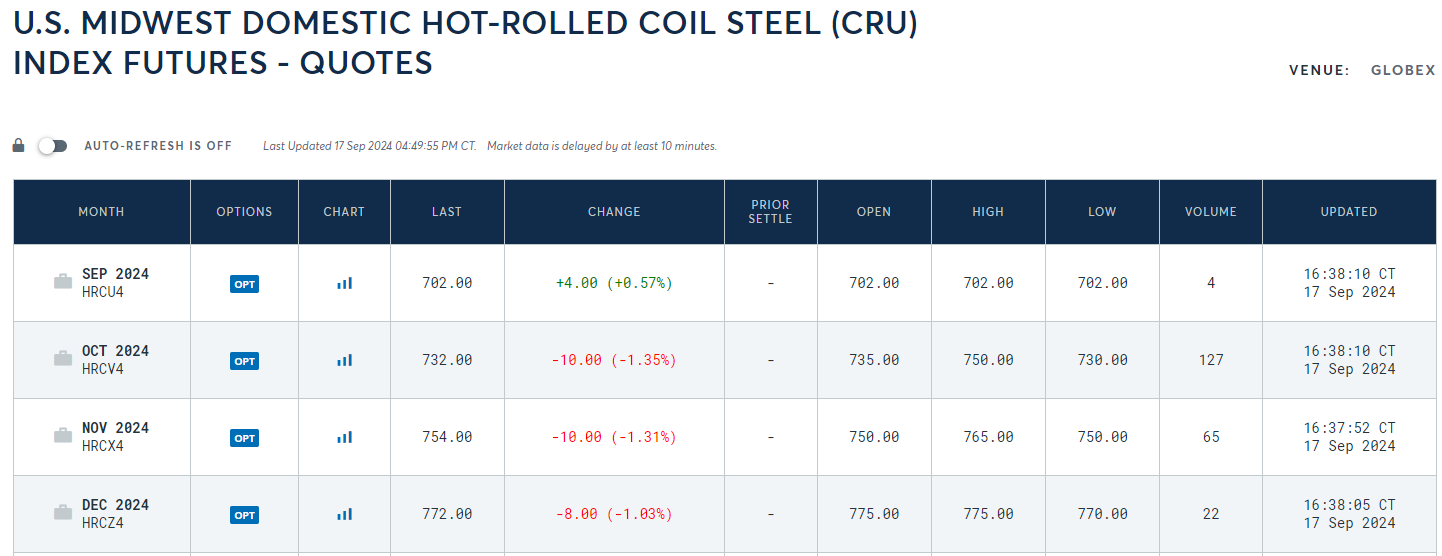
One thing is already clear. Futures markets have not reacted to Cliffs’ price announcement in the bullish way they did to reports of C-6 being hot idled:
Yes, September was seeing some modest gains on Tuesday afternoon trading. But prices for Q4 slipped. Last week, following news of the hot idling, everything moved up.
Futures, of course, don’t predict the future. But they do perhaps reflect the sentiment that a furnace outage is more meaningful than a price increase announcement.
Also, there is the matter of inventories. As our premium members know, August sheet inventories came in high. SMU’s David Schollaert has the details here. Here is one key figure: Service centers had 66.3 shipping days of supply in August. That’s the highest level since May 2020, when shipping days of supply reached 67.7.
I’m guessing that number will decrease in September, as we’ve also seen indications that more steel buyers are destocking. But in the meantime, how much can sheet prices increase with a potential inventory overhang like that? Are supply constraints – the coated trade case, an expected furnace idling, and maintenance outages – enough to offset it?
Please share your thoughts with us at info@steelmarketupdate.com. (We thank you ahead of time for keeping the feedback professional.)
SMU membership levels and Hedging 101
I’ve been referring to some of our “premium” content and data. If you’re an “executive” member, things like our survey results and service center inventories report are good reasons to consider upgrading to premium. Please reach out to SMU senior account executive Luis Corona at luis.corona@crugroup.com if interested.
Also, as most of you know, SMU features regular columns on HR and scrap futures. If you’d like to learn more about the topic, consider attending our Hedging 101 Workshop next week (Wednesday, Sept. 25) at Hyatt Centric The Loop Chicago (100 West Monroe St.) from 8 a.m. to 5 p.m.
Lunch is included. And here’s a fun fact: The course will be taught by Spencer Johnson, one of our columnists and a veteran futures broker at StoneX. Luis and I will be there too. You can register here.
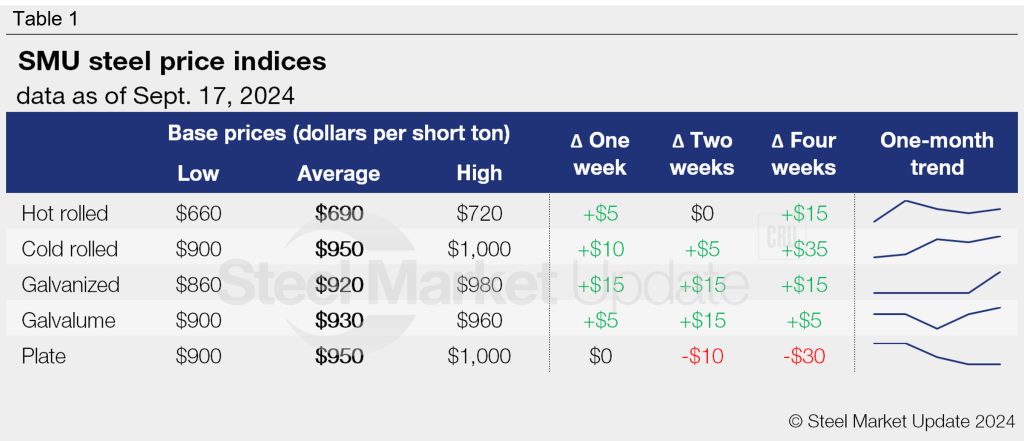
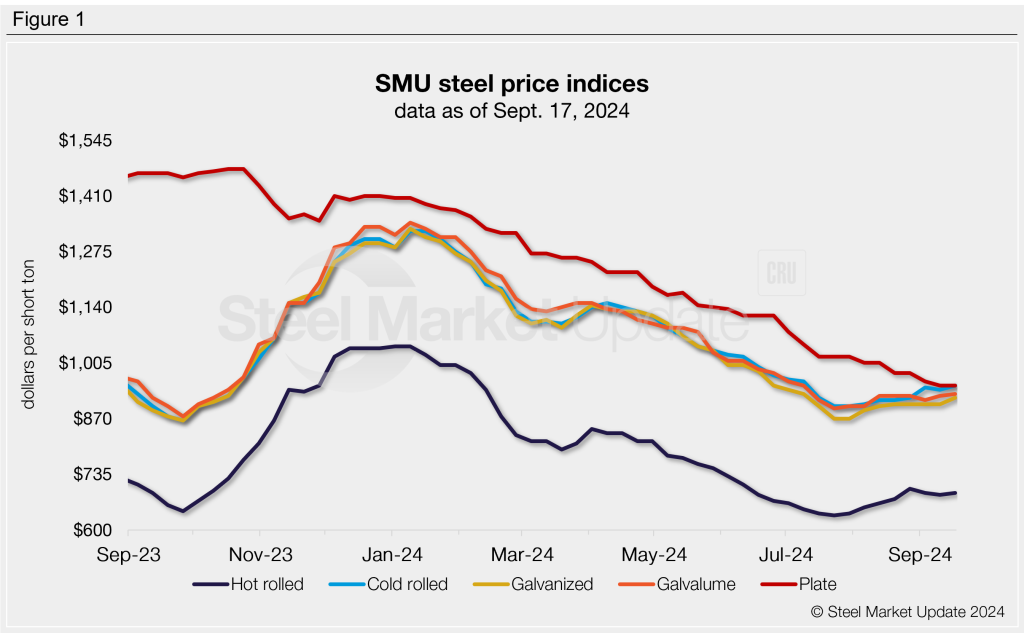
SMU’s plate price index was unchanged this week, while our sheet indices crept higher.
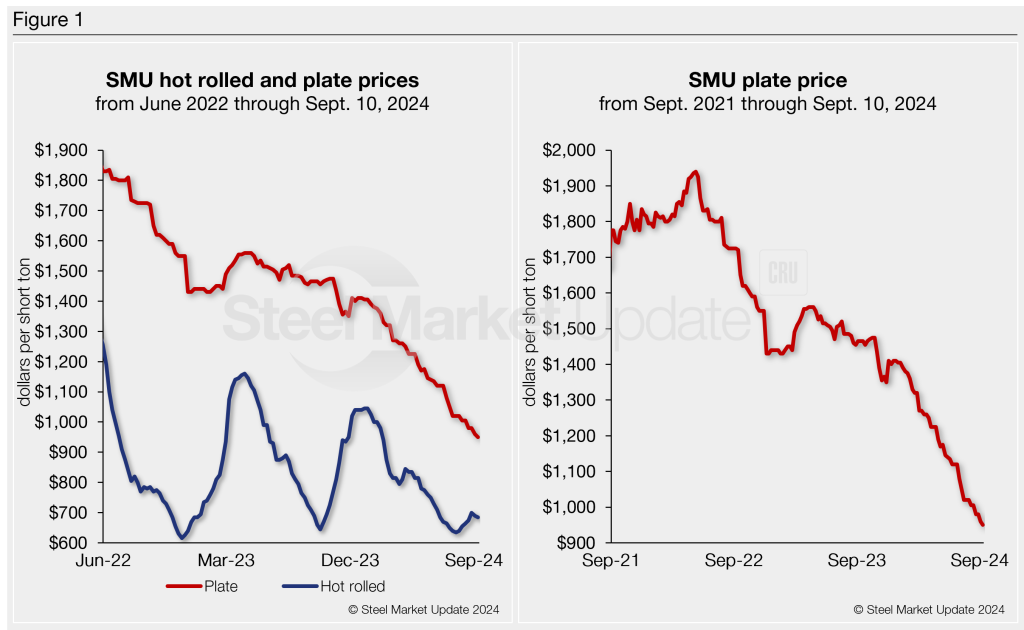
Hot-rolled steel prices increased by $5 per short ton (st) to an average of $690/st this week, following two weeks of marginal declines. HR prices are back in line with levels of a month ago.
Average cold-rolled steel prices rose $10/st week over week (w/w) to the highest level since early July at $950/st.
Our coated product indices hit 10-week highs this week. Our base galvanized index, at $920/st, showed a $15/st jump both w/w and from a month earlier. Galvalume base prices ticked up by $5/st w/w to $930/st, also $5/st higher than levels a month ago.
Our plate index was unchanged this week at $950/st. Plate prices have fallen $30/st over the last month and have overall trended downward over the last 10 months.
SMU’s sheet price momentum indicator remains at neutral following our Sept. 10 adjustment. Our plate price momentum indicator remains at lower.
Hot-rolled coil
The SMU price range this week is $660-720/st, averaging $690/st FOB mill, east of the Rockies. The lower end of our range is up $10/st w/w, while the top end is unchanged. Our overall average is up $5/st. Our price momentum indicator for hot rolled steel remains at neutral, meaning we see no clear direction for prices over the next 30 days.
Hot rolled lead times range from 3-7 weeks, averaging 4.9 weeks as of our Sept. 11 market survey.
Cold-rolled coil
The SMU price range is $900–1,000/st, averaging $950/st FOB mill, east of the Rockies. The lower end of our range is unchanged w/w, while the top end is up $20/st. Our overall average is up $10/st. Our price momentum indicator for cold-rolled steel remains at neutral, meaning we see no clear direction for prices over the next 30 days.
Cold rolled lead times range from 5-8 weeks, averaging 6.7 weeks through our latest survey.
Galvanized coil
The SMU price range is $860–980/st, averaging $920/st FOB mill, east of the Rockies. The lower end of our range is $10/st higher w/w, while the top end is up $20/st. Our overall average is up $15/st. Our price momentum indicator for galvanized sheet remains at neutral, meaning we see no clear direction for prices over the next 30 days.
Galvanized .060” G90 benchmark: SMU price range is $957–1,077/st, averaging $1,017/st FOB mill, east of the Rockies.
Galvanized lead times range from 6-8 weeks, averaging 7.2 weeks through our latest survey.
Galvalume coil
The SMU price range is $900–960/st, averaging $930/st FOB mill, east of the Rockies. The lower end of our range is up $20/st w/w, while the top end is down $10/st. Our overall average is up $5/st. Our price momentum indicator for Galvalume sheet remains at neutral, meaning we see no clear direction for prices over the next 30 days.
Galvalume .0142” AZ50, grade 80 benchmark: SMU price range is $1,194–1,254/st, averaging $1,224/st FOB mill, east of the Rockies.
Galvalume lead times range from 6-9 weeks, averaging 7.3 weeks through our latest survey.
Plate
The SMU price range is $900–1,000/st, averaging $950/st FOB mill. Our range is unchanged from last week. Our price momentum indicator for plate remains at lower, meaning we expect prices to decline over the next 30 days.
Plate lead times range from 2-6 weeks, averaging 3.9 weeks through our latest survey.
SMU note: Above is a graphic showing our hot rolled, cold rolled, galvanized, Galvalume, and plate price history. This data is also available here on our website with our interactive pricing tool. If you need help navigating the website or need to know your login information, contact us at info@steelmarketupdate.com.
Cleveland-Cliffs Inc. on Monday reiterated its commitment to a major decarbonization project at its Middletown Works in Ohio, despite an earlier report suggesting otherwise.
Recall that the Department of Energy selected Cliffs earlier this year to move forward with negotiations for grant monies meant to promote decarbonization in heavy industry.
The grant could provide Cliffs with up to $500 million to partially fund its plans to replace the No.3 blast furnace at Middletown with a direct-reduced iron (DRI) plant and two electric melting furnaces (EMFs).
Cliffs said it and the DOE are engaged in “active negotiations” over the project’s terms and conditions.
On Monday, Chairman, President, and CEO Lourenco Goncalves said the company continues moving forward with “award negotiations and project execution on the transformational Middletown project.”
Cliffs plans to fund its portion of $1.3 billion in total outlays for the Middletown project “using liquidity on hand and it’s own free cash flow generation.”
The Cleveland-based steelmaker anticipates the project will reduce Middletown’s production costs by ~$150 per short ton of liquid steel, generating annual cost savings of $450 million.
“These savings do not consider any of the premiums expected to be generated from sales of low-carbon steel, such as Cliffs H2 and Cliffs HMAX,” the company noted.
Last year, Cliffs introduced a “Cliffs H” surcharge of $40/short ton. The prime steel product is produced using high percentages of scrap in the BOFs and hot-briquetted iron (HBI) in the blast furnace burdens.
Additionally, Cliffs plans to implement a ‘Cliffs H2’ surcharge once it begins using hydrogen as a BF reductant “in the coming years,” a company spokeswoman previously told SMU.
The question of achieving a green steel premium
Cliffs’ reiteration of its commitment to the Middletown project came after Goncalves made comments that Cliffs was considering turning down the $500-million grant.
Goncalves told Politico in an interview published on Friday, Sept. 13, that the company hasn’t been able to persuade customers to pay higher prices for greener steel.
Even with the DOE grant, Cliffs would “still have to pony up $1.1 billion” for the project, the CEO told Politico. “I’m not going to do it if the government and the general public are not really supportive of that.”
He told Politico that one of two things will happen: Customers will change their minds and pay the premium. (But that’s been, “So far, not very successful.”) Or Cliffs will go back to emitting more carbon.
Cliffs declined to comment on this story.
Note on funding
Last week, Cliffs proclaimed the successful amendment of a $4.75-billion asset-based lending facility, which matures in 2028. According to Cliffs, it had no borrowings against it as of Friday’s announcement.
Goncalves also mentioned that the company’s capital request in the ABL amendment “was three times over-subscribed, showing continued strong support from our banking partners.”
Triple-S Steel Holdings has acquired West Coast steel products distributor Borrmann Metals Co.
The deal includes Borrmann Metals’ assets in Burbank and Riverside, Calif., and in the Phoenix area. The company was previously a subsidiary of Contractors Steel Co.
Further terms were not disclosed.
“We are excited to welcome the Borrmann business into the Triple-S family,” said Gary Stein, CEO of Triple-S.
Stein said Borrmann’s location and services are “highly complementary” to Triple-S Steel’s Intsel Steel West and Maas-Hansen businesses.
“We will put the needed investment in equipment, inventory, and technology into the operations to take advantage of these opportunities we see in the West,” he added.
A West Coast steel distributor, Borrmann Metals stocks plate, pipe and tube, merchant bar, and non-ferrous products.
Houston-based Triple-S Steel is a privately owned steel service center with more than 60 locations in the US, Canada, and Colombia.
Sheppard Mullin served as legal advisor, and Montrose Advisors served as financial advisor to Triple-S in this transaction.
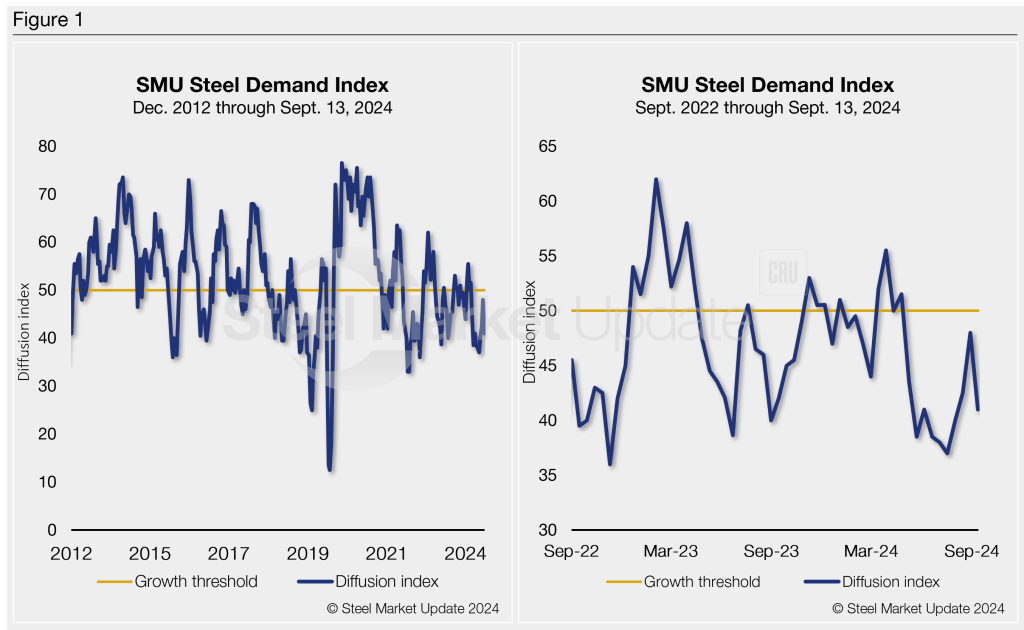
Steel Market Update’s Steel Demand Index ticked back seven points last week, falling further into contraction territory.
The Steel Demand Index, compiled from our weekly survey data, now stands at 41, down from 48 at the end of August. The decrease puts the index back to one of the lowest readings of 2024.
The index – down 14.5 points from a recent high of 55.5 in March – keeps signaling lower demand. Prices and lead times also struggle to find higher footing even as mills publish higher tags.
Methodology
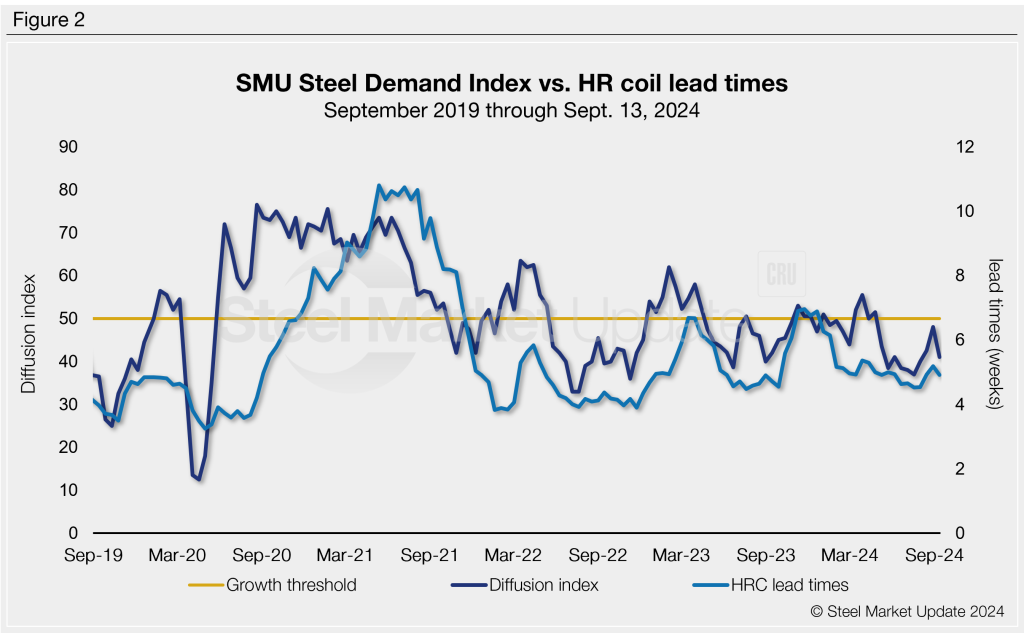
Derived from the market surveys SMU conducts every two weeks, the index compares lead times and demand to create a diffusion index. This index has historically preceded lead times, which is notable given that lead times are often seen as a leading indicator of steel price moves. An index score above 50 indicates rising demand, and a score below 50 suggests declining demand.
Figure 1 shows the nearly 12-year history of the index on the left and provides a closer look at the Steel Demand Index readings of the past two years on the right.
State of play
Falling prices and slumping demand turned the index into contraction in mid-April. Despite some short-lived momentum from mill price hikes, the index hasn’t moved out of contraction territory since. Overall, the flat-rolled steel market is still struggling to find its footing. While mills push for higher prices, buyers remain cautious, concerned about bloated inventories and weak end-market demand.
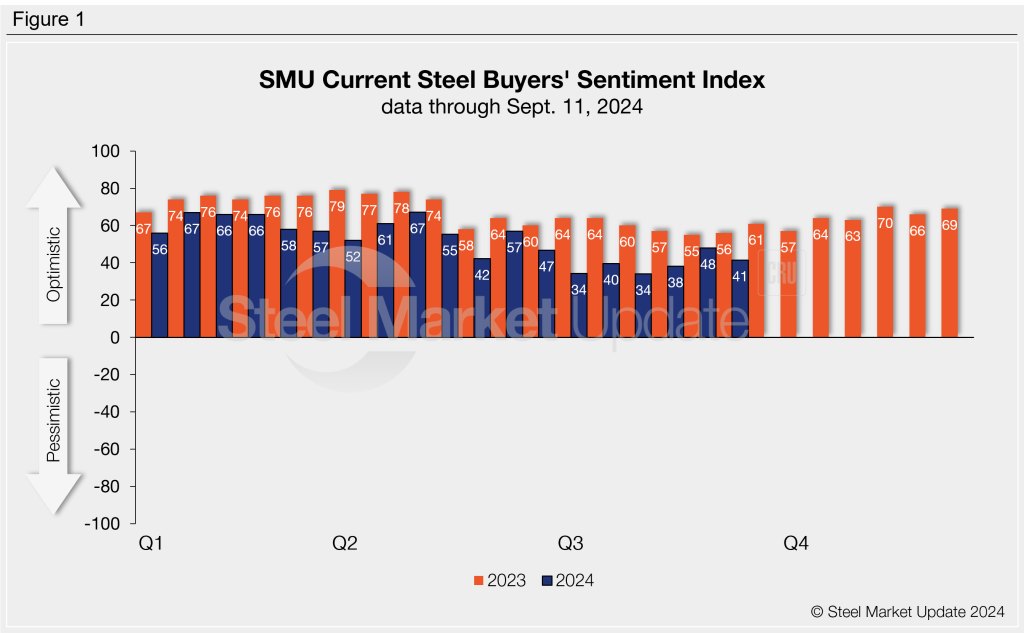
Sheet buyers continue to find mills willing to talk price, though not as aggressively as a month ago. SMU’s Current Buyers’ Sentiment edged back down to six points shy of the lowest marks so far this year. Two separate July readings of 34 were the lowest the index has been since August 2020.
Lead times have also ticked back down to just below the 5-week mark at 4.91 weeks on average. Hot-rolled (HR) coil prices have seen a similar trend, with prices easing by $5 per short ton (st) last week to an average of $685/st. HR prices are still $20/st higher than a month ago despite the recent declines.
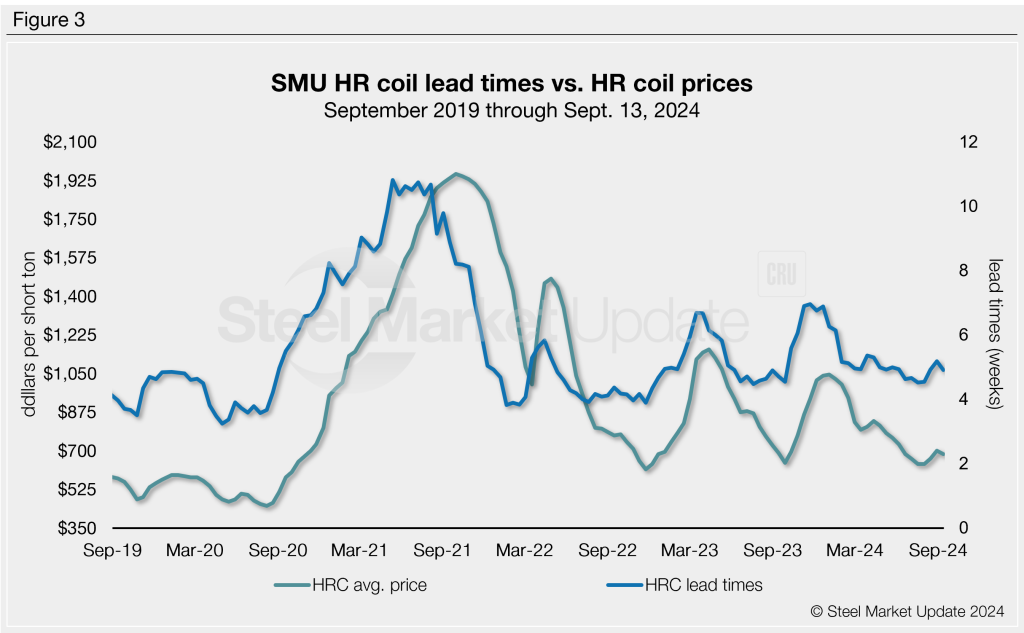
For nearly a decade, SMU’s demand diffusion index has preceded moves in steel mill lead times (Figure 2), and SMU’s lead times have also been a leading indicator of flat-rolled steel prices, particularly for HRC (Figure 3).
What to watch for
Despite the lower reading, 69% of our survey respondents still report stable or improving demand. That’s something to keep an eye on as we move into Q4. Still, 31% report declining demand, and that’s up from 23% in late August.
US mills continue to push for higher prices. Nucor held its CSP at $720/st this week after incrementally pushing prices $30/st higher over the past month.
Cliffs has done similarly, increasing its September price by $30/st and targeting $750/st. The latest increase comes after the Cleveland-based steelmaker reportedly placed its C-6 blast furnace at Cleveland Works on hot idle until demand improves.
The index has reached growth territory only a handful of times since late April 2023. All those gains were short-lived bumps when the market responded to mill price hikes.
Time will tell if the latest round of mill price increases will help rally the market or if SMU’s Steel Demand Index will continue to bump around in contraction territory as we move into the last quarter of 2024.
Note: Demand, lead times, and prices are based on the average data from manufacturers and steel service centers participating in SMU’s market trends analysis surveys. Our demand and lead times do not predict prices but are leading indicators of overall market dynamics and potential pricing dynamics. Look to your mill rep for actual lead times and prices.
Nucor blamed lower steel prices for its expectations of weaker third-quarter results.
In guidance released Tuesday, Nucor said it anticipates reporting Q3 earnings between $0.87 and $0.97 per diluted share. That’s down notably from $2.68/diluted share in the previous quarter and from $4.57/diluted share in Q3’23.
In its Q2 earnings report in July, Nucor warned that Q3 profits would decline again due to weaker results from its steel mills. The Charlotte, N.C.-based manufacturer now expects lower earnings across all its segments – steel mills, steel products, and raw materials.
It noted that the primary driver of the sequentially lower results “is the decreased earnings of the steel mills segment, due primarily to lower average selling prices.”
Additionally, it anticipates reporting lower quarterly volumes in the steel products segment.
Nucor mentioned an expected Q3 impairment charge of ~$123 million, or $0.43 per diluted share, related to “certain non-current assets in the raw materials and steel products segments.”
The steelmaker will release Q3 results after the markets close on Monday, Oct. 21, and an earnings conference call on Tuesday, Oct. 22 at 10 a.m. ET.
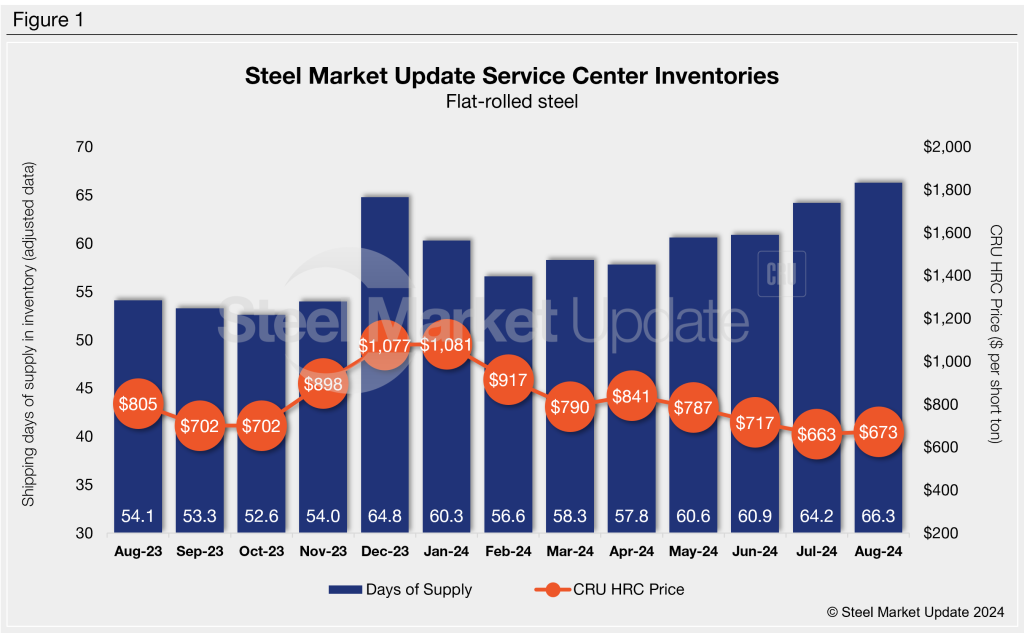
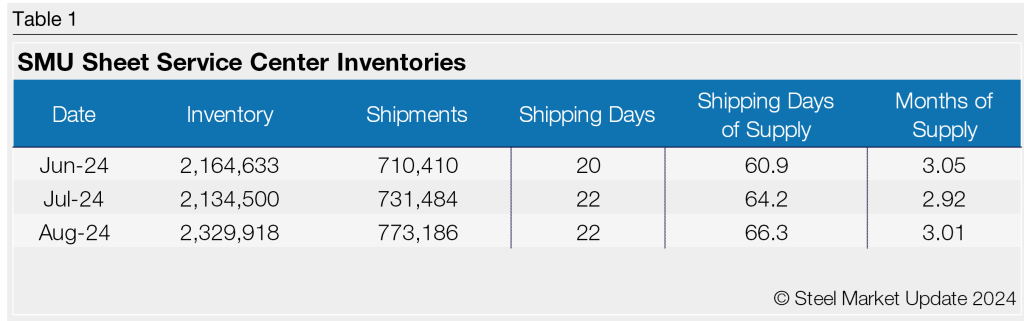
Flat rolled = 66.3 shipping days of supply
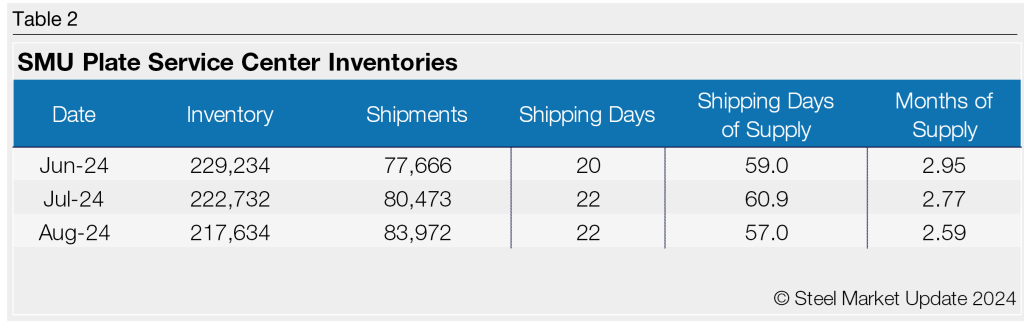
Plate = 57.0 shipping days of supply
Flat rolled
Flat-rolled steel supply at US service centers grew further in August. The dynamic resulted from some Q3 restocking efforts at a perceived market bottom, met with shorter lead times and weaker demand. At the end of August, service centers carried 66.3 shipping days of supply on an adjusted basis, according to SMU data.
This is up from 64.2 shipping days of supply in July and 54.1 shipping days in August 2023. It is also the highest total since May 2020, when shipping days of supply reached 67.6 as Covid-19 battered the market.
Flat-rolled steel supply in August represented 3.0 months of supply, up from 2.9 months in July. August had 22 shipping days, mirroring July’s total. Sheet steel shipments typically hit a lull in July. The drop-off in shipments was more pronounced this year, and the trend appears to have continued in August.
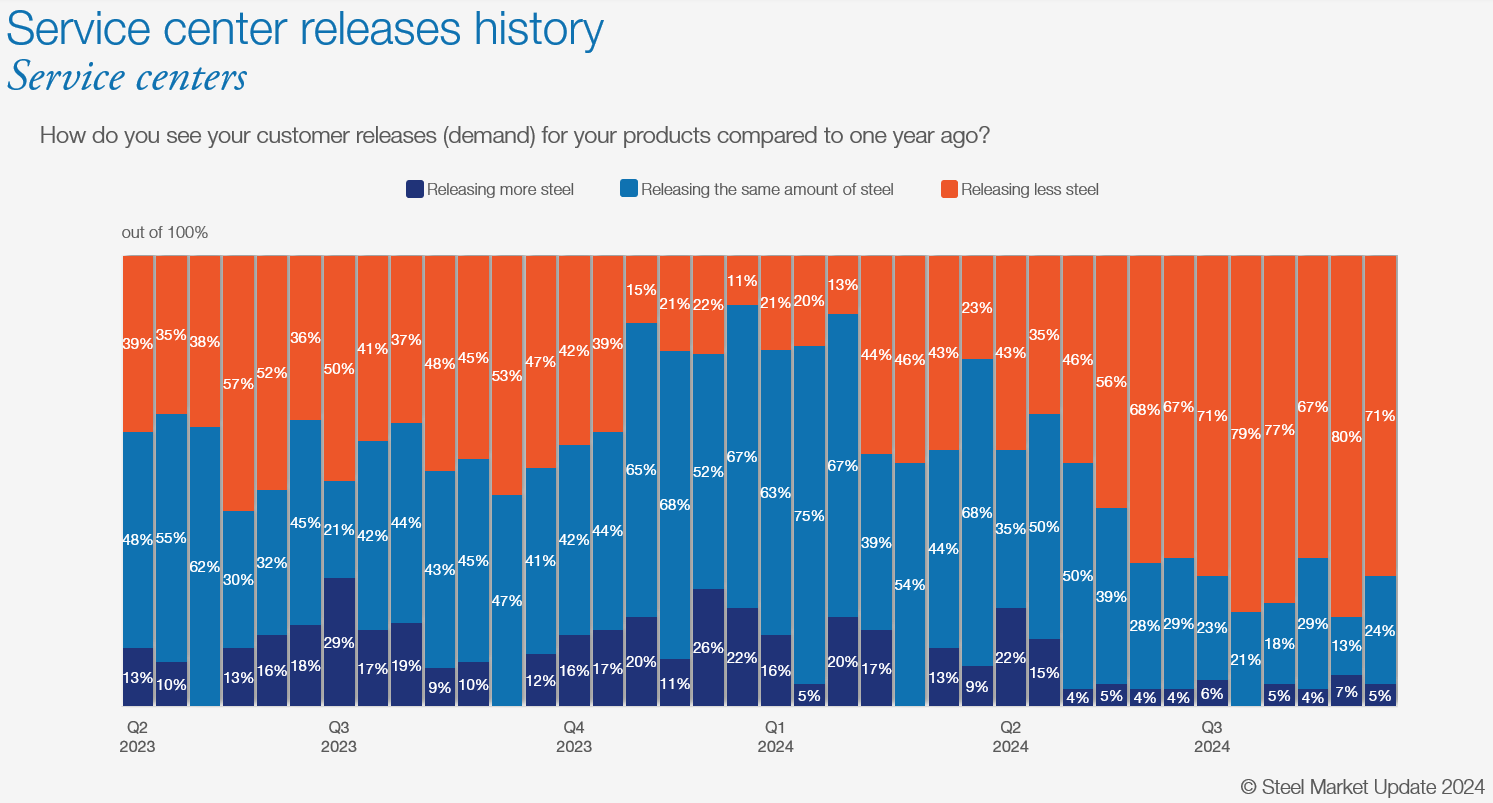
The SMU survey with data through Aug. 28 reported that 80% of service centers said they were releasing less steel compared to a year ago, while 13% said they were releasing the same amount, and just 7% said they were releasing more steel.
Flat-rolled steel prices edged up some in August but have been largely stable, seeing just moderate gains over the past four weeks. Mills have been publicizing higher prices but lead times have been slow to react. The Aug. 28 SMU survey pegged hot-rolled coil lead times at 5.19 weeks, up from 4.9 weeks two weeks earlier and from 4.54 weeks on July 31.
Similarly, the SMU survey also found that 8% of service centers described mill lead times for new orders as “extremely short” and 36% said lead times were “shorter than normal.” Still, another 50% saw them as “normal.” Service center inventories ballooned at the end of July, with little relief in August.
The perception that prices were at or near the bottom at the end of July drove many service centers to buy heavily toward the end of the month. Because of the spike in flat-rolled steel on order and the lackluster demand outlook, inventories increased further in August. Even with the slew of planned mill outages in September and October, the market seems to be oversupplied relative to demand.
Plate
US service center plate supply ticked down in August due to tighter buying patterns on sluggish demand. At the end of August, service centers carried 57.0 shipping days of plate supply on an adjusted basis, down from 60.9 shipping days of supply for July. Plate inventories represented 2.6 months of supply in August, down from 2.8 months of supply in July. In August 2023, service centers carried 61.2 shipping days of plate supply, representing 2.66 months of supply.
Plate mill lead times are much shorter this year; however, nearly half what they were a year ago. The SMU survey from Aug. 28 found plate mill lead times at 3.93 weeks, flat from a month prior. The survey a year ago reported plate mill lead times at 5.25 weeks. Ramped-up capacity this year and weaker-than-expected demand have kept the US plate market oversupplied.
With prices falling and weak demand, service centers have been trying to destock for months. There has been little incentive to restock, though, with lead times being so short. As a result, material on order remains extremely low for plate.
While inventories appear more than sufficient to meet immediate demand, the lower material on order could suggest a further drop in inventories in September.
Keep in mind that plate on-order was down 3.8% m/m and 28.1% y/y in August. Inventories were down 6.4% vs. August 2023. So, while the daily shipping rate was 4.3% higher m/m, it was 5.3% lower year to date and 0.5% lower than August 2023.
This, combined with SSAB’s pulled-forward outage, could allow plate price decreases to reach a bottom. However, this could also cause supplies to tighten quickly if service center shipments pick up in the slightest, especially with SSAB’s outage, as inventories and material on order are down from normal levels.
Cleveland-Cliffs aims to increase hot-rolled (HR) coil prices to $750 per short ton (st), effective immediately.
The move represents a $20/st price hike compared to the Cleveland-based steelmaker’s last published price of $730/st.
Cliffs said the increase was necessary “due to ongoing market conditions” in a letter to customers on Tuesday. It added that the higher price was valid for all new spot inquiries.
Cliffs’ new HR price is also $30/st higher than that of competitor Nucor. The Charlotte, N.C.-based EAF steelmaker kept its published HR price unchanged at $720/st this week.
Of the four major flat-rolled steelmakers, Cliffs and Nucor are the two that regularly disclose prices. Steel Dynamics Inc. (SDI) does not typically announce price moves. U.S. Steel has not publicly announced increases since it disclosed its planned acquisition by Nippon Steel last December.
Steel Dynamics Inc. (SDI) expects lower third-quarter earnings on the heels of “meaningfully lower” prices at its flat-rolled steel operations.
The Fort Wayne, Ind.-based steelmaker expects Q3’24 earnings of $1.94 to $1.98 per diluted share, according to figures released on Monday. That’s down from $2.72 per share in Q2’24 and $3.47 per share in Q3’23.
The drop in realized prices in Q3 partly stems from 80% of SDI’s flat-rolled steel business being contract-based. Recall that contract pricing lags spot prices.
What does that mean in practice? Spot prices for hot-rolled (HR) coil bottomed in the low $600s per ton in Q2, according to SMU’s pricing records. Those lower spot prices in Q2 then pulled down contract prices in Q3.
However, SDI suggested that things could improve in Q4, given that flat-rolled steel prices have stabilized and improved in Q3. And “underlying demand remains steady,” the company added.
On the scrap side, SDI said Q3 results would probably be similar to those for Q2. That comes thanks to “steady” volumes offsetting “marginally lower” prices.
SDI expects a “slight decline” in prices for its fabricated products in Q3. Fabrication backlogs are “steady” and extend into the first quarter of 2025.
The company said its fabrication business could improve in 2025 on anticipated interest rate declines, government-supported infrastructure spending, and reshoring. Those trends should support not only fabricated products such as joists and decking but also flat-rolled and long steel products, it added.
SDI plans to release Q3 earnings after the close of markets on Wednesday, Oct. 16. Its earnings conference call will be on Oct. 17 at 11 a.m. ET. SMU will cover both.
Stelco shareholders voted overwhelmingly on Monday to OK the $2.5-billion sale of the Canadian flat-rolled steelmaker to Cleveland-Cliffs.
Indeed, 99.97% of those who cast ballots voted to approve the deal, according to the Hamilton, Ontario-based steelmaker.
Cleveland-based Cliffs said the shareholders’ approval meant the pact remained on track to close in the fourth quarter, pending other closing conditions.
“The overwhelming approval from Stelco shareholders confirms the strong support of this transaction,” Cliffs Chairman, President, and CEO Lourenco Goncalves said in a statement.
“Together with Stelco and the USW in Canada, Cliffs will become an even stronger and better North America-based steel producer, which will benefit both Canada and the United States,” he added.
Stelco is expected to continue as a wholly-owned subsidiary of Cliffs.
In July, Cliffs announced plans to acquire Stelco with the support of the United Steelworkers (USW) union.
Stelco CEO Alan Kestenbaum elaborated on the deal and his plans for the future during an exclusive interview with SMU’s David Schollaert last month at SMU’s Steel Summit in Atlanta.
Kestenbaum said he wasn’t looking to sell the business. But that it was the right thing to do for shareholders.
He also suggested that there might be new chapters to his career in steel: “I love this business, and why I’m going to continue to stay in it is exactly that – it’s identifying opportunities, coming up with a strategy, and executing.”
Raw steel production eased last week, but US mills continue operating at a healthy rate, according to the latest report from the American Iron and Steel Institute (AISI).
Total raw steel output from domestic mills was estimated at 1,749,000 short tons (st) in the week ending Sept. 14. This was down by 23,000 st, or 1.3%, from the week prior.
Production last week was 1.5% higher than the year-to-date weekly average of 1,723,000 st.
Output was 1.0% greater than the same week a year ago when mills produced 1,742,000 st. Recall that production reached a multi-year high of 1,782,000 st in late August.
Last week’s mill capability utilization rate eased to 78.8%, down from 79.8% the previous week and from late August’s peak of 80.2%. At this time last year, the utilization rate was 74.4%.
Year-to-date production is up to 62,859,000 st, with a mill capability utilization rate of 76.8%. This is 1.7% below this time last year when mills had produced 63,943,000 st YTD with an average utilization rate of 76.9%.
Weekly production by region is shown below, with the week-over-week changes noted in parentheses:
Northeast – 127,000 st (down 1,000 st)
Great Lakes – 597,000 st (up 1,000 st)
Midwest – 220,000 st (up 5,000 st)
South – 747,000 st (down 20,000 st)
West – 58,000 st (down 8,000 st)
Editor’s note: The raw steel production tonnage provided in this report is estimated and should be used primarily to assess production trends. AISI’s monthly “AIS 7” report is available by subscription and provides a more detailed summary of domestic steel production.
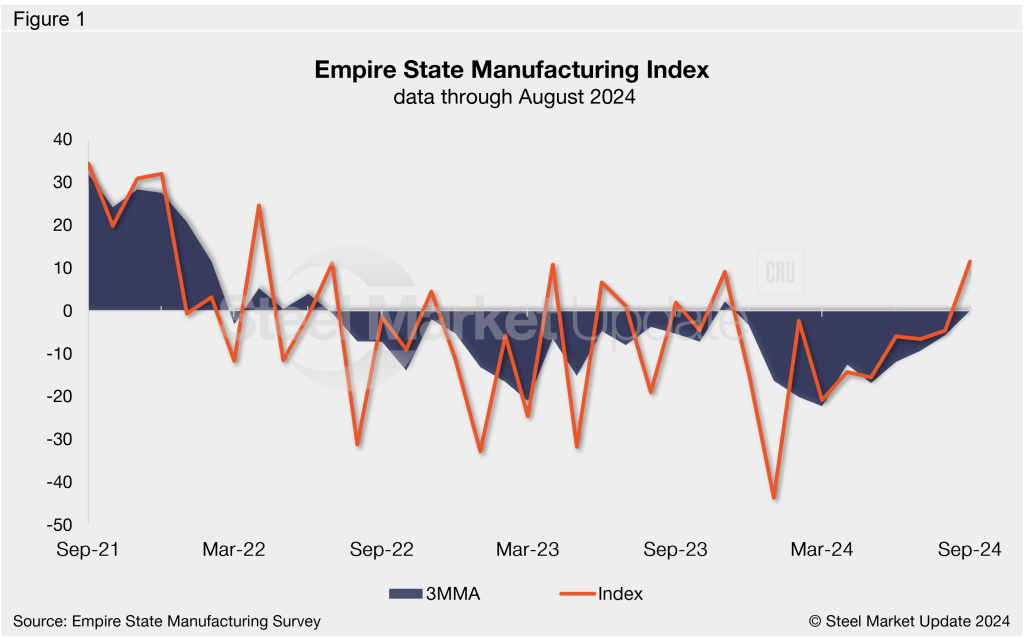
The state of New York saw a recovery in manufacturing activity in September, according to the latest Empire State Manufacturing Survey from the Federal Reserve Bank of New York. This marks the first growth month for the Empire State Manufacturing Index since November 2023.
The General Business Conditions Index rose 16 points from August to 11.5 in September, the highest reading recorded since April 2022. Firms remain mostly optimistic about future business conditions, with 45% of respondents expecting improvements in the next six months.
“New York State manufacturing activity in September grew for the first time in nearly a year, with shipments increasing strongly,” commented New York Fed economic research advisor Richard Deitz.
The majority of the survey’s current indicators improved from August to September. For the first time in months, the new orders index signaled growth. The shipments index surged to a multi-month high, while the inventories index flattened out at zero. The capital spending index eased to its first negative reading since 2020. The full release is available here.
The Empire State Manufacturing Index has only indicated improving business conditions in seven months over the last two years. This time last year, the index registered -19.0, the fourth lowest rate in 2023.
On a three-month moving average basis (3MMA) the index rose to 0.1 through September, now at a ten-month high and the first positive reading of the year (Figure 1). March’s reading of -22.3 was the fourth-lowest 3MMA figure within our 15-year data history, higher only than April, May, and June 2020.
An interactive history of the Empire State Manufacturing Index is available here on our website.
Nucor’s weekly consumer spot price (CSP) for hot-rolled (HR) coil is unchanged from last week.
The steelmaker said in a letter to customers on Monday that its HR coil base price will be $720 per short ton (st). That’s steady vs. last week when Nucor bumped tags up $10/st from the previous week.
The HR coil base price at Nucor’s majority-owned subsidiary CSI is also flat from last week at $780/st.
Nucor said it will continue to offer lead times of 3-5 weeks but noted that customers should contact their district sales manager for availability.
SMU’s Sept. 10 check of the market pegged HR coil spot prices in the range of $650-720/st, with an average of $685/st. The average fell $5/st from the previous week.
We got a little flack for adjusting our sheet momentum indicators to neutral last week. To be clear, we didn’t adjust them to lower. Part of the reason we moved them to neutral was because there are some unusual cross-currents in the current market.
On the news side, you could make a case that there should nowhere to go but up.
US mills continue to push to increase prices (Nucor publicly so), even if it’s incrementally compared to the triple-digit price hikes we’ve seen at times over the last three years.
And a wide-ranging trade case against imports of coated sheet could have broad repercussions as more traders and overseas mills stop offering into the US market. (And as some US customers pivot toward domestic sources.)
Coated case update
SMU’s Laura Miller has a good summary of the potential market impact and of key dates in the case here. As she notes, the next important date is Wednesday, Sept. 25. That’s when US Department of Commerce will decide whether to move forward with the case.
Here two more date that merit repeating:
“If claims of critical circumstances are verified, duties can be applied retroactively 90 days. That means the CPB could begin collecting CVDs on CORE material that entered the country as early as Aug. 31, and ADs as early as mid-November.”
You can see why some companies have already hit the pause button on imports of galvanized, Galvalume, and aluminized from certain countries targeted in the case.
It’s also worth noting that while several domestic mills are participating in the case, they’re not all on the same page. Nucor, for example, did not join the petition against Mexico – where it operates a sizeable coating joint venture with the Japanese steelmaker JFE.
And U.S. Steel, Wheeling-Nippon and the United Steelworkers (USW) union are sitting out the portion of the case against Canada. As Miller notes, the USW has 225,000 members in Canada.
Survey says
So why didn’t we keep our sheet momentum indicators pointed toward higher? At risk of stating the obvious, blast furnaces aren’t typically idled indefinitely when demand is great. And we hear from many of you that demand is anything but great.
We see that reflected in our survey data as well. Buyer sentiment has slipped following a Steel Summit bounce in late August. And it remains well below year-ago levels. Sheet lead times, meanwhile, have dipped lately. Also, most steel buyers say that mills – despite the coated trade case, price increases, and the Cliffs idling – remain willing to negotiate lower prices.
You can see why that’s the case if you dive a little deeper into the results.
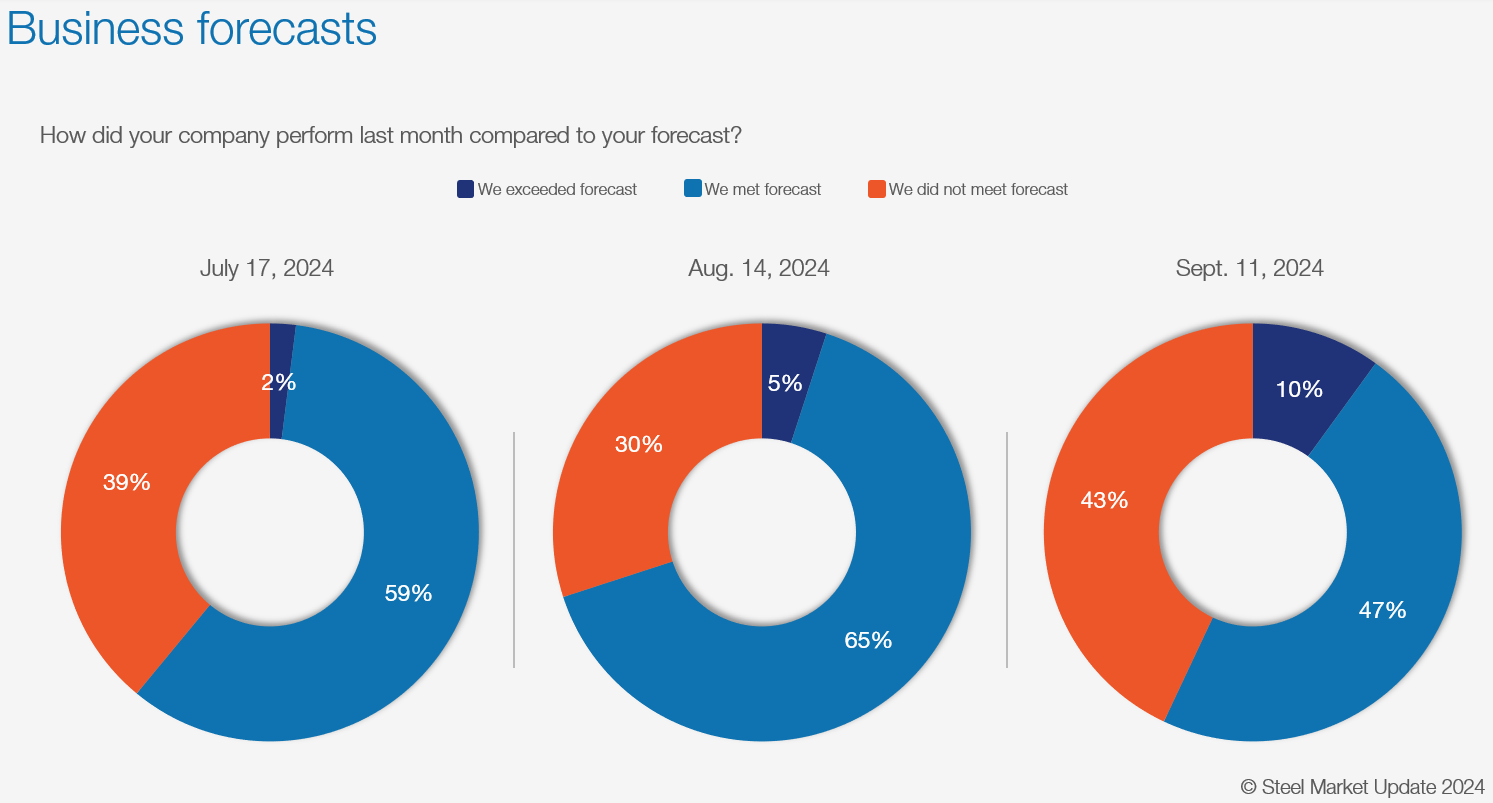
For starters, nearly 45% of survey respondents tell us that they did not meet forecast last month. That’s the highest reading we’ve had on that question since we started asking it a few years years ago.
Here is what some respondents had to say on the matter:
“Slightly down, but seasonally predictable.”
“Mixed bag, some locales exceeded forecast others did not.”
“Most customers are fairly flat.”
“Some softness in automotive and spot.”
“Nobody is meeting their forecast in 2024 – this year sucks.”
Also, most service center respondents say that they’re releasing less steel than a year ago.
We haven’t seen a sustained period of approximately 70-80% saying they’re releasing less steel year over year since the spring of 2020.
I don’t want to go too far down the rabbit hole with comparisons to spring 2020. But we saw something similar when it comes to service centers’ sheet inventories for July. I’m curious to see whether that will remain the case when we release sheet inventories for August this week to our premium subscribers. (If you’d like to upgrade from executive to premium, please contact our account executive, Luis Corona, at luis.corona@crugroup.com.)
Given all that, why didn’t we take the more radical step of adjusting our momentum indicators to lower?
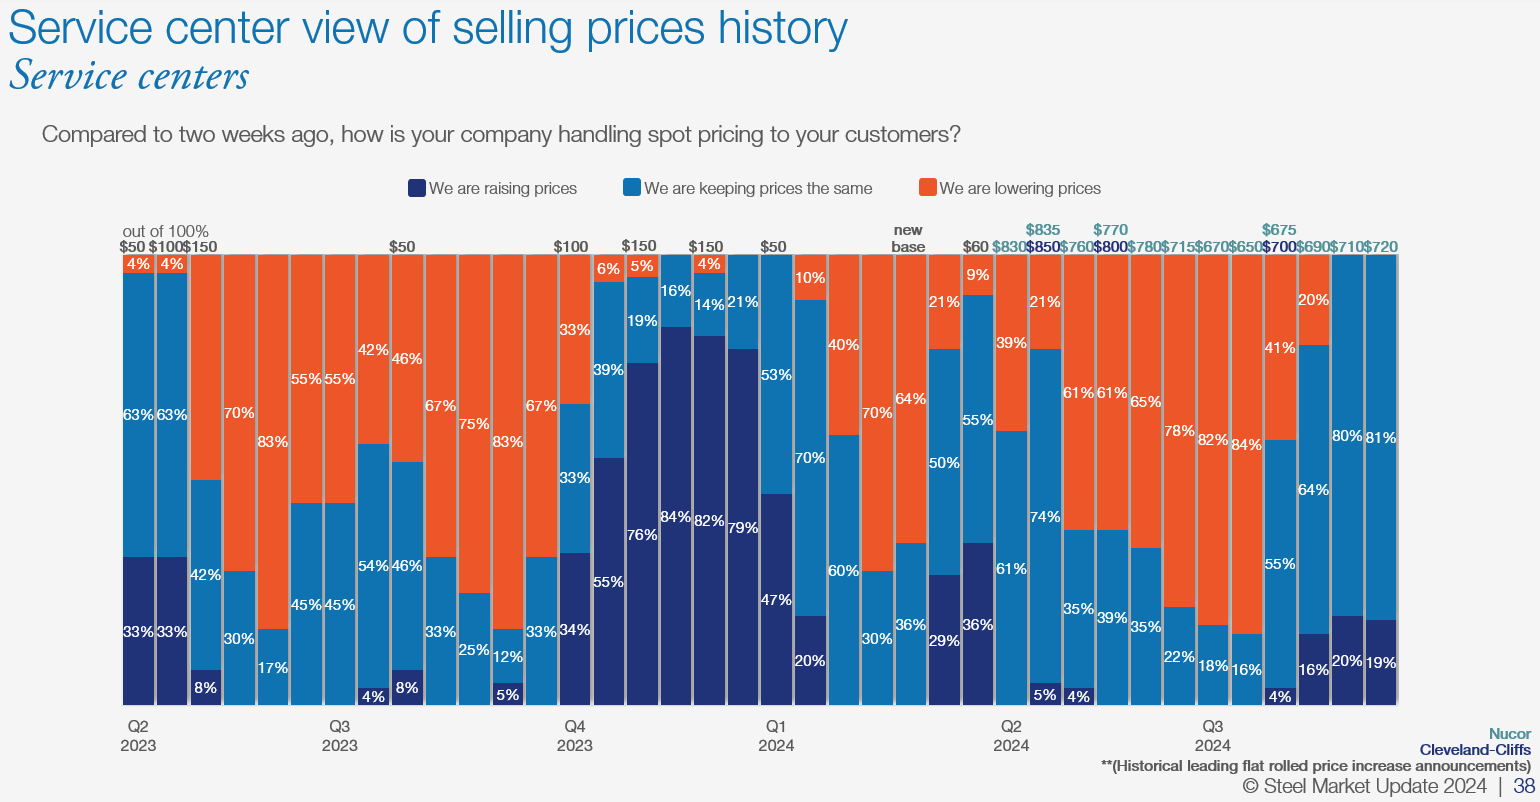
For one, most service centers are at least holding the line on prices. Some are trying to increase them. And none tell us that they are cutting prices.
That’s a massive change from July and early August when approximately 80-85% of centers said they were cutting prices. Not surprisingly, the shift occurred when mills stopped lowering prices.
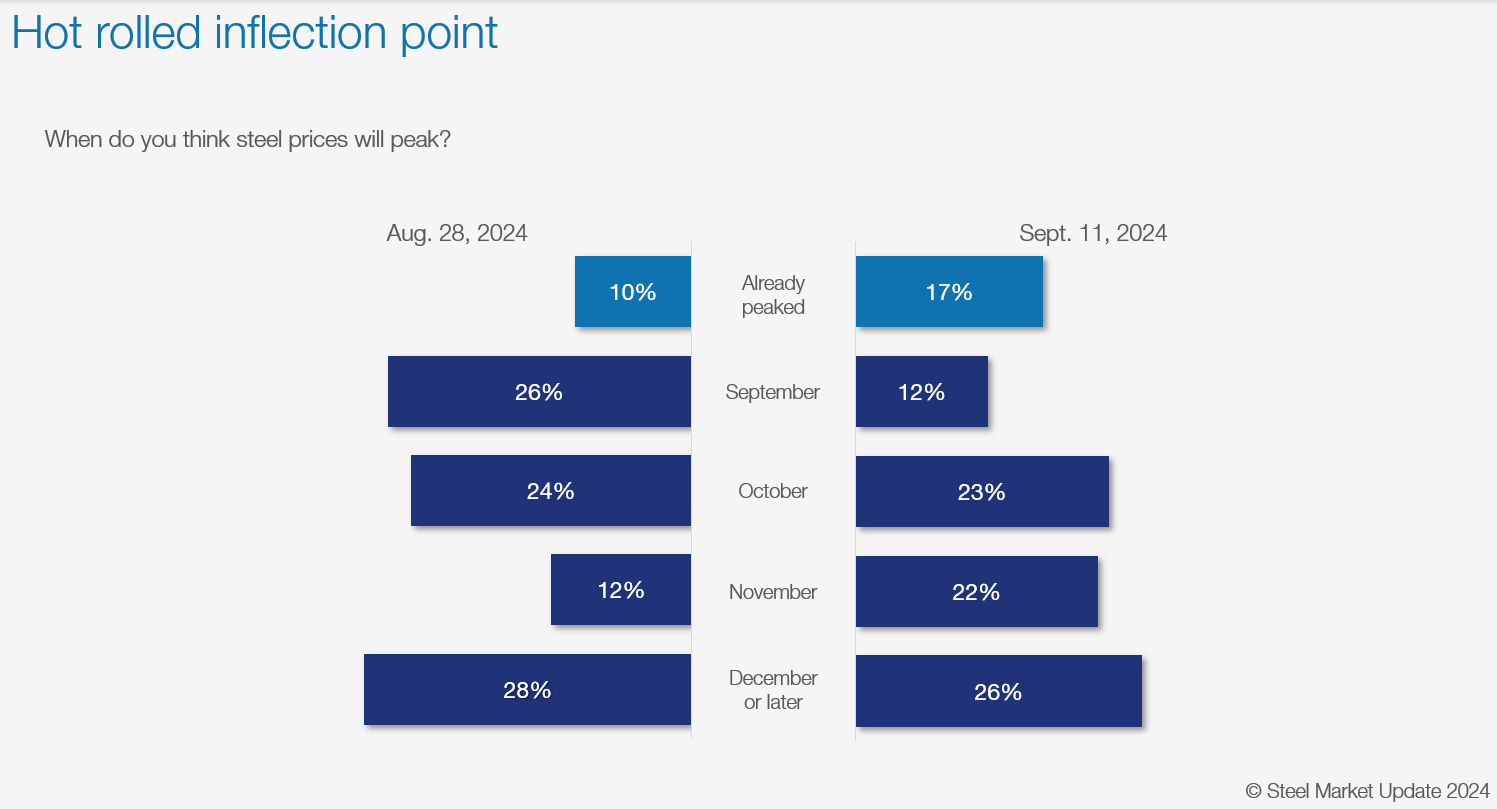
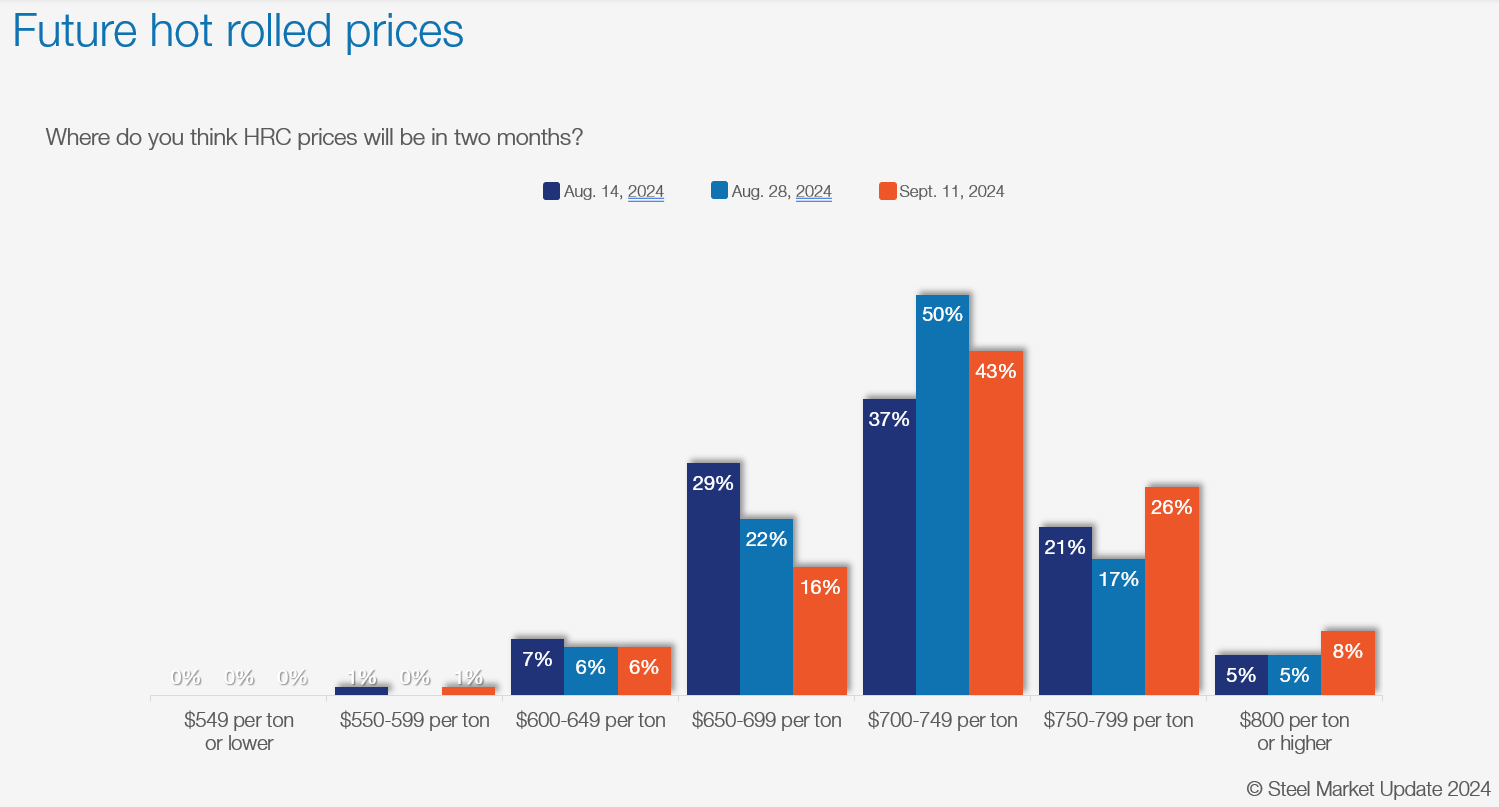
Also, most survey respondents tell us that prices haven’t peaked yet. In fact, only 17% say they have.
That said, most see prices hot-rolled (HR) coil prices rising into the $700s per short ton (st) over the next two months – not much higher than where we are now. Only 8% see HR going to $800/st or higher by mid-November.
Here is what some survey respondents had to say on the question of future HR prices:
“Small upward trend due to outages taking our 1 million tons of steel from the supply side.”
“Soft demand for flat rolled even with outages. Up but not too much.”
“Protectionism by domestic mills will keep prices up. Higher raw material costs too.”
“Mills are getting aggressive with their increase announcements and need to be in the $700s.”
“No real, strong drivers either direction. Mills setting the bottom.”
“If demand was better, it would go higher.”
“Very soft demand, but mills showing some discipline (for now).”
“We are obviously bearish on this ‘rally.’ We just still see poor-to-Ok demand and plenty of capacity out there (even with the mill outages).”
“Maybe lower. Weak demand and mills unwilling to take down any capacity.”
“Indirect effect of the trade cases and slight improvement in the market in general.”
Another date to watch
Reuters reports that the Committee on Foreign Investment in the United States (CFIUS) has until Monday, Sept. 23, to decide whether the nearly $15 billion acquisition of U.S. Steel by Japan’s Nippon Steel poses a national security threat.
If the committee decides there is a threat to US interests, then the White House could block the deal. As Ethan Bernard noted last week, we at SMU don’t pretend to know how that process might unfold.
Especially in an election season, it’s hard to tell which developments are significant and which might be floating potential outcomes to test public reaction.
SMU Community Chat and Hedging 101
Our next Community Chat will be on Wednesday, Sept. 18, at 11 am with Steel Warehouse Chief Commercial Officer Marc Lerman. You can register here.
We’re excited to start off our fall series of webinars. We’re hoping you’re looking forward to it to. Don’t forget to bring a good question or two to the discussion.
Also, it’s not too late to register for our one-day Hedging 101 workshop on Sept. 25 in Chicago. It’s a small group – about 25-30 people so far – so you’ll have plenty of time to ask questions in a more intimate, classroom environment. You can learn more and register here.
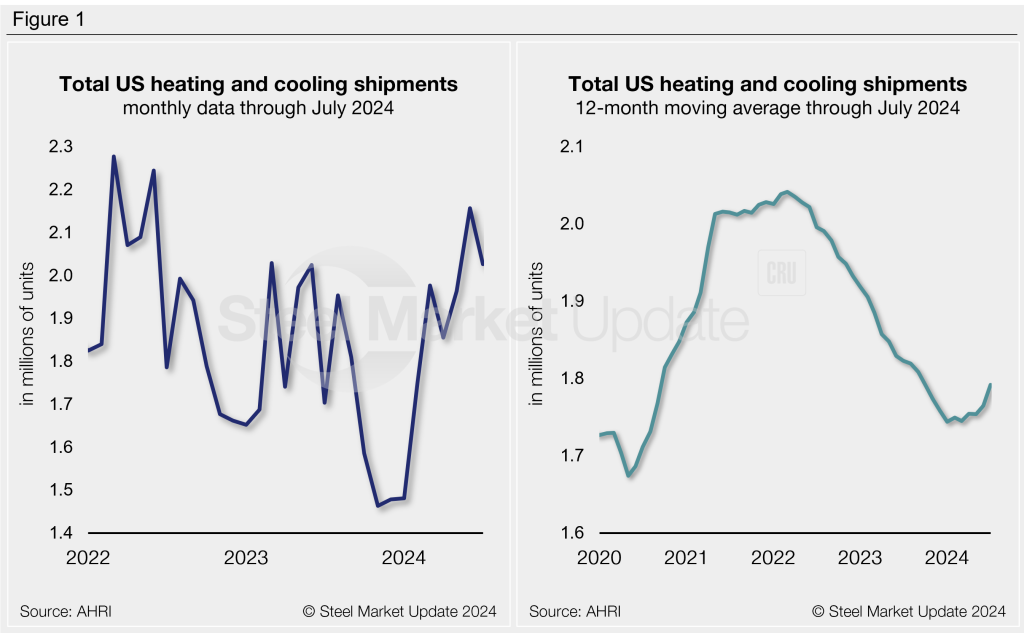
Shipments of heating and cooling equipment remained near multi-year highs in July, according to the latest data released from the Air-Conditioning, Heating, and Refrigeration Institute (AHRI).
Total July shipments eased 6% month on month (m/m) to 2.03 million units. Shipments are 19% greater than the same month one year prior. July represents the second-highest monthly shipment rate recorded in the last 16 months, just below June’s peak of 2.16 million units.
On an annualized 12-month moving average (12MMA) basis, shipments have begun to tick higher across the last few months. This follows a significant decline from mid-2022 through the start of this year, following the post-Covid surge. The latest 12MMA for total shipments is 1.79 million units through July, 2% lower than the same period last year.
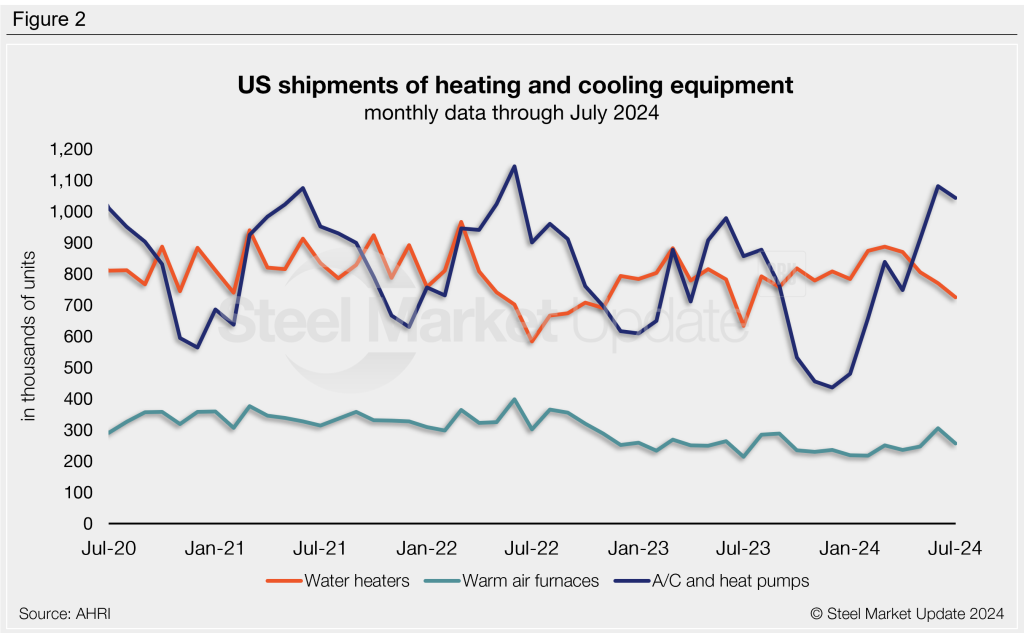
July shipments of residential and commercial storage water heaters fell 6% m/m, now down to a one-year low of 726,000 units. (Recall that we saw a two-year high of 887,000 units in March). July shipments are 15% higher than levels seen one year ago. Total monthly water heater shipments have averaged 806,000 units over the past year.
Following the 20-month high rate seen in June, warm air furnace shipments declined 16% m/m to a combined 257,000 units in July. This is 20% higher than levels seen one year prior. Furnace shipments have averaged 250,000 units per month across the past year.
Shipments of central air conditioners and air-source heat pumps eased 3% m/m in July to a total of 1.04 million units. This follows a two-year high recorded the month prior of 1.08 million units. Note that air conditioner/heat pump shipments are very seasonal, with slowdowns experienced throughout the winter months as evident in Figure 2. Total air conditioner and heat pump shipments are 22% greater than the same month one year prior. Shipments have averaged 735,000 units per month across the past year.
The full press release of this data is available here on the AHRI website.
An interactive history of heating and cooling equipment shipment data is available here on our website. If you need assistance logging in to or navigating the website, please contact us at info@steelmarketupdate.com.
The only way to achieve net zero goals worldwide is to significantly reduce the greenhouse gas emissions of the global steel industry. And emissions standards can play a key role in encouraging (or discouraging) steel decarbonization. In that spirit, earlier this year, the Biden administration established a climate and trade task force, aimed at a promoting “a global trading system that slashes pollution, creates a fair and level playing field, protects against carbon dumping, {and} supports good manufacturing jobs and economic opportunity.”
These are ambitious and laudable goals. Across sectors, the United States has a significant carbon advantage over many of its economic competitors. This is certainly true in the steel industry, where American manufacturers are among the lowest emitting in the world. In other words, when it comes to steel, climate-focused trade policy can go hand-in-hand with US competitiveness.
However, as the Biden administration’s new task force evaluates potential carbon border measures, it remains an open question as to whether or not they will adopt a differentiated emissions standard that would actually encourage higher emissions and give up the US carbon advantage.
As Dr. Ali Hasanbeigi, the CEO of Global Efficiency Intelligence LLC, has shown in one recent analysis, there are not significant differences in emissions between many electric furnace producers (or between many blast furnace producers) worldwide. Rather, the principal reason behind the US carbon advantage is that a substantial majority of the steel made in the United States is produced in electric furnaces.
As we noted in a prior article in SMU, the emissions intensity of an electric furnace is roughly 70% lower than that of a blast furnace. And one recent study finds that, in the United States, the Scope 1-3 emissions intensity of hot-rolled products made in a blast furnace (2.40 MT CO2e) is more than double that of hot-rolled products made in an electric furnace (0.97 MT CO2e).
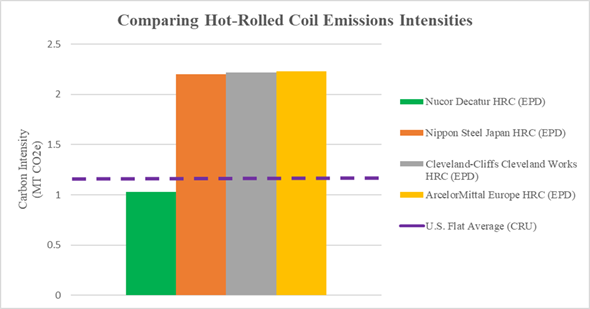
The environmental product declarations (EPDs) issued by some of the largest steel producers in the world highlight the faulty logic of differentiated emissions standards. Based on publicly issued EPDs, the emissions intensities for hot-rolled steel coil production are approximately twice as high for blast furnace facilities as for electric furnaces. For example, in the United States, Nucor’s mill in Decatur, Ala., (an electric furnace) produces hot-rolled coil at an intensity of 1.03 MT CO2e per ton of steel, whereas Cleveland-Cliffs’ Cleveland Works (a blast furnace) produces the same product at 2.22 MT CO2e. Similarly, Nippon Steel’s Japanese and ArcelorMittal’s European blast furnaces report hot-rolled coil emissions intensities of 2.20 MT CO2e and 2.23 MT CO2e, respectively, in their EPDs.
These data show that what drives emissions in the steel industry is the gap between scrap-based electric furnaces and ore-based blast furnaces. And differences among blast furnace producers worldwide are largely caused by their relative scrap use, not the carbon efficiency of their furnaces, according to CRU. It is also important to remember that very little flat production outside the United States is via scrap-based electric furnaces. Indeed, because US flat production is electric furnace focused, CRU has calculated an industry-wide emissions intensity of 1.2 MT CO2e for flat products in the United States, which is among the lowest in the world.
Further, many of the newest and most efficient blast furnaces in the world are in China, and they are highly competitive on emissions compared to US blast furnaces. Yet, the Chinese industry as a whole is much dirtier due to the widespread American adoption of low emissions technologies, like electric furnaces, and the predominant use of scrap.
Why do these data matter? Consider a border measure that uses a dual standard. Imported steel made in electric furnaces would have to meet the US electric furnace average. And imported blast furnace products would have to meet the US blast furnace average.
This means that instead of being compared against the overall US hot-rolled coil average, imports from Nippon Steel and ArcelorMittal (two of the world’s largest and highest emitting flat-rolled producers) would be judged against the US blast furnace average. And hot-rolled coil imports from Nippon Steel (2.20 MT CO2e) and ArcelorMittal (2.23 MT CO2e) would both fall below the US blast furnace average (2.40 MT CO2e).
That hardly provides a bulwark against dirty imports. Electric furnaces and blast furnaces make the same steel products, meaning that these high emissions imports would effectively skirt the border measure and compete head-to-head in the market with low emissions US products.
In contrast, as shown below, if the domestic average for total US flat production (1.2 MT CO2e) is used as the standard, these higher emission steels from ArcelorMittal and Nippon Steel would be required to pay substantial border fees.
The consequences are just as perverse when a dual standard is applied to long products. The Scope 1-3 emissions intensity for US long products made in electric furnaces (0.61 MT CO2e) is typically at least three times lower than the emissions intensity of imported long products made in blast furnaces. One leading integrated rebar producer reported a long products carbon intensity of 2.3 MT CO2e in 2023, which is consistent with other blast furnace producers and shows the equally large divide between clean and dirty long production.
Yet, since there are no long producers using blast furnaces in the United States, but roughly 50% of global long products are made in blast furnaces, the emissions intensity of blast furnace imports would be compared against a made-up emissions threshold that does not represent the actual experience of the US industry, which is far cleaner. This would result in greater volumes of high emissions imports entering the United States than under a single standard. The biggest loser in this scenario would be the union and non-union mills making long products in the United States.
Consequently, it is not clear to us how differentiated emission standards as part of a carbon border measure promote decarbonization or American competitiveness. Any carbon policy that distinguishes between production processes in establishing emissions standards does so at the direct expense of the low-emissions producers whose advantage is greatest when the same standard is applied to all companies. And when applied at the border, even the highest-emitting American producers are disadvantaged by a dual standard. Put simply, a dual standard effectively encourages imports with higher emissions than the majority of steel production in the United States.
Especially as the European Union’s (EU) Carbon Border Adjustment Mechanism (CBAM) continues to enter into force, this will have a significant impact on the American steel market. The EU CBAM uses a single emissions standard, applying the same emissions costs to all products regardless of their production process.
This means that high emissions steel will be effectively barred from the European market. As the CEO of a leading non-EU, integrated steelmaker said in a recent interview, they “may become uncompetitive in the EU market” because of the CBAM. This will have massive trade diversion effects. And if the United States opts for a differentiated approach (or no border measure at all), we will be barraged with blast furnace imports that can only meet the blast furnace standard, that are from producers who are much higher polluting than the US industry, and that have been priced out of the EU market.
Given the desire for climate action, and the urgent need to secure American competitiveness vis-à-vis higher emitting foreign producers, it appears obvious to us that a single standard should be the only approach under consideration for any carbon border policy.
Editor’s note
This is an opinion column. The views in this article are those of an experienced trade attorney on issues of relevance to the current steel market. They do not necessarily reflect those of SMU. We welcome you to share your thoughts as well at info@steelmarketupdate.com.
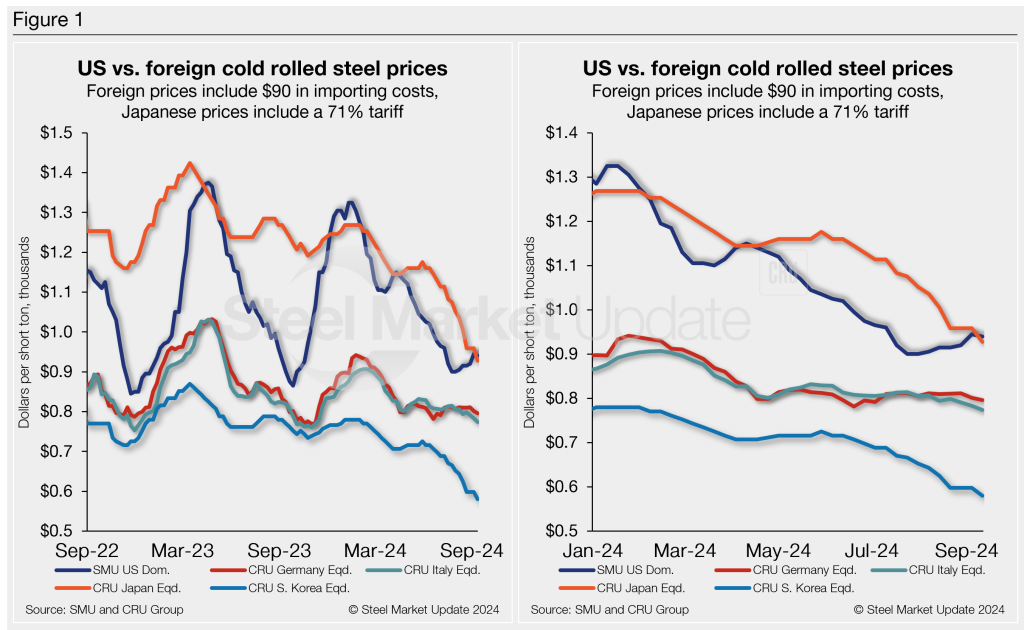
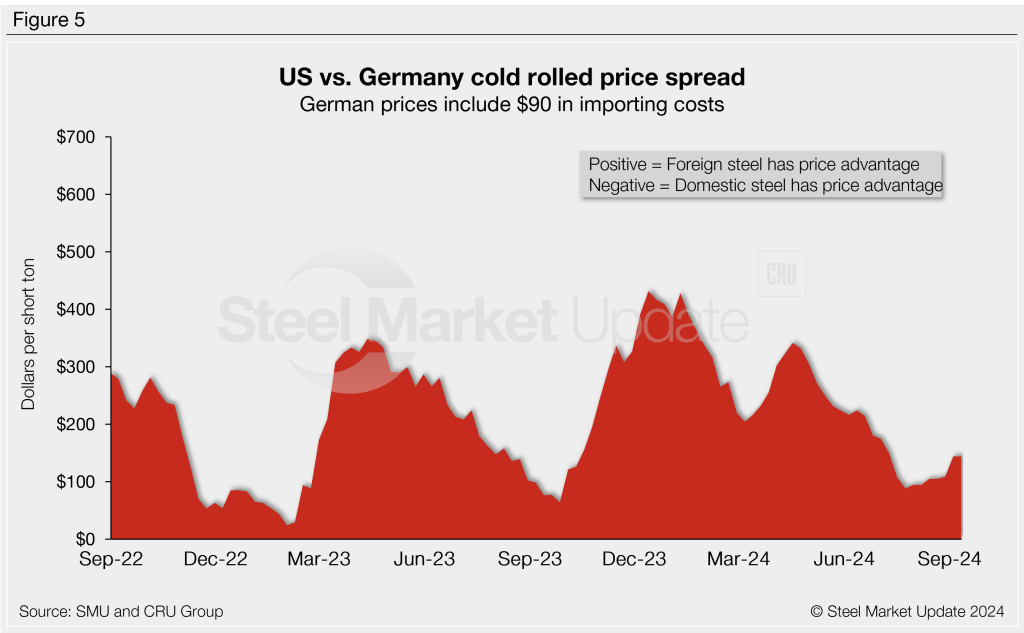
The price gap between US cold-rolled (CR) coil and offshore product is a bit broader this week despite slightly lower tags stateside. The premium is still widening since falling to a 10-month low in late July.
Domestic CR coil tags remain above offshore prices on a landed basis. US prices ticked down slightly week on week (w/w) but have been mostly rising since also falling to a 10-month low in July. This is while offshore tags have been largely easing.
US CR coil prices averaged $940 per short ton (st) in our check of the market on Tuesday, Sept. 10, down $5/st vs. the prior week. Despite the steady improvement of late, CR tags are still down roughly $385/st from a year-to-date high of $1,325/st in January.
Domestic CR prices are, theoretically, roughly 24.1% more expensive than imports. That’s up from 22.2% last week. While US CRC prices are still higher than offshore material, the US CR premium is down from a 31.5% premium in early January.
In dollar-per-ton terms, US CR is now, on average, $171/st more expensive than offshore product (see Figure 1). That compares to $160/st more expensive on average last week. That’s still well below a recent peak of $311/st in mid-January.
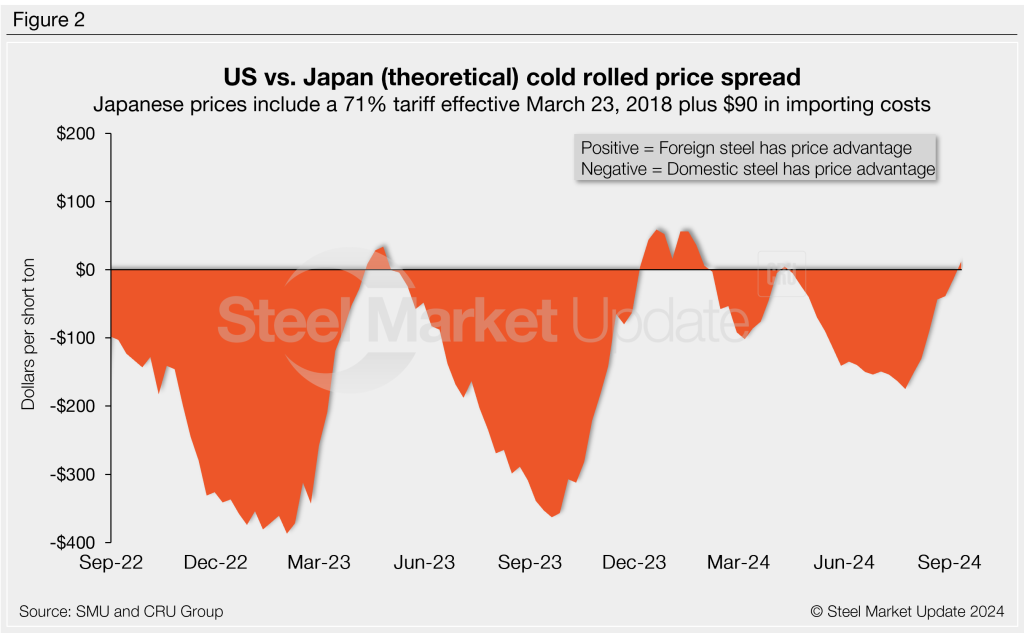
The charts below compare CR coil prices in the US, Germany, Italy, South Korea, and Japan. The left-hand side highlights prices over the last two years. The right-hand side zooms in to show more recent trends.
Methodology
This is how SMU calculates the theoretical spread between domestic CR prices (FOB domestic mills) and foreign CR prices (delivered to US ports): We compare SMU’s US CR weekly index to the CRU CR weekly indices for Germany, Italy, and East Asia (Japan and South Korea). This is only a theoretical calculation. Import costs can vary greatly, influencing the true market spread.
We add $90/st to all foreign prices as a rough means of accounting for freight costs, handling, and trader margin. This gives us an approximate CIF US ports price to compare to the SMU domestic CR price. Buyers should use our $90/st figure as a benchmark and adjust up or down based on their own shipping and handling costs. (Editor’s note: If you import steel and want to share your thoughts on these costs, please get in touch with the author at david@steelmarketupdate.com.)
East Asian CR coil
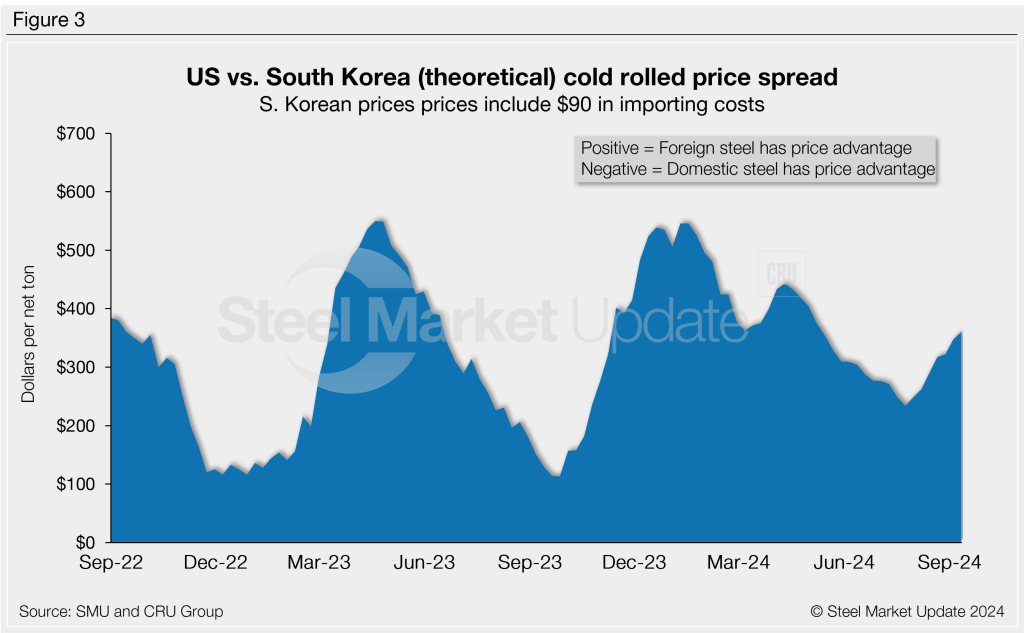
As of Thursday, Sept. 12, the CRU Asian CR price was $490/st, down $18/st w/w and $45/st lower over the past month. Adding a 71% anti-dumping duty (Japan, theoretical) and $90/st in estimated import costs, the delivered price to the US is $928/st. The theoretical price of South Korean CR exports to the US is $580/st.
As noted above, the latest SMU CR price is $940/st on average, which puts US-produced CR theoretically $12/st below CR product imported from Japan. But US tags are still $360/st more expensive than CR imported from South Korea.
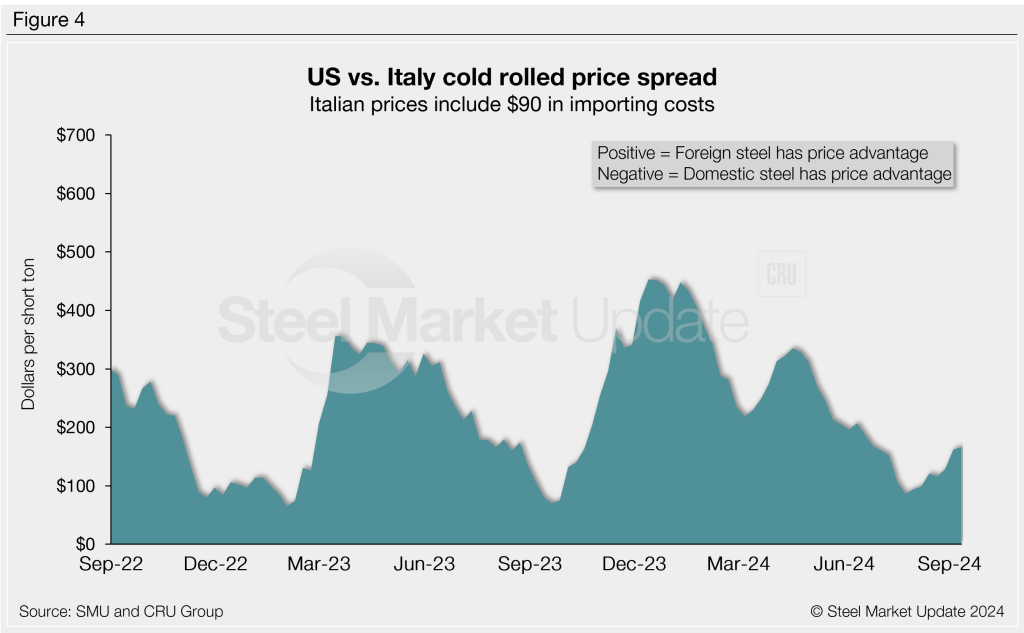
Italian CR coil
Italian CR prices were down $5/st to roughly $684/st this week. After adding import costs, the price of Italian CR delivered to the US is, in theory, $774/st.
That means domestic CR is theoretically $166/st more expensive than CR coil imported from Italy. The spread is up $4/st from last week but still $287/st below a recent high of $453/st mid-December.
German CR coil
CRU’s German CR price was down just $5/st vs. last week. After adding import costs, the delivered price of German CR is, in theory, $796/st.
The result: Domestic CR is also theoretically $144/st more expensive than CR imported from Germany. The spread is flat w/w but still well below a recent high of $431/st in the first week of 2024.
Notes: We reference domestic prices as FOB the producing mill, while foreign prices are CIF the port (Houston, NOLA, Savannah, Los Angeles, Camden, etc.). Inland freight from either a domestic mill or a port is important to keep in mind when deciding where to source from. It’s also important to factor in lead times. In most market cycles, domestic steel will deliver more quickly than foreign steel. Note also that, effective Jan. 1, 2022, the blanket 25% Section 232 tariff was removed from most imports from the European Union. It was replaced by a tariff rate quota (TRQ). Therefore, the German and Italian price comparisons in this analysis no longer include a 25% tariff. A similar TRQ with Japan went into effect on April 1, 2022. South Korea is subject to a hard quota rather than a tariff.
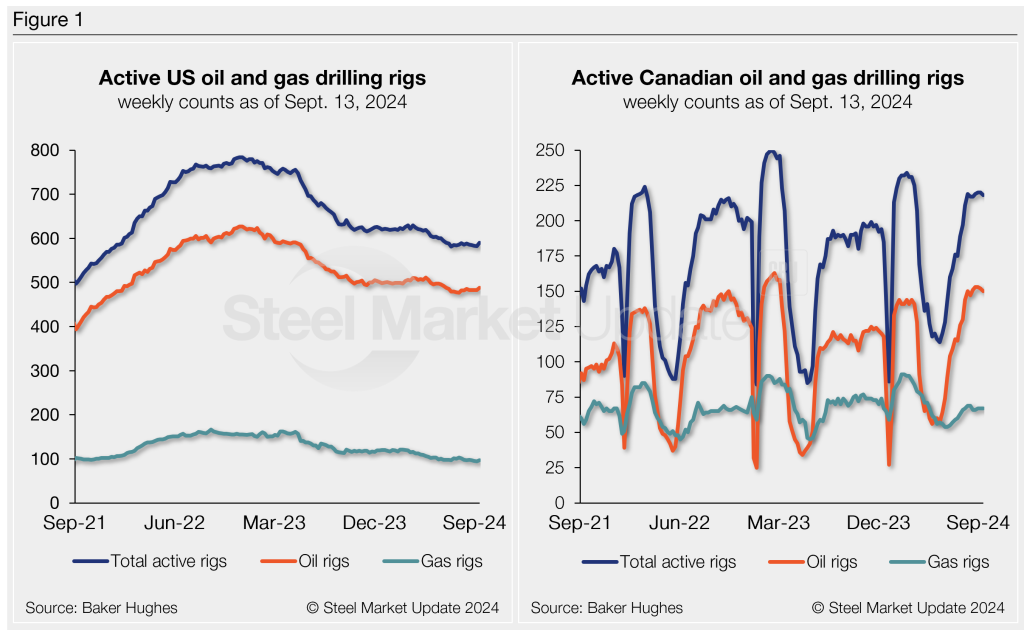
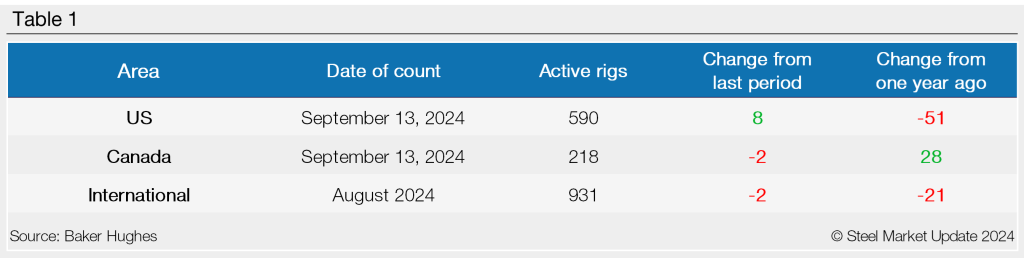
Oil and gas drilling activity in the US recovered the week ended Sept. 13 but remains low compared to recent years. Meanwhile, drilling in Canada edged down slightly but is still just under a six-month high, according to this week’s report from oilfield services provider Baker Hughes.
US rigs
There were 590 drilling rigs operating in the US in the week ended Sept. 14, eight more than in the week before. Total oil rigs rose by five to 488, while gas rigs moved up by three to a total of 97. The miscellaneous rig count was unchanged at five.
There were 51 fewer active US rigs last week compared to the same week last year, with 27 fewer oil rigs and 24 fewer gas rigs.
Canada rigs
In Canada, there were 218 drilling rigs active last week, a drop of two from the prior week. Active oil rigs declined by two to 150, and gas and miscellaneous rigs held steady at 67 and one, respectively.
There are currently 28 more active rigs operating in Canada compared to one year ago, with 31 more oil rigs, four fewer gas rigs, and one additional miscellaneous rig.
International rig count
The international rig count is a monthly figure updated at the beginning of each month. The total number of active rigs for the month of August fell to 931, two less than the July count and 21 fewer than levels one year prior.
The Baker Hughes rig count is important to the steel industry because it is a leading indicator of demand for oil country tubular goods (OCTG), a key end market for steel sheet. A rotary rig rotates the drill pipe from the surface to either drill a new well or sidetrack an existing one. For a history of the US and Canadian rig counts, visit the rig count page on our website.
The White House decision on whether or not to block Nippon Steel’s play for U.S. Steel might be pushed back until after the upcoming presidential election, according to a report in the Washington Post.
The article said concerns are growing regarding the “political and economic consequences” of blocking the deal. It cites three people with knowledge of the matter who preferred to remain anonymous.
The sources reported that a decision is not likely soon, and may be delayed until after the US election in November.
Recall that, earlier this month, reports surfaced that President Biden was preparing to scuttle the deal.
Japanese steelmaker Nippon first announced the proposed buy, valued at over $14 billion, for Pittsburgh-based U.S. Steel in December.
Since then, it’s been a bumpy ride, as other politicians, including Vice President Kamala Harris and former President Donald Trump, respective Democrat and Republican presidential nominees in 2024, have come out against the merger. Additionally, the United Steelworkers (USW) union has been against the deal from the start.
If blocked, USS has threatened that it will have to cut thousands of jobs and move its headquarters out of Pittsburgh.
Several US government regulatory hurdles for the transaction remain outstanding.
Nippon Steel declined to comment for this article and a request for comment from U.S. Steel was not returned by time of publication.
SMU’s latest steel buyers market survey results are now available on our website to all premium members. After logging in at steelmarketupdate.com, visit the pricing and analysis tab and look under the “survey results” section for “latest survey results.”
Past survey results are also available under that selection. If you need help accessing the survey results, or if your company would like to have your voice heard in our future surveys, contact info@steelmarketupdate.com.
Key points and takeaways
We go over the big highlights of the survey in Final thoughts. Here are some other key points that we think are worth your time. (And, again, our premium subscribers can follow along with the latest results here.)
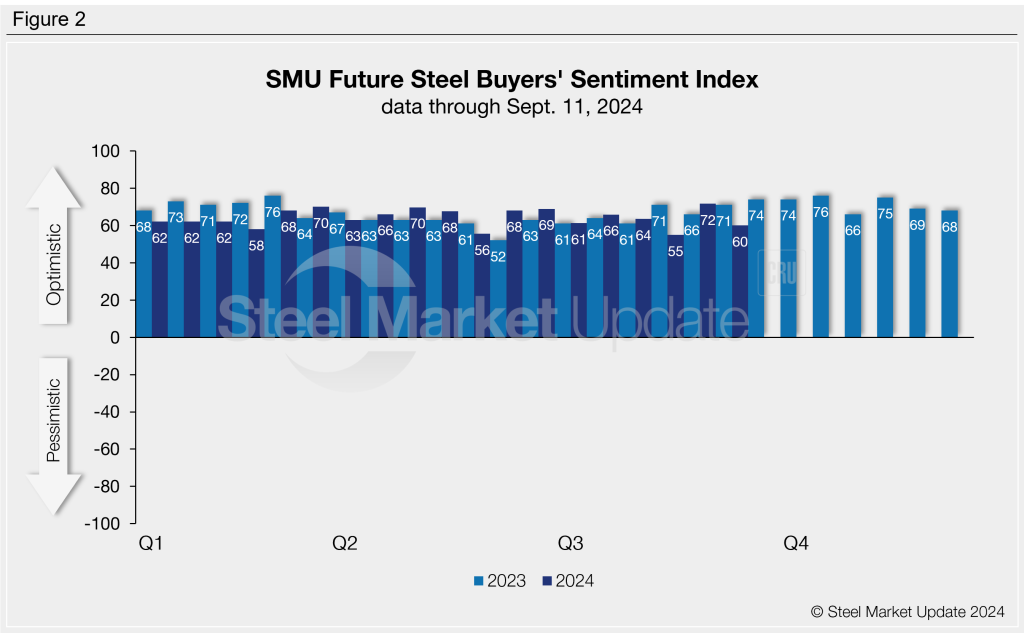
Steel Buyers’ Current Sentiment moved down to just six points above the four-year low seen just three surveys ago (slide 9). Future Sentiment (slide 11) retreated as well, falling 12 points from the previous market check.
Lead times for HR coil and tandem products are largely stable, but moving slightly lower. Plate lead times slipped again and are pushing lower at the three-week mark (slide 13).
On pricing, buyers said that most mills remain willing to negotiate, but less so for cold rolled. Still, there’s a clear decline in the number willing to cut deals as both Nucor and Cliffs continue pushing for HR prices above $700/st (slide 16). We’ll keep tabs on whether negotiation rates continue to slide in the weeks ahead, but they remain healthy, between 61-89%, depending on product.
What might keep sheet prices from a sharp rally? Some 43% of respondents said they didn’t meet forecasts in August – that’s the highest on record – and under 50% met forecasts (slide 20). Yet 10% still reported exceeding business forecasts in August.
Also, 71% of service centers said they are releasing less steel (slide 28) than a year ago, down from 80% in the last survey, but we’ve never seen such a sustained period of ~70% saying they’re releasing less steel than last year.
What might support higher prices? Service centers reported they are no longer lowering prices – likely a continued reaction to mills trying to increase tags. (See slide 38, one of our favorites.) That’s a significant shift from the nearly 20% that were cutting prices less than a month ago. It might be too soon to predict any surge in prices. Less than 20% of service centers reported they are still raising prices.
Another notable trend is that nearly 37% of manufacturers said they are reducing inventories, and none reported building inventories. However, in a complete shift, 24% of service centers say they are building inventories (slide 31.)
There’s a lot more to unpack in the survey. Be sure to check out the next Final thoughts for some of the comments and key reactions directly from our sources.
The unfair trade petitions filed last week against imports of corrosion-resistant (CORE) flat-rolled steel are set to be big in terms of their size, scope, and potential impacts on the market.
What’s been happening
Four domestic steelmakers and the United Steelworkers (USW) union petitioned the US government on Thursday, Sept. 5, seeking relief from what they say are illegally dumped and subsidized imports of coated steel.
Steel markets reacted quickly to the news of US mills’ extensive claims of unfair trade by 10 different countries and the threat of potentially heavy levies on CORE shipments destined for the US market.
We’ve heard multiple reports of foreign mills and traders pulling offers, as well as increasing order inquiries at some domestic mills. SMU Managing Editor Michael Cowden laid out some of the impacts already being felt in his Sept. 10 Final Thoughts.
As one trader put it in SMU’s survey this week: “The new trade case put a stop to” buyers’ appeal for imported galv products.
Another trader confirmed that “coated is on hold, pending the outcome” of the case’s preliminary duty determinations (see key case dates below).
Still, another trader noted that imports remain attractive, but only from “non-section 232 and trade investigation countries.”
News of the case filings was enough to halt one Houston-based trader from moving forward with a deal to buy galvanized products from the UAE. He told SMU his Dubai contacts have stopped offering material for the time being, and he is now looking for alternative sources.
Key case dates
SMU has compiled a list of key case dates to watch out for below. All are dependent on affirmative decisions that continue moving the cases forward.
The two main agencies involved in making these determinations in US trade cases are:
The International Trade Commission (ITC), which decides whether the imports in question have “injured” domestic producers.
The Department of Commerce (DOC). If the ITC makes an affirmative injury determination, the DOC must then establish the duty margins.
Wednesday, Sept. 25, is the next big date to watch. That’s when Commerce will decide whether or not to initiate the respective AD/CVD cases against each of the ten countries.
Note that Commerce can postpone preliminary determinations in AD and CVD cases by 50 and 65 days, respectively. The agency often does this in large and complicated cases. Thus, the dates below are anticipated but not definitive. Stay tuned to SMU for case updates and schedule changes in the coming months.
Event
Date or deadline
AD and CVD petitions filed
Sept. 5, 2024
DOC decision on case initiation
Sept. 25, 2024
ITC preliminary hearing
Sept. 26, 2024
ITC preliminary vote
Oct. 18, 2024
ITC preliminary AD and CVD injury determinations
Oct. 21, 2024
DOC preliminary CVD determination (A postponement would push to Feb. 2, 2025) (Collection of CVDs begins on the date this decision is published in the Federal Register.)
Nov. 29, 2024
Deadline for allegations of critical circumstances in CVD case
Jan. 22, 2025
DOC preliminary AD determination (A postponement would push to Apr. 3, 2025) (Collection of AD duties begins on the date this decision is published in the Federal Register.)
Feb. 12, 2025
DOC final CVD determination
Feb. 12, 2025
ITC final CVD injury determination
Mar. 31, 2025
DOC issues CVD order
Apr. 7, 2025
Deadline for allegations of critical circumstances in AD case
Apr. 7, 2025
DOC final AD determination
Apr. 28, 2025
ITC final AD injury determination
June 12, 2025
DOC issues AD order
June 19, 2025
Duty collection start dates and critical circumstance allegations
US Customs and Border Patrol (CBP) typically begin collecting duties when Commerce publishes its preliminary AD and CVD determinations in the US government’s Federal Register.
However, AD/CVD laws include a ‘critical circumstance’ provision meant to offset possible surges in imports between the case filing and duty collection dates. If petitioners make claims of critical circumstances and their claims are verified, duties can be applied retroactively for 90 days.
CORE case petitioners have until Jan. 22, 2025, to make claims of critical circumstances in the subsidy case, and April 7, 2025, for claims in the dumping case.
If claims of critical circumstances are verified, duties can be applied retroactively 90 days. That means the CPB could begin collecting CVDs on CORE material that entered the country as early as Aug. 31, and ADs as early as mid-November.
Period of investigation
For the investigation of Vietnam, the case will consider the alleged subsidies received in the first half of 2024, from Jan. 1 through June 30.
For the investigations of all the other countries – Australia, Brazil, Canada, Mexico, the Netherlands, South Africa, Taiwan, Turkey, and the UAE – the one-year investigation period will be from July 1, 2023, through June 30, 2024.
Be on the lookout for an analysis of coated steel import levels leading up to and during the periods of investigation in an upcoming issue of Steel Market Update.
A couple of notes on case participants
The petitioners that submitted the original petitions include Steel Dynamics Inc. (SDI), Nucor, U.S. Steel, Wheeling-Nippon Steel, and the USW union.
It’s important to mention that Nucor did not join the petitions on CORE from Mexico.
“Nucor does not comment on pending litigation matters,” a spokeswoman said. But you may remember, or even do business with, the Nucor-JFE Steel Mexico joint venture in Silao, Guanajuato. The JV started up a new continuous galvanizing line there in 2020. The JV has an annual production capacity of 400,000 short tons of hot-dip galvanized steel sheet for the automotive market. A new continuous galvanizing line began operating there in 2020.
It’s also important to point out that U.S. Steel, Wheeling-Nippon, and the USW have taken “no position on Canada,” according to USS’ Nov. 5 statement after the case’s filing.
You may also recall that the USW has 850,000 members in North America, including 225,000 in Canada, so it makes sense why it might want to sit that one out.
Sept. 18 is the deadline for other interested parties to register with the ITC in order to participate in the investigations.
Other interested parties who have already filed to participate include AM/NS Calvert, Algoma Steel, ArcelorMittal Dofasco, BlueScope Steel, Bluescope Steel Americas, Cleveland-Cliffs, Duferco Steel, Duferco Steel Processing, and Stelco. The federal government of Canada and provincial government of Ontario also plan to take part.
Please contact laura@steelmarketupdate.com if you would like to share any information about this case or the coated steel markets.
Ground broken on new aluminum recycling plant in US
Tri-Arrows Aluminum and Tennessee Aluminum Processors (TAP) have formally begun construction of a recycling plant at Russellville, Ky. The unit will process dross and scrap material from Tri-Arrows’ casting center at nearby Logan Aluminum. It will produce molten aluminum and sows that will be returned to Logan Aluminum and possibly other customers. The recycling center, to be run as a joint venture (JV) by the companies, will cost $40 million to build. Tri-Arrows Aluminum, based in Louisville, Ky., supplies rolled aluminum sheet to the North American market, focusing on the beverage can sheet and automotive sheet markets. The company is jointly owned by aluminum producer UACJ and trading house Sumitomo Corp., both of Japan. TAP is a toll converter of aluminum scrap and dross into ingots and provides secondary aluminum recycling services to customers in the transportation, packaging, construction and aerospace sectors.
Hydro opens new aluminum recycling plant in Hungary
This week Hydro announced the opening of a new aluminum recycling plant in Szekesfehervar, Hungary. The new aluminum recycling plant was built next to Hydro’s aluminum extrusion plant in Szekesfehervar. This serves customers in the automotive industry with advanced aluminum components. According to Hydro, the recycling plant has an annual capacity of 90,000 metric tons (mt), also mainly serving the automotive market. Additionally, it is said that the recycling plant will initially process 15,000 mt of post-consumer scrap annually. This will increase over the years to come, in line with the growing customer demand for recycled, post-consumer aluminum.
According to the press release, Paul Warton, EVP of Hydro Extrusions mentioned that, “Our customers are not only asking for recycled and low-carbon aluminum. They also need us to recycle their process scrap, so we can create closed loops. With our new and modern recycling facility in Hungary, we are now able to offer that.”
Hydro acquires additional 20% of Vianode
Hydro has become a 50/50 partner in Vianode, a synthetic graphite manufacturer, after exercising its put option. This follows Altor’s decision to sell its 20% stake in the company. Vianode is currently building a large-scale production facility in Norway, expected to be completed by the end of 2024. Hydro’s acquisition of Altor’s shares is subject to regulatory approval and is expected to be finalized within 6-8 weeks.
Hydro’s updated 2030 strategy maintains a focus on its current battery investments, with future capital allocation dependent on the attractiveness of new opportunities.
Constellium achieves Aluminum Stewardship Initiative Certification for all global operations
Constellium announced it has achieved Aluminum Stewardship Initiative (ASI) Performance Standard Certification for all its operations, including its corporate office in Paris.
According to the press release, all operations are certified to ASI’s latest Performance Standard Version 3.0. This sets a new level of targets for responsible production, sourcing, and stewardship of the aluminum value chain. Operations in Europe and North America are certified on all the 11 principles of the Standard. Issues addressed include material stewardship, greenhouse-gas emissions, waste and water management, biodiversity, governance, and labor and human rights. Constellium’s Chinese operations have been certified against the first four principles of the Standard as material converters.
Concerning the announcement, Jean-Marc Germain, CEO of Constellium, commented, “I am proud that Constellium has achieved ASI Certification across all of our operations.”
“This accomplishment reflects our strong commitment to responsible business practices and our dedication to delivering high-value, sustainable aluminum solutions,” he continued. “This certification, coupled with our recycling capacity and our sustainability commitments, is a step further to respond to the expectations of our customers and society.”
Alcomet to expand product range
Aluminum products manufacturer Alcomet has started on a project to widen the portfolio of products made at its plant in Shumen, northeastern Bulgaria.
The initiative will enable production of new aluminum alloys for electric-vehicle (EV) batteries and widen the range of products offered to the automotive and solar power sectors, the innovation ministry said. A continuous casting line, profile production lines, universal foil mill and associated facilities will be installed to enable the expansion, local media reported. Cap-ex tops BGN136 million ($77 million), and is part of Alcomet’s three-year investment plan. This features a roller unit expansion, building a second foundry, installing a high-tech coil casting line, adding new presses at the workshop, and installation of a passivation line in the automotive unit to enhance product quality and reduce processing time.
This analysis was first published by CRU. To learn more about CRU’s services, visit www.crugroup.com.
General Motors and Hyundai Motor Co. announced they will be linking up to explore collaboration opportunities across a variety of areas, including their sourcing of steel.
Detroit-based GM and Seoul, South Korea-based Hyundai announced on Sept. 12 the signing of a non-binding memorandum of understanding “to investigate joint product development, manufacturing, and future clean energy technologies.”
The announcement added that the automakers plan to “review opportunities for combined sourcing in battery raw materials, steel, and other areas.”
The companies have already begun to assess potential opportunities, with an aim of moving towards more binding agreements.
“GM and Hyundai have complementary strengths and talented teams,” commented GM Chair and CEO Mary Barra. “Our goal is to unlock the scale and creativity of both companies to deliver even more competitive vehicles to customers faster and more efficiently.”
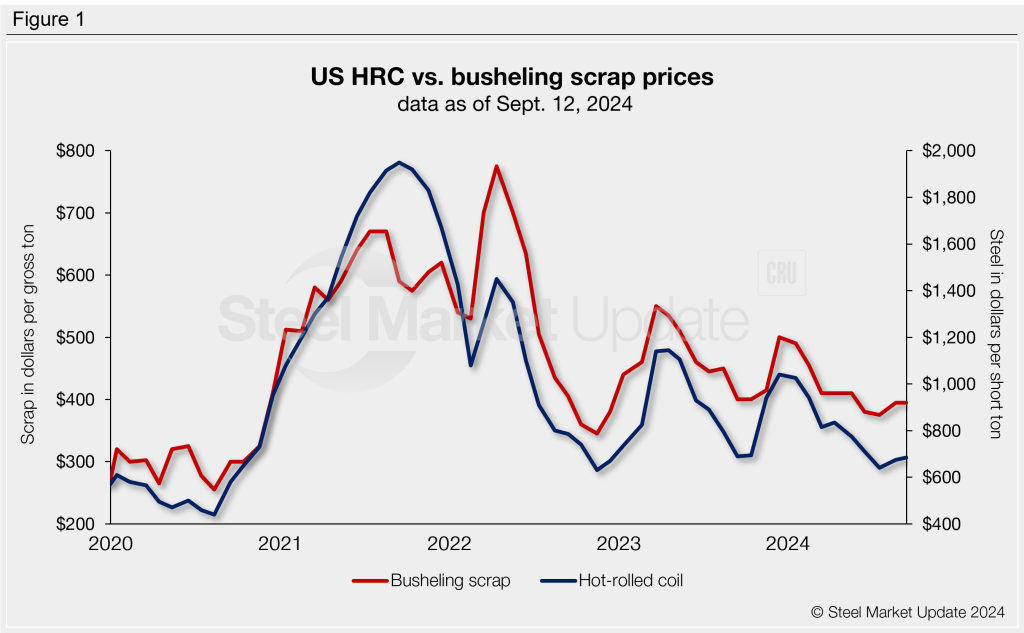
The price spread between hot-rolled coil (HRC) and prime scrap widened again in September, according to SMU’s most recent pricing data.
SMU’s average HRC price slipped during the week, while the September price for busheling scrap was flat.
Our average HRC price was $685 per short ton (st) as of Sept. 10, off $5 from the previous week.
At the same time, busheling tags remained level at an average of $395 per gross ton in September. Figure 1 shows price histories for each product.
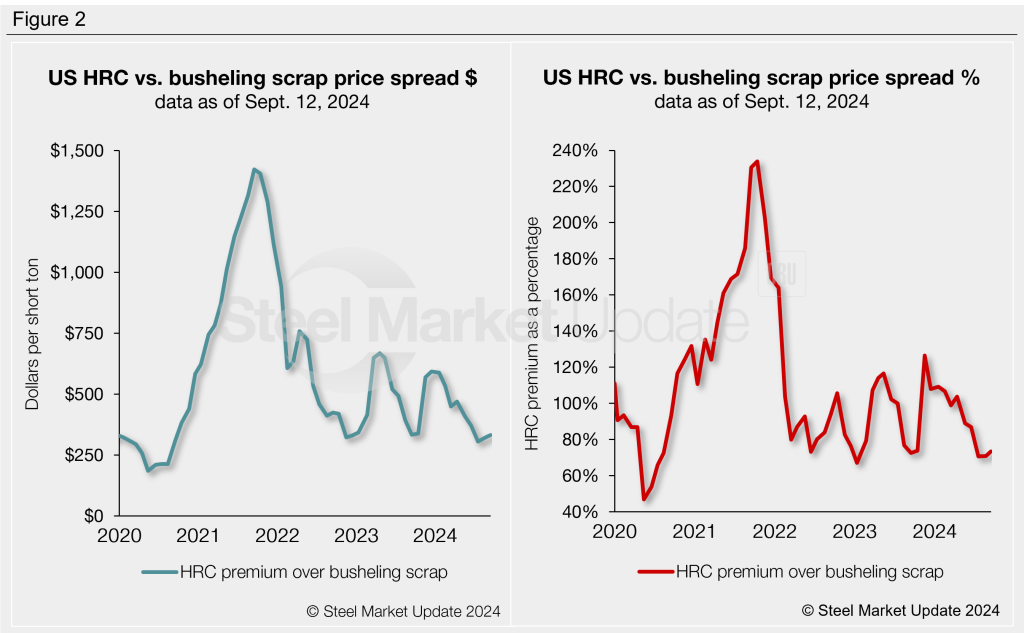
After converting scrap prices to dollars per short ton for an equal comparison, the differential between HRC and busheling scrap prices was $332/st as of Sept. 12, $10 higher than a month earlier (Figure 2). This is the second consecutive monthly increase. However, we have to go back to October of last year to find the spread in similar territory at $333/st.
The chart on the right-hand side below explores this relationship differently: We have graphed HRC’s premium over busheling scrap as a percentage. HRC prices carry a 73% premium over prime scrap, up from 71% a month ago. It last stood at 73% in the middle of September last year.
Note: By the way, did you know SMU’s Interactive Pricing Tool can show steel and scrap prices in dollars per short ton, dollars per metric ton, and dollars per gross ton?
Prices in the hot-rolled coil futures market have fallen m/m in early September, yet they remain little changed since our last review on Aug. 14. As of Monday, Sept. 9, futures prices showed an average of $753 per short ton for Q4’24 and an average of $817/st for all of 2025. Spot prices, meanwhile, have slowly inched higher after mills were able to stop discounting orders. Yet our most recent price assessment for HR coil remains below recent mill asking prices.
While the slow acceptance of higher mill asking prices is starting to come about, the futures market seems particularly optimistic about further gains to come. The December 2024 contract was near steady m/m at $780/st vs. our Sept. 11 price assessment of $698/st. Just two months ago, in July, we suggested that the November and December contracts looked interesting as, at the time, physical buyers were able to buy HR coil well below $650/st and could sell it forward for nearly $800/st. Perhaps some of this took place as the amount of open interest in the December contract surged higher, having gained 57% over the last two months.
Futures prices remain high through 2025 with a current average of $817/st, a level only exceeded twice outside of the pandemic era: in 2008 and 2018. Prices have spiked up over $1,000/st in each of the last two years, though a spike of this nature seems unlikely due to new capacity continuing to ramp up through 2025. Regardless, while the futures market may be mispriced, it may also be providing a warning for buyers. Perhaps it is wise for buyers and sellers to mitigate a portion of a potential price spike or decline.
This analysis was first published by CRU. To learn more about CRU’s services, visit www.crugroup.com.
Following significant recoveries in late August, SMU’s Steel Buyers’ Sentiment Indices tumbled this week. We have seen volatility in our Current Steel Buyers’ Sentiment Index since June, but only recently in our Future Sentiment Index. While down, both of our Sentiment Indices remain in positive territory and continue to indicate optimism among steel buyers.
Every other week, we poll hundreds of steel buyers about their companies’ chances of success in today’s market, as well as business expectations three to six months down the road. We use this information to calculate our Current Steel Buyers’ Sentiment Index and our Future Sentiment Index, a measure SMU has been tracking since 2008.
Highlights
Through our latest market survey, the Current Buyers’ Sentiment Index fell seven points from late August, now nearing lows last seen in July and early August. Future Steel Buyers Sentiment dropped 12 points from two weeks prior, previously at a nine-month high.
In our late-August Sentiment analysis, we warned that the uptick in the Indices may have been attributed the increased optimism following our annual SMU Steel Summit Conference. Historically, our Steel Buyers’ Sentiment Indices have shown moderate gains in the weeks after each Summit, with upticks in market enthusiasm observed in seven of the past 10 years following the event.
Current Sentiment
SMU’s Current Buyers’ Sentiment Index declined to +41 this week (Figure 1). Recall that Current Sentiment had fallen to +34 in both the first and last week of July, which were the lowest readings recorded since August 2020. Year to date (YTD), Current Sentiment has averaged +52 across 2024, significantly lower than the 2023 YTD average of +68. Current Sentiment was +56 this same week one year ago.
Future Sentiment
SMU’s Future Buyers’ Sentiment Index measures buyers’ feelings about business conditions three to six months down the road. This index fell to +60 this week. Recall that in mid-August it reached +55, the lowest reading seen in over a year (Figure 2). Future Sentiment has averaged +64 since the beginning of 2024, down just two points from the same period of 2023. This time last year Future Sentiment was +71.
Moving averages
Measured as a three-month moving average, Buyers Sentiment declined across the board this week. The Current Sentiment 3MMA eased to a four-year low of +39.20, while the Future Sentiment 3MMA edged down to a one-year low of +62.86 (Figure 3).
What SMU survey respondents had to say:
“As we ship the trough-priced tons sold, we will do OK, but it will take some time to improve beyond fair.”
“Once the election is over, the market will open up.”
“I see things picking up from current lows and improving after some additional clarity coming from the presidential election being decided.”
“Spot price recovery will help improve things.”
“Future outlook is better.”
“We are always adapting to market pressures.”
About the SMU Steel Buyers’ Sentiment Index
The SMU Steel Buyers Sentiment Index measures the attitude of buyers and sellers of flat-rolled steel products in North America. It is a proprietary product developed by Steel Market Update for the North American steel industry. Tracking steel buyers’ sentiment is helpful in predicting their future behavior. A link to our methodology is here. If you would like to participate in our survey, please contact us at info@steelmarketupdate.com.
The US plate market finds itself in unfamiliar territory, well maybe unfamiliar territory for this side of the post-Covid “normal,” that is.
Domestic plate prices had been on a historic ride. For a while, it seemed prices would never come down from stratospheric highs.
Up to speed
Domestic plate prices began surging in January 2021. Tags reached an all-time high of $1,940 per short ton (st) in May 2022, though they have mostly trended lower since then.
During that three-and-a-half-year period, tags averaged roughly $1,500/st. Before the rally, US plate prices averaged roughly $790/st, according to Steel Market Update’s data.
SMU’s plate price currently stands at $950/st on average based on our Tuesday, Sept. 10, check of the market (see Figure 1, left-side chart). However, lower prices were confirmed shortly after we closed our weekly assessment.
Transactions were confirmed in the upper $800s, though the bulk of business is in the mid $900s. Next week’s price assessments are likely to capture lower tags.
What might be more significant is that smaller volumes are drawing competition amongst mills and sellers. And $1,000/st is not a competitive number. Nucor’s published plate price of $1,075/st is ancient history – even for the Charlotte, N.C.-based steelmaker itself, according to sources.
You can almost “name your price” with a 1,000-st spot need, sources told SMU.
“Plate is right around $900 all day for standard width and thickness,” said an OEM executive. “A little too quiet. Kind of eerie actually.”
By comparison, our HR price is $685/st. HR tags, while up from July’s lows, are down $360/st since reaching a recent high of $1,045/st at the start of the year.
Even though plate prices have seen less volatile swings vs. HR, plate tags have been largely trending down since peaking more than two years ago, especially of late (see Figure 1, right-side chart). Now, they’re at their lowest level since January 2021.
Back to historic spreads?
There was a time – feels like ancient history at times – when the price spread between plate and HR coil was between $100-200/st. Like AD and BC designations in the Gregorian and Julian calendars, Covid could designate a clear shift in the plate vs. HR price spread, at least up until recently (see Figure 2, left-side chart).
The average spread, or premium, plate had over HR between 2017-2020 was $132/st. Volatility reigned supreme in the immediate aftermath of Covid-19, leading the spread to invert for much of 2021. And then in 2022, plate prices decoupled from HR.
We saw the spread between plate and HRC reach as high as $970/st in the summer of 2022. It currently sits at almost a three-year low of $265 per ton.
On a percentage basis, plate’s premium over HRC ballooned to 126% in late September 2023 (Figure 2, right-side chart), reaching a 10-month high. It was also not far from the all-time high of 152% in November 2022. However, with HR prices near recent lows and plate tags declining, the premium is down to just 39%, one of the lowest in recent years.
Mill prices – word on the street
There’s growing concern in the market about the transparency of published mill prices. Many wonder if the published price is just a ceiling from where to discount, as sources note that mills are consistently offering and transacting well below their published prices.
Some in the market agree with Nucor’s recent reasoning for maintaining prices – a decrease wouldn’t drive buying.
But while keeping prices flat has some benefits, namely not devaluing inventories, it has left most sources concerned the next decrease will be a massive price cut. (Think back to when Nucor slashed prices by $90/st on April 29 and $125/st on July 1.)
So, while Nucor “officially” held the line on plate at $1,075/st this month and last, reasoning with customers that a price cut wouldn’t draw in buyers, spot transactions are, on average, more than $150/st below that.
Some dynamics at play
The US plate market has been largely quiet, with demand trending down.
The lack of stability has been highlighted by slower-than-expected infrastructure spending and, perhaps more significantly, by a wave of wind farm project cancellations.
With spot plate demand limited, expect continued discounting and undercutting of published mill prices.
Also, keep an eye on discrete plate lead times. They are trending lower and are easily below the three-week mark at some mills – levels not seen in more than four years.
What to watch for
With reports that some mills still have September availability, another price cut might be imminent. But will it be a series of incremental decreases – or will it be $100/st or more?
Sources agree the market is working to find the bottom and might be close to one. Most suggest it will be in Q4, but they don’t expect much of a bounce back after.
Keep an eye on service center inventories as well. Plate inventories were a bit bloated in July. And SMU’s recent flash report for August, which was sent to data providers earlier this month, suggests inventories were even higher last month. The final report will be distributed data providers on Monday. Premium subscribers will receive a copy later in the week.
Editor’s note: If you’d like to become a data provider for our service center inventory report, please contact David Schollaert at david.schollaert@crugroup.com. If you would like to upgrade your executive account to premium, please contact Luis Corona at luis.corona@crugroup.com.