Cliffs blames muted auto demand for steep losses in 2024
Muted demand from the auto industry took a particular toll later in the year.

Muted demand from the auto industry took a particular toll later in the year.
U.S. Steel’s losses widened in the fourth quarter on lower steel prices, weaker demand, and startup costs relating to the expansion of its Big River Steel EAF sheet mill in Arkansas. But the Pittsburgh-based steelmaker said it expected results to improve in 2025 as Big River 2 – the project to double capacity at the Osceola, Ark., mill - gains steam.
The projects collectively represent ~65% of Nucor’s capital expenditures budget for this year.
JSW Steel USA’s operations took earnings hits in the quarter ended Dec. 31. And Indian parent company JSW Steel believes potential tariff hikes by the Trump administration could hamper declining inflation in the US. JSW Steel USA operates the Mingo Junction slab and hot-rolled sheet mill in Ohio and the Baytown plate and pipe and […]
USMCA is option 1 but will cost more or not be big enough
But the Swedish steelmaker is optimistic about a rebound
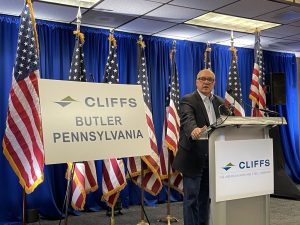
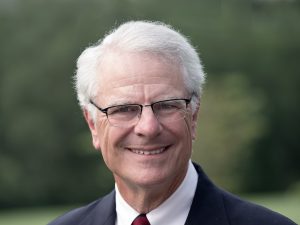
Nucor Corp.’s chief executive didn’t shy away from discussing the company’s interest in potentially acquiring the electric-arc furnace assets of U.S. Steel on Tuesday. An analyst on an earnings conference call asked about Nucor’s appetite for M&A given its strong cash position – $4.1 billion at the end of 2024. Chair, President, and CEO Leon […]
“More needs to be done to ensure that these illegally dumped and subsidized imports do not continue to distort the American market in a road profitability," Nucor's CEO said.
Nucor’s raw material segment generated an annual profit of $57 million in 2024. This marked a swing to profit over 2023 when Nucor reported a $14-million loss for the segment. The Charlotte, N.C.-based company did not say in their earnings call on Tuesday what caused this increase besides a 20% increase in the production and […]
Nucor Corp. posted sharply lower fourth quarter earnings on Monday driven in part by lower average selling prices at its steel mills. The Charlotte, N.C.-based steelmaker also warned that first-quarter results might not be much better in commentary released with earnings data. But Nucor said that it expected better times later in 2025. It also hinted at the possibility of ramped up trade restrictions – including more stringent Section 232 tariffs.
Ancora has nominated nine board members to U.S. Steel's 12-member board and seeks to install Alan Kestenbaum as CEO to replace David Burritt.
The Fort Wayne, Ind.-based company was ranked 29th overall
Steel Dynamics Inc. (SDI) remains upbeat about progress at its Sinton, Texas, sheet mill and expects it to be profitable in the upcoming months. “The Sinton team gained considerable momentum in the last two months—running above 80% capacity—and they are doing even better in January, with expectations to reach profitability in the coming months,” SDI Chairman and CEO Mark Millett said in a Q4’24 earnings call on Thursday.
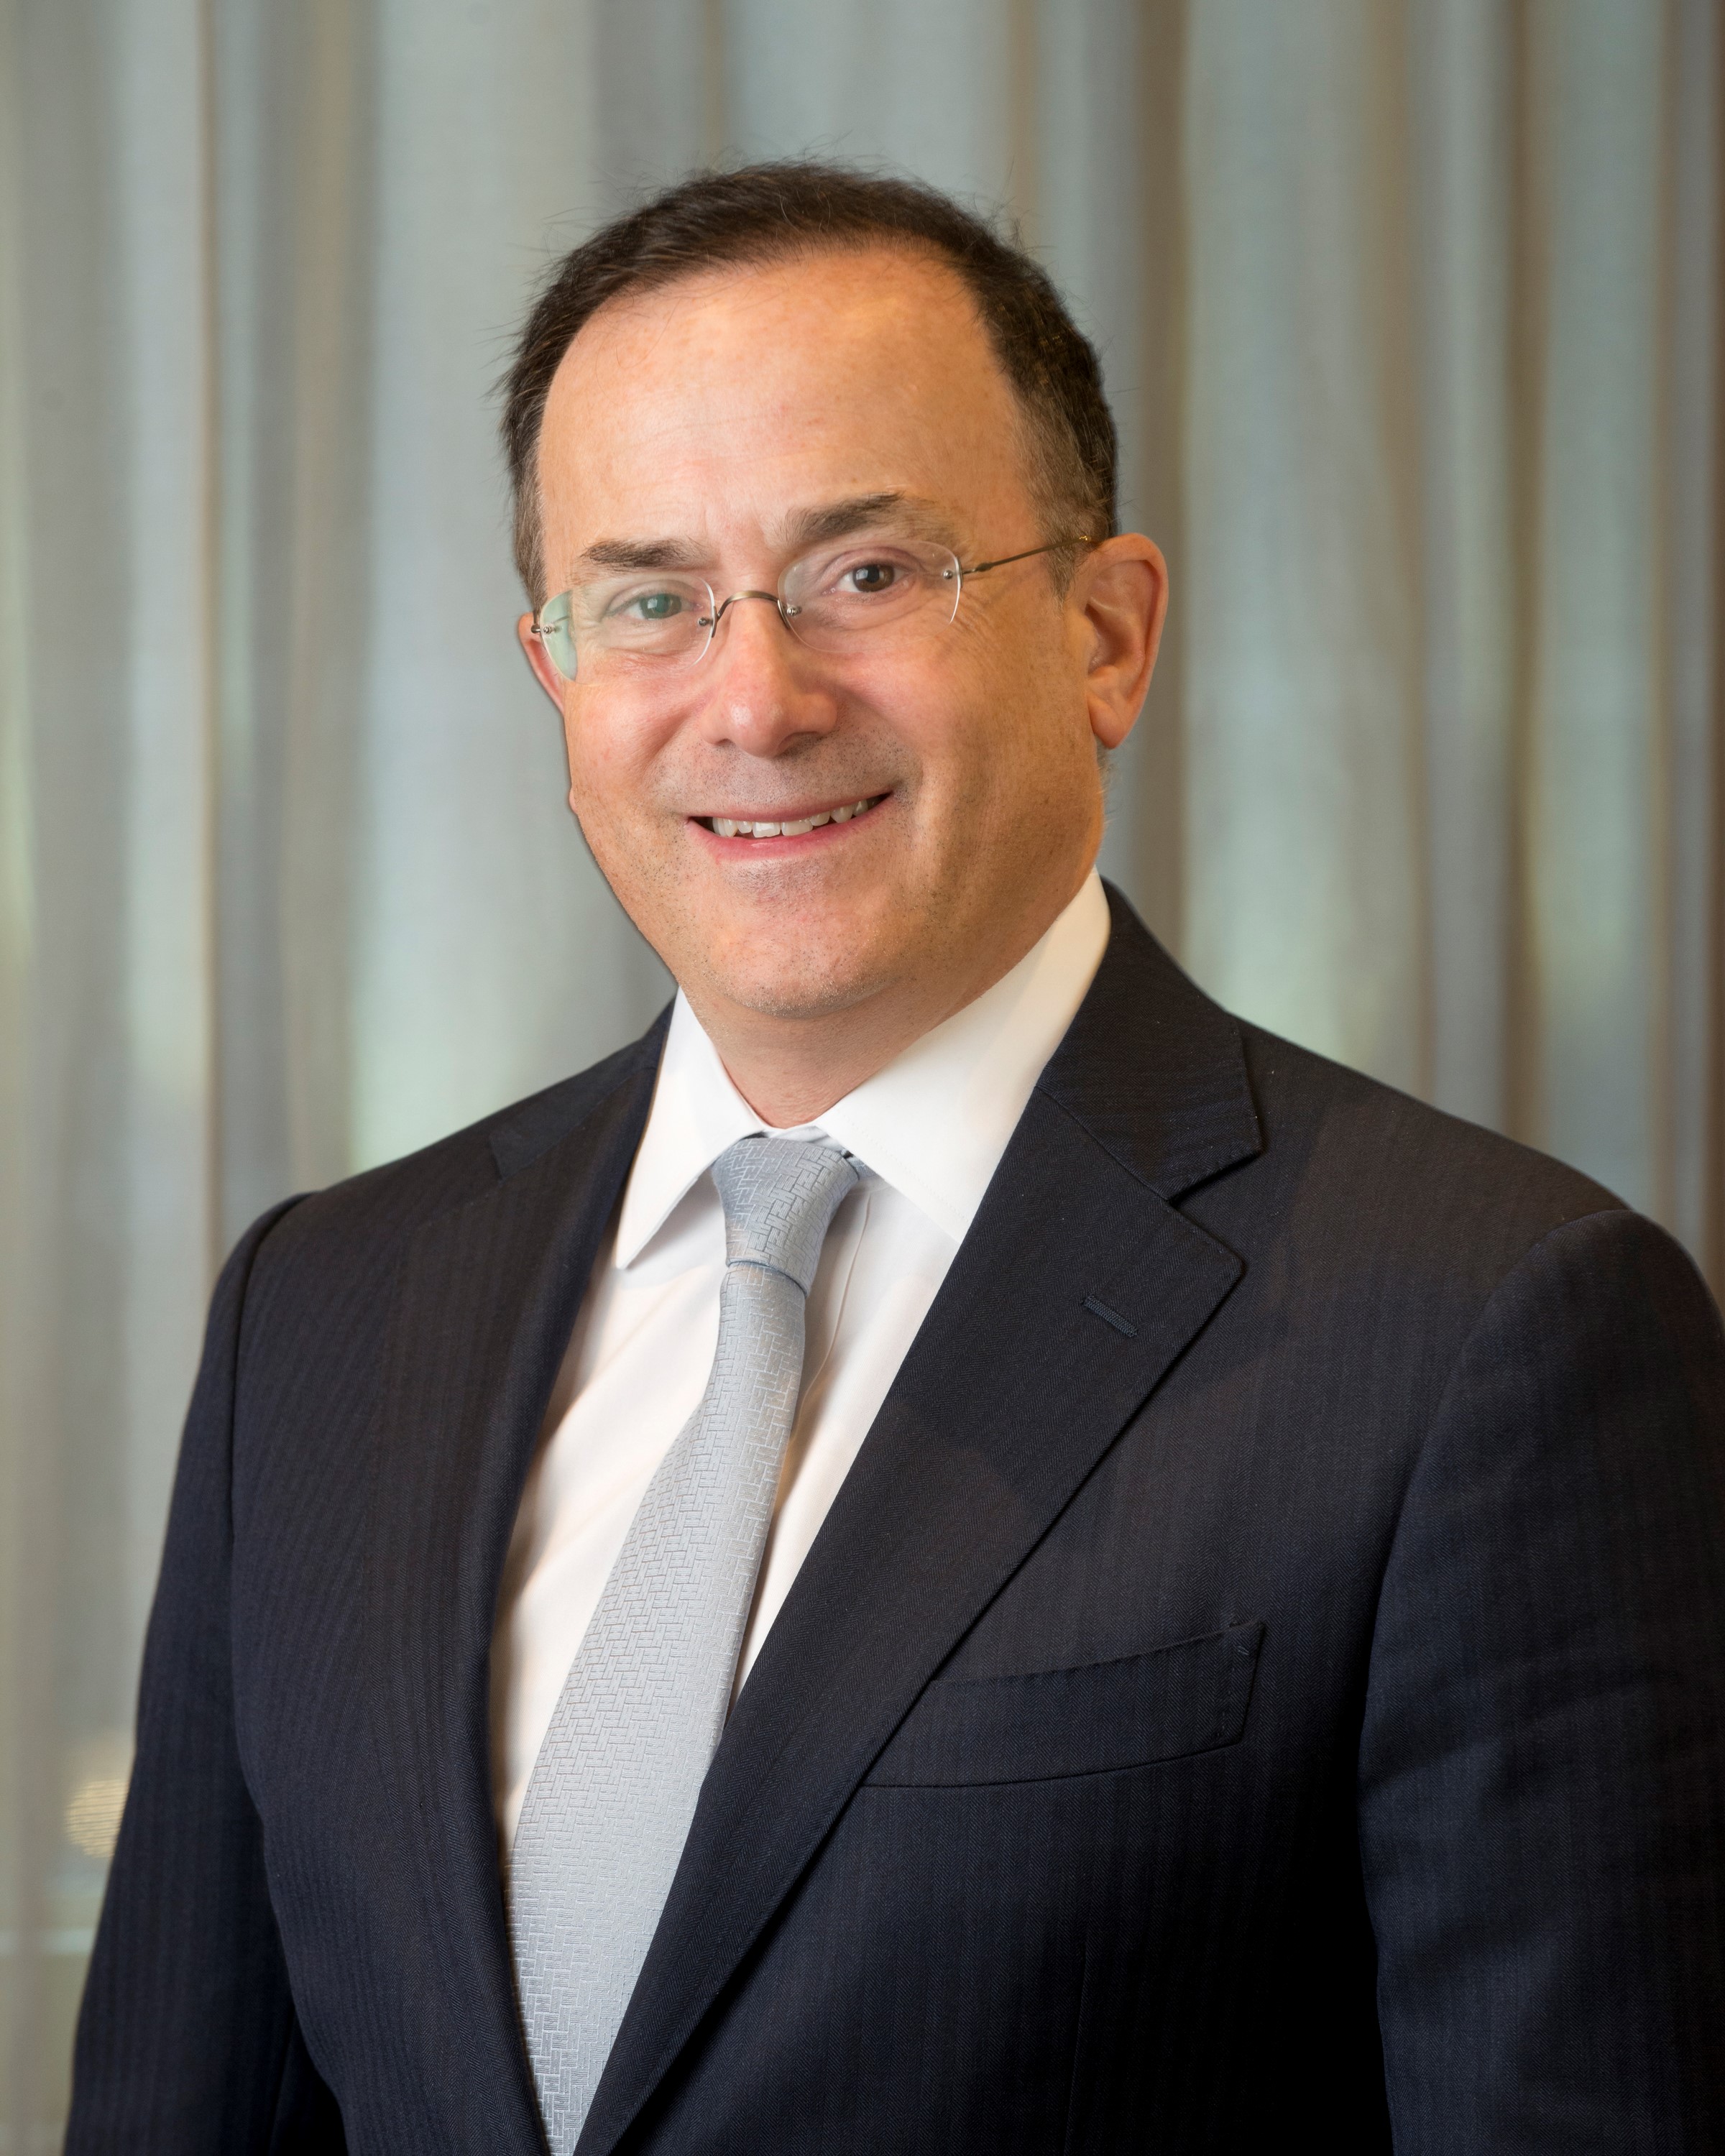
Alan Kestenbaum was the featured speaker at SMU’s Community Chat on Wednesday, where he discussed US Steel, tariffs, climate policy and other topics.
Steel Dynamic Inc.’s profits narrowed in the fourth quarter of 2024 on lower prices, import competition, and continued losses from its sheet mill in Sinton, Texas. The Fort Wayne, Ind.-based steelmaker said results also suffered from an unplanned outage at its sheet mill in Butler, Ind. That reduced sales volumes by approximately 50,000 tons.
The American Iron and Steel Institute (AISI) has reached out to the Trump administration, as well as some members of Congress, to present a blueprint of issues that are top of mind for steel producers. “2025 presents an opportunity for the new administration and Congress to take a holistic look at the key issues impacting […]
The 106” Mill was part of Algoma's plate and strip combination facility.
Nippon Steel’s litigation against the US government is set to begin in early February, according to a report by Japan’s Kyodo News Agency. Nippon will file its opening brief on Feb. 3. And both parties will conclude their claims by March 17 in the US Court of Appeals for the District of Columbia Circuit, Kyodo […]
Nucor’s “ambitious” carbon targets by the end of the decade and beyond have been certified by the Global Steel Climate Council (GSCC). The Charlotte, N.C.-based steelmaker used a base year of 2023 for its science-based emissions targets (SBET). It set an SBET of 0.975 metric tons (mt) of CO2 emissions per mt of hot-rolled steel […]
The Department of Energy's Industrial Demonstrations Program page states that it is no longer moving forward with SSAB.
He said a new entity would operate under the U.S. Steel name and would retain its Pittsburgh headquarters.
Cleveland-Cliffs could be teaming up with Nucor to make a play for U.S. Steel, according to an article at CNBC.
The Biden administration has pushed back until June the date for which Nippon Steel must unwind its $14.9-billion dollar deal for Pittsburgh-based U.S. Steel, the companies said on Saturday.
The steelmaker is completing construction of two such production facilities in Alabama and Indiana.
Hyundai Motor Group is reportedly considering building a sheet steel mill just south of Baton Rouge, La.
Nippon Steel and U.S. Steel have filed two lawsuits, one against the US government and the other against Cleveland-Cliffs and the United Steelworkers (USW) union's leader.
Slow construction activity and low steel prices weighed down profits for Commercial Metals Company.
As one of my university professors once said (and it’s stuck with me for half a century), “Change is the only permanency.” On Friday, President Biden acted to block the acquisition of United States Steel by Nippon Steel Corp. of Japan, without acknowledging the changes that have already occurred in the steel industry, and which are likely to increase. After more than a year of raging debate, it seems that nobody was convinced by arguments. Nippon’s worker-centered concessions, including safeguarding the jobs of U.S. Steel’s unionized workers and committing to more than $2 billion in investments for the aging plants at Gary, Ind., and the Mon Valley complex in Pennsylvania, were not mentioned in the president’s announcement on Friday.
The chief executive of U.S. Steel has come out against President Biden’s decision to block the USS/Nippon Steel deal, calling it “corrupt.”
“We continue to make significant progress in our strategic transformation to become one of North America's leading low-carbon steel producers, setting the stage for an exciting 2025,” CEO Michael Garcia said.