Mexico
March 19, 2025
North American auto assemblies improve in February
Written by David Schollaert
North American auto assemblies grew in February, up 3.8% above January. Still, according to LMC Automotive data, assemblies were 11% lower year on year (y/y).
After slumping in December to the lowest total since July 2021, February assemblies further expanded on January’s growth after production reached a three-year low. Sentiment remains tempered as carmakers continue downgrading and adjusting vehicle output to meet curtailed market demand.
The USMCA agreement, previously NAFTA, has been the bedrock of the North American automotive industry for nearly three decades. Uncertainty from tariff threats could add another wrinkle to production volumes. The actual impact on the market will be a function of the tariffs’ duration, but material supply chain disruptions are expected.
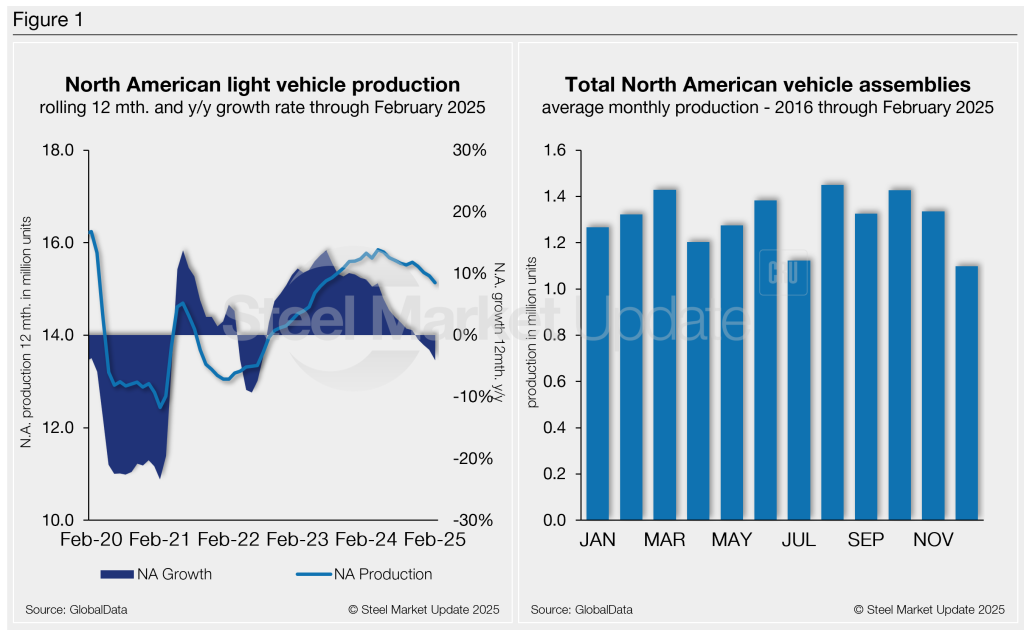
North American vehicle production, including personal and commercial vehicles, totaled 1.209 million units in February, a rise of more than 3.8% from January’s 1.165 units but 11% behind the 1.358 million units produced a year earlier.
Figure 1 below provides a five-year snapshot of North American light-vehicle production since 2020 on a rolling 12-month basis with a y/y growth rate. Also included is a five-year snapshot of average monthly production, which includes seasonality since 2016.
A short-term snapshot of assembly by nation and vehicle type is shown in the table below. It breaks down total North American personal and commercial vehicle production into US, Canadian, and Mexican components. It also includes the three- and 12-month growth rates for each and their momentum change.
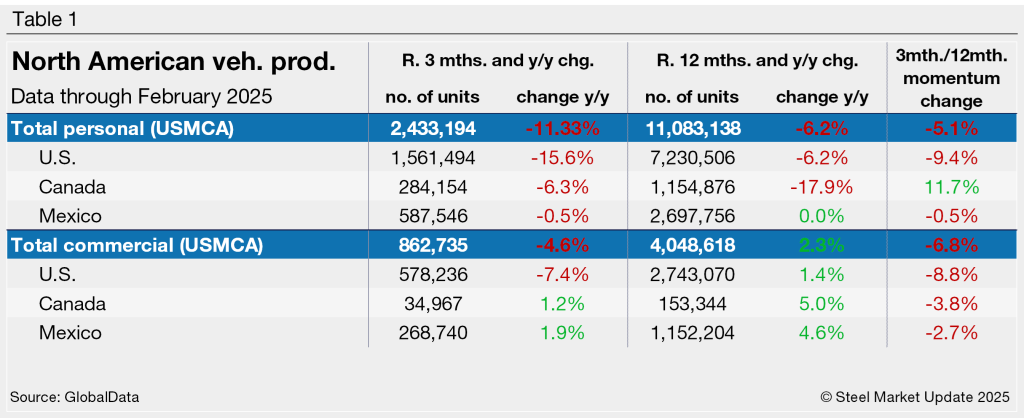
For the three months and 12 months through February, the growth rate for total personal and commercial production in the USMCA region is still lagging at a noticeable rate. The momentum shift remains in place since commercial assembly vehicle segments saw an appreciable gain from Q4’24.
Personal vehicle production
The longer-term picture of personal vehicle production across North America is shown below. The charts in Figure 2 show the total personal vehicle production for North America and the total for the US, Canada, and Mexico.
In terms of personal vehicle production, this segment saw just a 0.8% month-over-month (m/m) increase in February. Assemblies last month totaled 889,571 units, up from 882,344 units in January. It’s still, however, a whopping 12.6% below a year earlier.
The US saw a 7.5% m/m production gain, with 40,440 additional units in February. Mexico produced 6,644 fewer units (-6.2%), while Canada’s production was down 26,569 units (-11,2%).
Production share across North America was little changed. The US’ personal vehicle production share of the North American market was 64.2%, followed by Mexico and Canada at 24.1% and 11.7%, respectively.
Commercial vehicle production
Total commercial vehicle production in North America and the total for each nation within the region are shown in the first chart in Figure 3 on a rolling three-month basis. Commercial vehicle production in the US and Mexico, as well as their y/y growth rates and the production share for each nation in North America, are also shown.
North American commercial vehicle production was a bright spot in February. The region saw a 13.1% m/m increase, with a total of 319,381 units, up from 282,458 in January. February’s output was, however, 6% behind last year.
The US saw a 14.5% m/m rise, with 27,030 additional commercial vehicles assembled in February. Mexico followed, up 11.9% (+9,986 units), while Canada was down 0.7% (-93 units).
The market share across the region was also largely unchanged in February. The US total share was 67.0%, followed by Mexico with 28.9% and Canada with 4.1%.
Mexico exports just under 80% of its light-vehicle production, with the US and Canada as the highest-volume destinations.
Editor’s note: This report is based on data from GlobalData for automotive assemblies in the US, Canada, and Mexico. The breakdown of assemblies is “Personal” (cars for personal use) and “Commercial” (light vehicles with less than 6.0 metric tons gross vehicle weight rating; heavy trucks and buses are not included).