

Manufacturers/End Users
February 27, 2025
US light-vehicle sales decelerate in January
Written by David Schollaert
US light-vehicle (LV) sales slowed to an unadjusted 1.11 million units in January, a sharp cut of over 25% from December but still 3.8% above year-ago totals, according to US Bureau of Economic Analysis data.
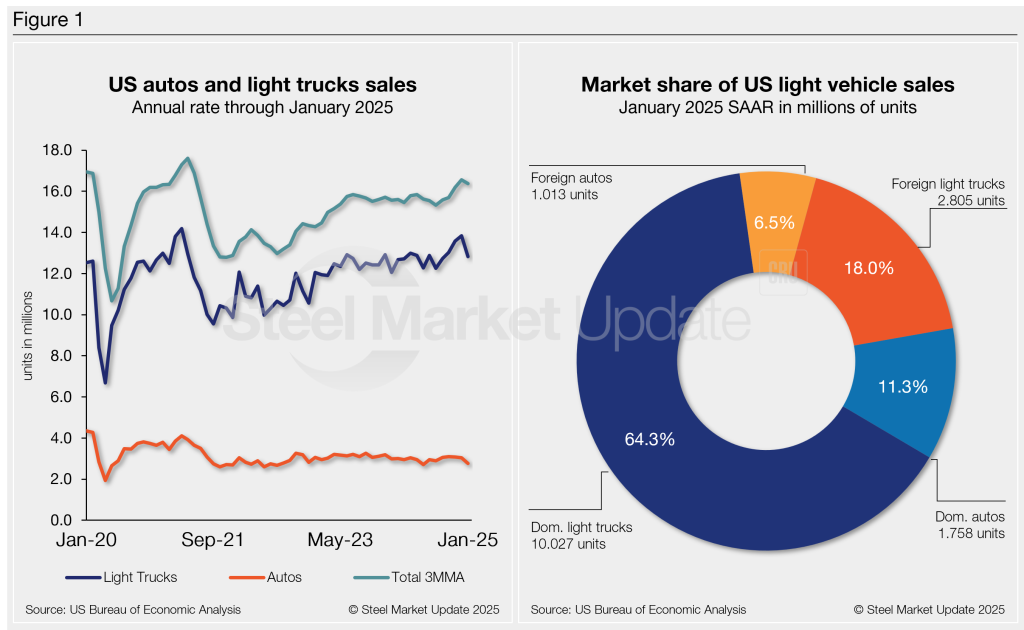
On an annualized basis, LV sales were 15.6 million units in January, down from 16.9 million units the month prior and behind the consensus forecast of 16 million.
Market conditions moderated to kick off 2025 but remained stable on aggregate. The 7.5% month-on-month (m/m) decline in auto sales was driven by several factors, highlighted by uncertainty surrounding tariff threats and the removal of EV subsidies.
Auto sales fell 7.5% y/y, while light-truck sales rose 6.5%. Light trucks accounted for 83% of January’s total sales, above the 81% share a year earlier.
January’s average daily selling rate (DSR) was 44,436 vehicles – calculated over 25 days – up 6.1% from the 42,821-unit daily rate a year earlier.
Figure 1 below shows the long-term picture of US sales of autos and lightweight trucks from 2020 through January 2025. Additionally, it includes the market share sales breakdown of last month’s 15.6 million vehicles at a seasonally adjusted annual rate.
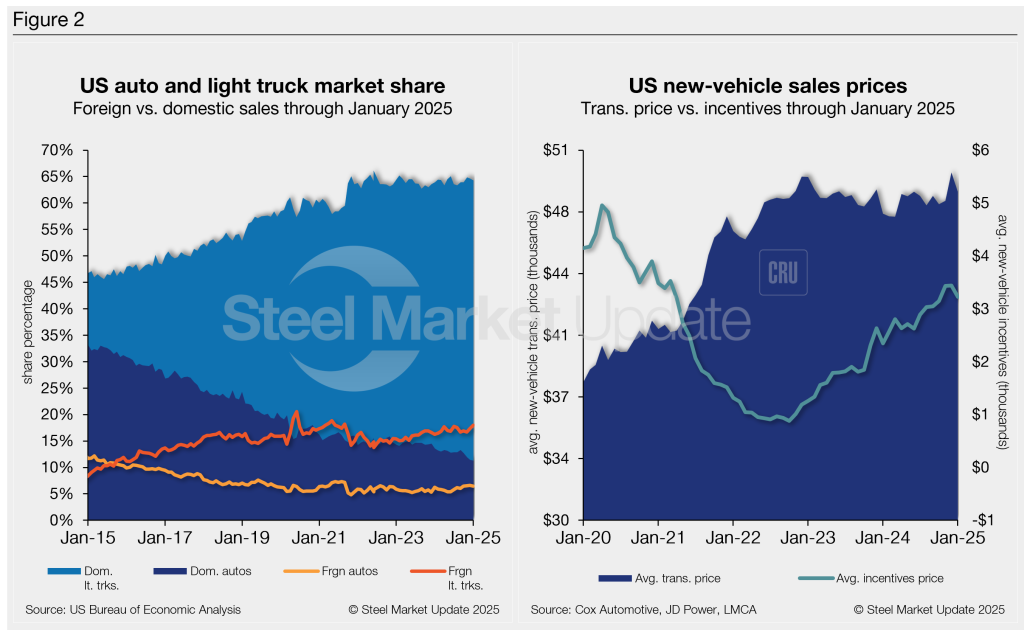
Auto production has recovered from the pandemic and is now largely above 2019 levels. The rebound has come despite the continued impact of higher average transaction prices (ATP) and ongoing financing headwinds for new vehicles.
January’s ATP was $48,641, 2.2% (-$1,099) lower m/m but 2.6% (+$1,240) higher y/y.
Incentives declined 6.3% m/m to $3,226, ticking down after reaching a 45-month high of $3,442 in December. Incentives now represent roughly 6.6% of the ATP. Compared to last year, incentives are up 37.5%, or by $880.
The annualized selling rate of light trucks for January was 12.83 million units, down 7.2% m/m but up 6.5% y/y. Annualized auto selling rates fell 8.8% m/m and 7.1% from last year.
Figure 2 details the US auto and light truck market share since 2015 and the divergence between average transaction prices and incentives in the US market since 2020.
Editor’s note: This report is based on data from the US Bureau of Economic Analysis (BEA), LMC Automotive, JD Power, and Cox Automotive for automotive sales in the US, Canada, and Mexico. Specifically, the report describes light-vehicle sales in the US.


