Analysis
November 19, 2024
Housing starts moved lower again in October
Written by David Schollaert
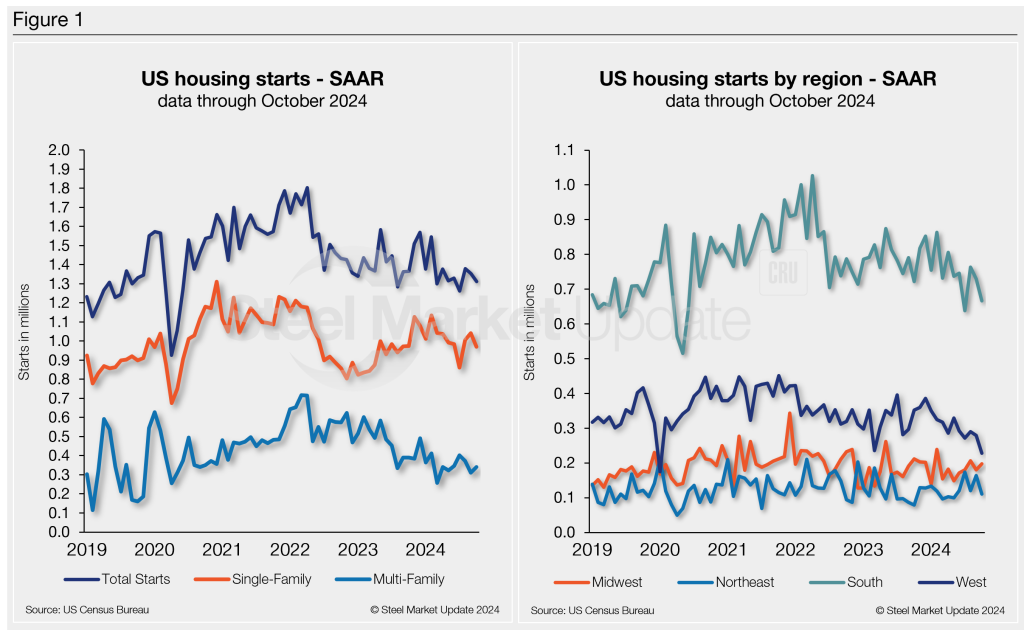
US housing starts moved lower through October, declining for a second straight month after peaking in August, according to the latest data release from the US Census Bureau.
Total housing starts stood at a seasonally adjusted annual rate (SAAR) of 1.31 million units in October, a 3.1% dip from September’s 1.35 million units.
At the same time, the overall number of privately owned housing units authorized by building permits slipped 0.6% from September to October to a SAAR of 1.416 million units. That figure is also 7.7% below October 2023. Single-family building permits were 0.5% higher m/m at 963,000 units. Multi-family permits eased 3% from September to 393,000 units.
Single-family starts
Single‐family starts in October totaled 970,000 units, down 6.9% from the upwardly revised September figure of 1.042 million units. Multi-family starts declined 9.8% month on month (m/m) to 326,000 units.
“Although housing starts declined in October, builder sentiment improved for a third straight month in November as builders anticipate an improved regulatory environment in 2025 that will allow the industry to increase housing supply,” Carl Harris, chairman of the National Association of Home Builders (NAHB), said in a statement.
He attributed anticipated growth in 2025 to lower interest rates and improved lending conditions due to additional interest rate cuts by the Federal Reserve.
Regional starts
Regionally, total housing starts were largely down across the nation from September to October, except in the Northeast, which recorded a 10.4% gain m/m. The Midwest posted a reduction 1.7%, the West was down 4.4%, and the South was off 5% because of hurricanes.
For a history of monthly housing start and building permit figures, visit the Housing Data page on our website.