Analysis
October 3, 2024
US construction spending drops again in August
Written by David Schollaert
Construction spending in the US declined for a third month in August but showed an increase year over year (y/y).
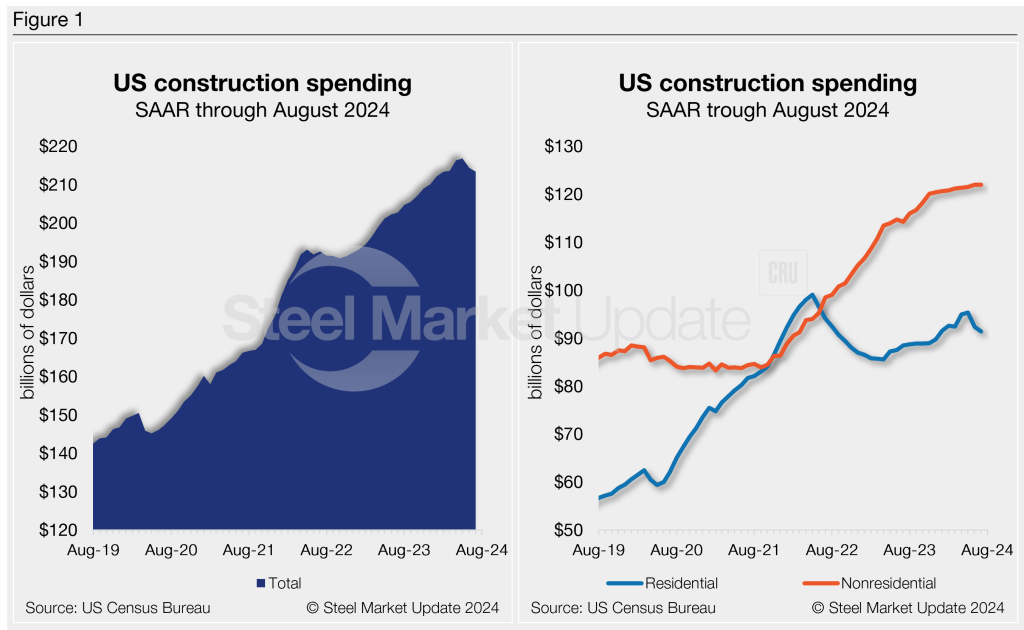
The US Census Bureau estimated construction spending to be $2.131 trillion in August on a seasonally adjusted annual rate (SAAR). While this was 0.1% below July’s revised spending rate, it was 4.1% higher than spending in August 2023.
Residential construction outlays, at $911.4 billion in August, were off 0.3% month on month (m/m) but 2.7% higher y/y.
August spending on nonresidential construction projects was up marginally m/m and was 5.2% higher y/y.
Within the non-res category, spending was highest on highway construction. Expenditures in this subcategory rose 1.1% m/m to $141.4 billion in August. State and local government spending grew by 0.3%, and outlays on federal government projects rose by 0.5%.
Census figures show a notable rise in total construction spending in recent years (see Figure 1). Spending on residential projects has more or less leveled out over the past year after peaking in 2022. At the same time, spending on nonresidential projects has continued to move higher in recent years.