Prices

October 3, 2024
HR futures: How many ways to stay the same?
Written by Daniel Doderer
While the English language is vast, there is not an endless number of ways to say, “no major changes have transpired.” And if anyone has been tasked with talking about steel price changes in the physical and futures US domestic steel market over the last four months, they are probably stretching their ability to its limit. So, after a very quiet two weeks of trading, let’s look at the overall month of September. The chart below shows Thursday’s (Oct. 3) CME Midwest HRC futures settlement curve in white, with the highest settlement from September trading in blue (Sept. 12), and the lowest in orange (Sept. 4). The lower panel shows where those periods stood vs. today’s pricing.
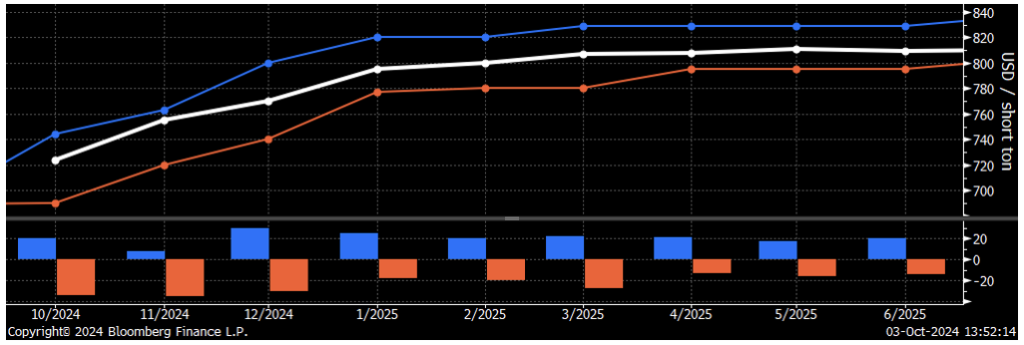
Before looking more closely at the range and months, let’s evaluate the overall shape, which is essentially unchanged and in contango. What this means for the physical market is key, a contango curve signals that the market is currently oversupplied (i.e., “tomorrow’s” value of the commodity is higher because the surplus will be resolved). While this structure is not entirely abnormal (it has happened nine times in the last decade), the length of time we have been in contango is starting to be higher than normal, currently week 26, with an average period of 19 weeks (excluding 2015-16 when we were in contango for 61 weeks).
Beyond overall structure, the current curve essentially sits in the middle of recent activity, with the widest range of trading over the month of September coming from the December contract with a total range of $60. The chart above does not provide the context of the full story of what has really happened in September, so we move to the chart below.
Q4’24 average CME Midwest HRC futures (21-day average in green)
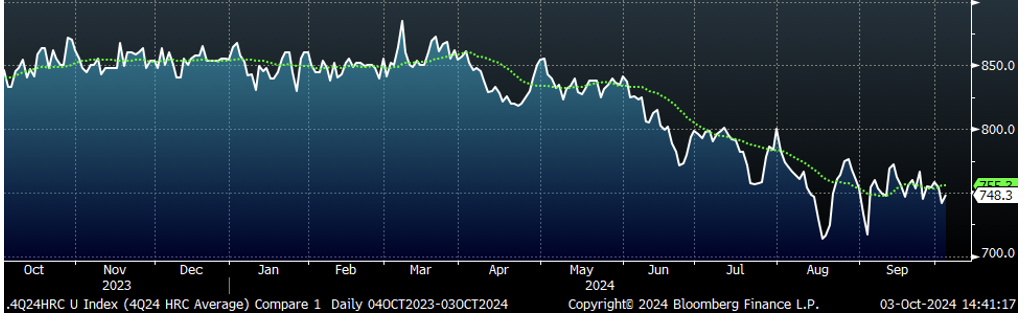
The overall one-year price chart above shows the structural decline in pricing for Q4’24, beginning in April, as the market slipped into contango/surplus territory. Zooming in on September, let’s talk about the dynamics that drove trading below:
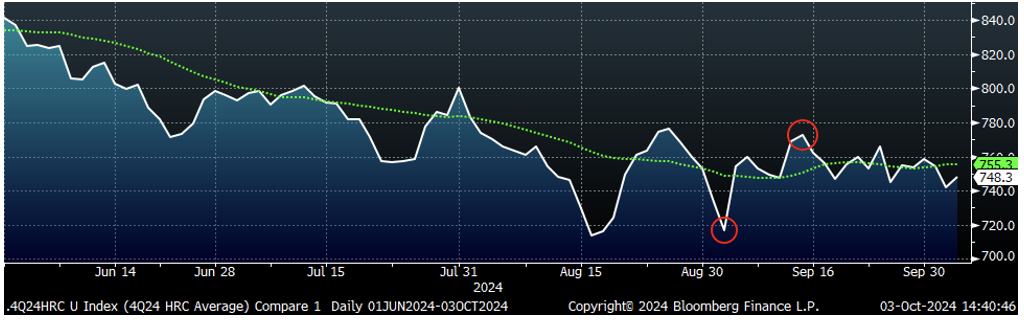
- (Sept. 4, Q4’24 average bottomed at $717). Prior to this date, physical market speculation was for prime scrap to settle down ~$20, when only a few days later Midwest Busheling settled ~$7 higher month over month (m/m).
- Sept. 5, Q4’24 average rallied to $754). Trade petitions against countries on corrosion-resistant flat-rolled steel filed.
- (Sept. 12, Q4’24 average peaked at $772). Cliffs announced they were going to take down C6 Furnace in Cleveland.
- For the remainder of the month, prices eased, and we traded in a $20 range.
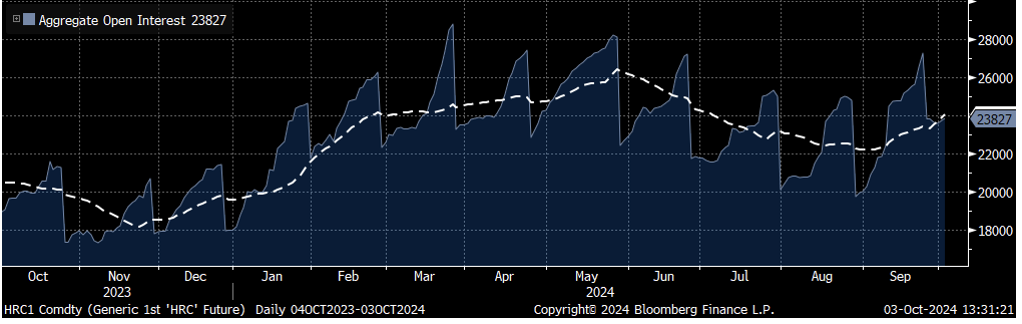
As a variety of sparks from blast furnace idling, impending trade cases, and interest rate cuts fail to drive prices in either direction, one logical conclusion could be that a lack of participation is the culprit. However, when we look at open interest and the 21-day moving average (below), it started to come to life, which makes it doubly confounding to see such a tight trading range in prices.
So, what gives? The summer demand doldrums extended into the early fall as all measures on the supply side are somewhat elevated. Weekly raw steel domestic production (until two weeks ago) had been holding above 1.7 million short tons since January. Imports are easing more slowly than anticipated (with Vietnamese coated products reaching an all-time high in August) and a two-year high in May. While inventories (when considering service centers and downstream consumers) have also been hovering around the highest levels since mid-2022. All else considered, the most likely conclusion is that much like in the physical market, we are waiting to see a recovery in demand.
Disclaimer: The content of this article is for informational purposes only. The views in this article do not represent financial services or advice. Any opinion expressed by Flack Global Metals or Flack Capital Markets should not be treated as a specific inducement to make a particular investment or follow a particular strategy, but only as an expression of his opinion. Views and forecasts expressed are as of date indicated, are subject to change without notice, may not come to be and do not represent a recommendation or offer of any particular security, strategy or investment. Strategies mentioned may not be suitable for you. You must make an independent decision regarding investments or strategies mentioned in this article. It is recommended you consider your own particular circumstances and seek the advice from a financial professional before taking action in financial markets.