Market Data
September 24, 2024
SMU Key Market Indicators are mixed, some still near historic lows
Written by David Schollaert
SMU’s Key Market Indicators include data on the economy, raw materials, manufacturing, construction, and steel sheet and long products. They offer a snapshot of current sentiment and the near-term expected trajectory of the economy.
Latest dynamics at play
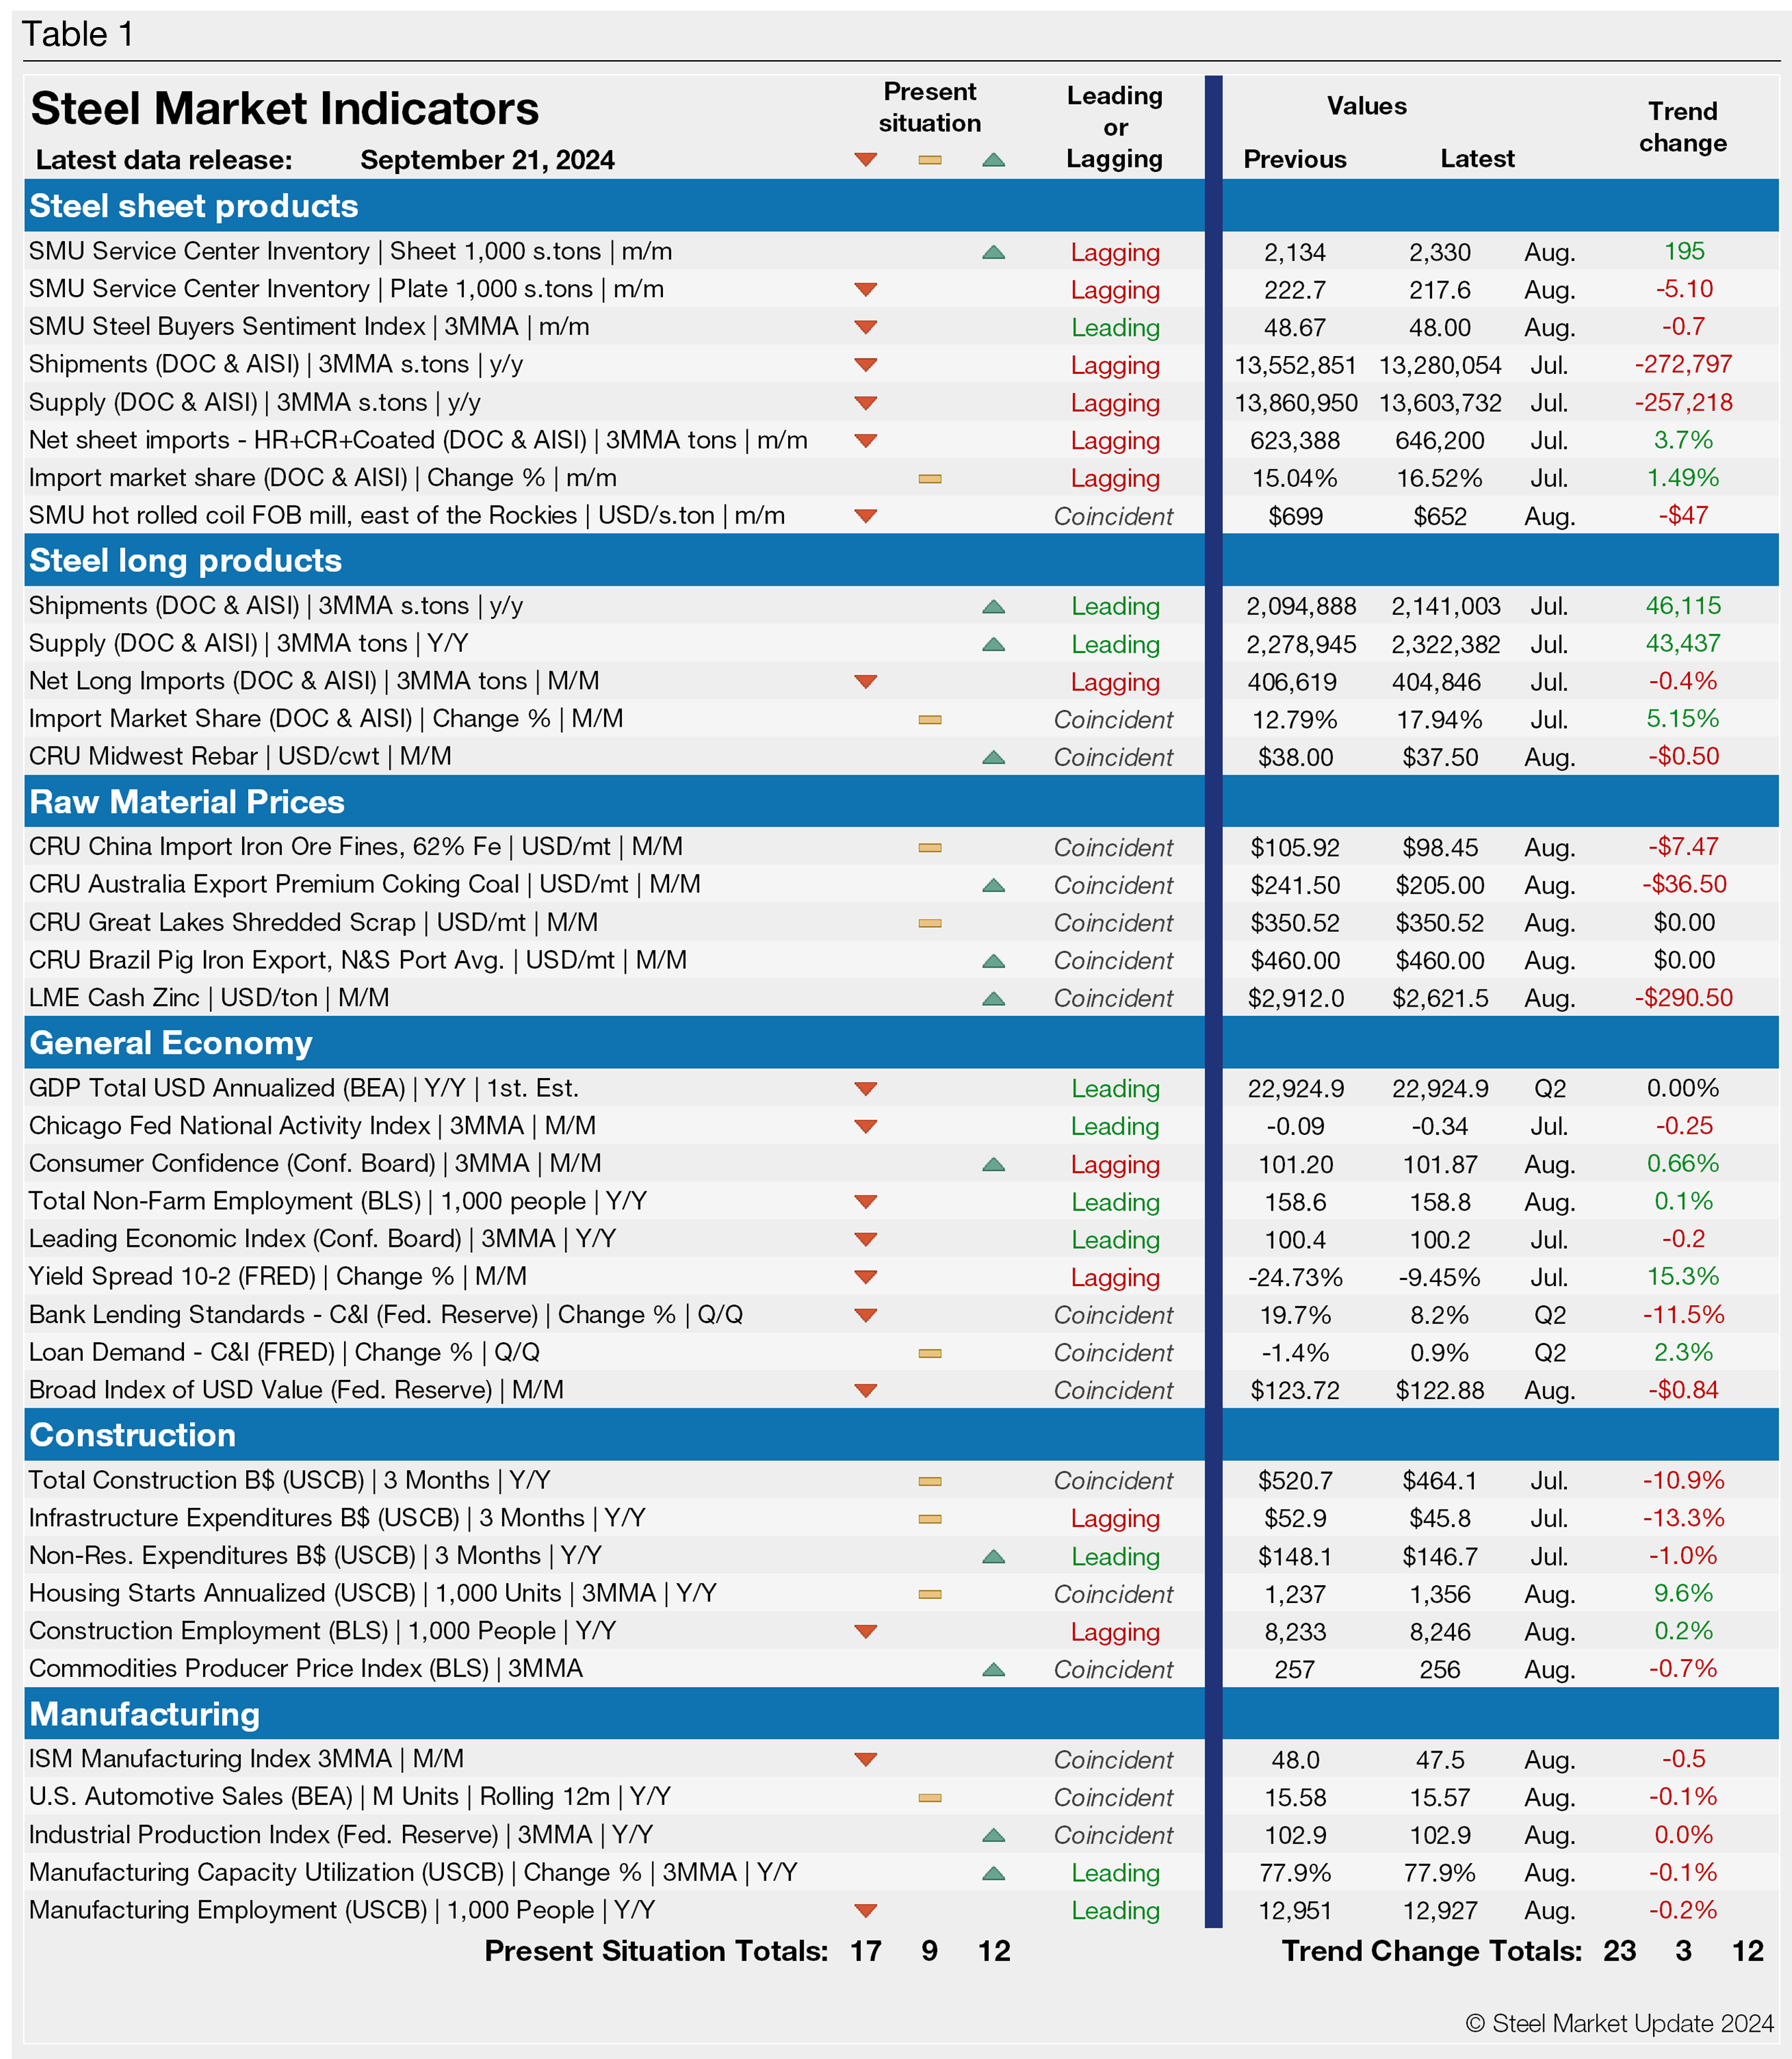
All told, 17 key indicators point lower, nine are neutral, and 12 point higher. Results are mixed with a few noteworthy details: 11 of the indicators pointing lower are lagging indicators but another six are leading indicators. Many of those pointing upward are coincident indicators, meaning they occur at approximately the same time as the conditions they signify.
Flat-rolled steel prices have been in a ‘tug-of-war’ or clash of sorts over the past several weeks. While market sentiment would suggest lower prices accentuated by dreary demand, mills continue to push tags higher.
Despite the most recent pricing dynamics, tags had been declining for the better part of the year, a trend highlighted by 17 key indicators pointing lower.
Hot-rolled (HR) coil prices have fluctuated by just $15 per short ton (st) over the past five weeks, and at $690/st – according to SMU’s check of the market on Tuesday, Sept. 17 – are just $55/st from their lowest mark since December 2022.
Lead times are now 4.9 weeks on average for HR coil. They have been largely stable since early Q2, hovering around five weeks on average since late April. And while mills remain largely flexible on prices as they seek business beyond contracted tons, they have been a bit less willing to talk price in recent weeks.
SMU’s Steel Buyers’ Sentiment Indices, however, both edged lower following a slight recovery in late August. Current Sentiment is still near a four-year low. And Future Sentiment indicates that buyers are still mixed about business prospects.
Broadly speaking, while some SMU indicators are at recent lows, others remain near historic lows. Still others have improved. The lack of a clear direction is perhaps best characterized by the fact that many indicators remain in a holding pattern.
Despite recent improvements, headwinds remain
The Labor Department’s Bureau of Labor Statistics (BLS) reported that while consumer prices improved 0.2% in August, inflation being the lowest since February 2021, core CPI increased 0.3% last month.
And the US economy added just 142,000 jobs in August. That’s slightly above July, but the poor showing reinforces a consensus view that the US labor market is slowing but not breaking.
However, gross domestic product (GDP) increased at an annual rate of 3% in Q2 after a poor showing of just 1.4% in Q1. Economists expect an annualized growth rate of 2.2% in Q3 after a better-than-expected update on retail sales in August. But that figure is subdued compared to the second half of last year.
Consumer spending continued to prop up economic growth, despite economists’ projections that retail sales would sputter out. The Fed slashed interest rates by half a point in its first interest rate cut since the early days of Covid-19.
SMU’s Present Situation and Trends analyses in the table below are based on the latest available data as of Sept. 21. Readers should regard the color codes in the “Present Situation” column as a visual summary of the current market condition.
The “Trend” columns are color-coded to give a quick visual snapshot of the market’s direction. All data included in this table was released within the past month. The month or specific date to which the data refers to is shown in the second column from the far right. Click to expand the table below.